Learning Nagios 4 (2014)
Chapter 7. Passive Checks and NSCA
Nagios is a very powerful platform because it is easy to extend. The previous chapters talked about the check command plugins and how they can be used to check any host or service that your company might be using. Another great feature that Nagios offers is the ability for third-party software or other Nagios instances to report information on the status of services or hosts. This way, Nagios does not need to schedule and run checks by itself; other applications can report information as it is available to them. In this chapter we will cover the following topics:
· Understanding the difference between active and passive checks
· Setting up passive checks in Nagios as well as enabling them for specific hosts and services
· Troubleshooting common errors related to passive checks
· An overview of what NSCA is
· Setting up the NSCA server to allow receiving check results
· Submitting host and service check results using the NSCA client binary
· Configuring NSCA for secure communication
Understanding passive checks
The previous parts of this book often mentioned Nagios performing checks on various software and machines. In such cases, Nagios decides when a check is to be performed, runs the check, and stores the result. These types of checks are called active checks.
Nagios also offers another way to work with the statuses of hosts and services. It is possible to configure Nagios so that it will receive status information sent over a command pipe. In such cases, checks are done by other programs and their results are sent to Nagios. Nagios will still handle all notifications, event handlers, and dependencies between hosts and services.
Active checks are most common in the Nagios world. They have a lot of advantages and some disadvantages. One of the problems is that such checks can take only a few seconds to complete; a typical timeout for an active check to complete is 10 or 30 seconds. In many cases, the time taken is not enough as some checks need to be performed over a longer period of time to have satisfactory results. A good example might be running a check that takes several hours to complete; in this case, it does not make sense to raise the global service_check_timeout option. Instead, schedule these checks outside of Nagios and only report the results back after the checks are complete.
There are also different types of checks including external applications or devices that want to report information directly to Nagios. This can be done to gather all critical errors in a single, central place. These types of checks are called passive checks.
For example, when a web application cannot connect to the database, it will let Nagios know about it immediately. It can also send reports after a database recovery, or periodically, even if connectivity to the database has consistently been available, so that Nagios has an up-to-date status. This can be done in addition to active checks to identify critical problems earlier.
Another example is where an application already processes information such as network bandwidth utilization. In this case, adding a module that reports current utilization along with the OK/WARNING/CRITICAL state to Nagios seems much easier than using active checks for the same job.
Often, there are situations where active checks obviously fit better. In other cases, passive checks are the way to go. In general, if a check can be done quickly and does not require long-running processes, it should definitely be done as an active service. If the situation involves reporting problems that will be sent independently by Nagios from other applications or machines, it is definitely a use case for a passive check. In cases where the checks require the deployment of long-running processes or monitoring information constantly, this should be done as a passive service.
Another difference is that active checks require much less effort to be set up when compared to passive checks. In the first case, Nagios takes care of the scheduling, and the command only needs to perform the actual checks and mark the results asOK/WARNING/CRITICAL based on how a check command is configured. Passive checks require all the logic related to what should be reported and when it should be checked to be put in an external application. This usually calls for some effort.
The following diagram shows how both active and passive checks are performed by Nagios. It shows what is performed by Nagios in both cases and what needs to be done by the check command or an external application for passive checks.
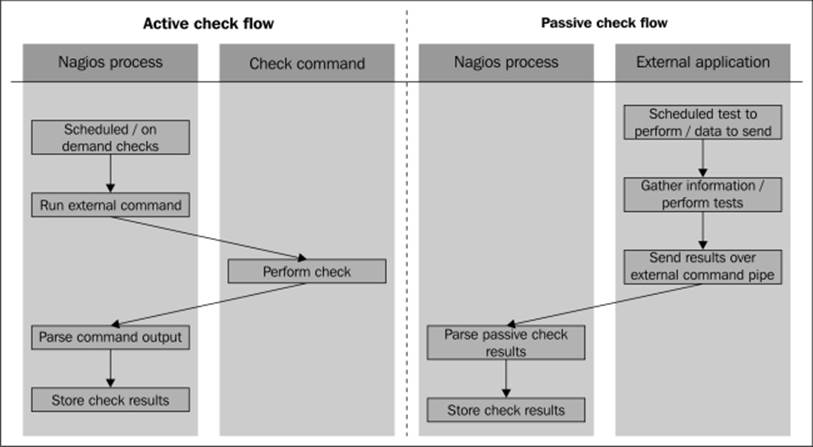
Nagios also offers a way of combining the benefits of both active and passive checks. Often, you have situations where other applications can report whether a certain service is working properly or not. However, if the monitoring application is not running or some other issue prevents it from reporting, Nagios can use active checks to keep the service status up-to-date.
A good example would be a server that is a part of an application processing job queues using a database. It can report each problem when accessing the database. We want Nagios to monitor this database, and as the application is already using it, we can add a module that reports this to Nagios.
The application can also periodically let Nagios know if it succeeded in using the database without problems. However, if there are no jobs to process and the application is not using it, Nagios will not have up-to-date information about the database.
Configuring passive checks
The first thing that needs to be done in order to use passive checks for your Nagios setup is to make sure that you have the following options in your main Nagios configuration file, such as /etc/nagios/nagios.cfg, if Nagios was set up according to instructions fromChapter 2, Installing Nagios 4:
accept_passive_service_checks=1
accept_passive_host_checks=1
It would also be good to enable the logging of incoming passive checks; this makes determining the problem of not processing a passive check much easier. The following directive allows it:
log_passive_checks=1
Setting up hosts or services for passive checking requires an object to have the passive_checks_enabled option set to 1 for Nagios to accept passive check results over the command pipe. If only passive checks will be sent to Nagios, it is also advised that you disable active checks by setting the active_checks_enabled option to 0. The following is an example of the required configuration for a host that accepts passive checks and has active checks disabled:
define host
{
use generic-host
host_name linuxbox01
address 10.0.2.1
active_checks_enabled 0
passive_checks_enabled 1
}
Configuring services is exactly the same as with hosts. For example, to set up a very similar service, all we need to do is to use the same parameters as those for the hosts:
define service
{
use ping-template
host_name linuxbox01
service_description PING
active_checks_enabled 0
passive_checks_enabled 1
}
In this case, Nagios will never perform any active checks on its own and will only rely on the results that are passed to it. We can also configure Nagios so that if no new information has been provided within a certain period of time, it will use active checks to get the current status of the host or service. If up-to-date information has been provided by a passive check during this period, then it will not perform active checks.
In order to do this, we need to enable active checks by setting the active_checks_enabled option to 1 without specifying the normal_check_interval directive. For Nagios to perform active checks when there is no up-to-date result from passive checks, you need to set the check_freshness directive to 1 and set freshness_threshold to the duration after which a check should be performed. The time specified in the freshness_threshold option is specified in seconds.
The first parameter tells Nagios that it should check whether the results from the checks are up-to-date. The next parameter specifies the number of seconds after which Nagios should consider the results to be out of date. Attributes can be used for both hosts and services. A sample definition for a host that runs an active check if there has been no result provided within the last two hours is as follows:
define host
{
use generic-host
host_name linuxbox02
address 10.0.2.2
check_command check-host-alive
check_freshness 1
freshness_threshold 7200
active_checks_enabled 1
passive_checks_enabled 1
}
The following is an illustration showing when Nagios will invoke active checks:
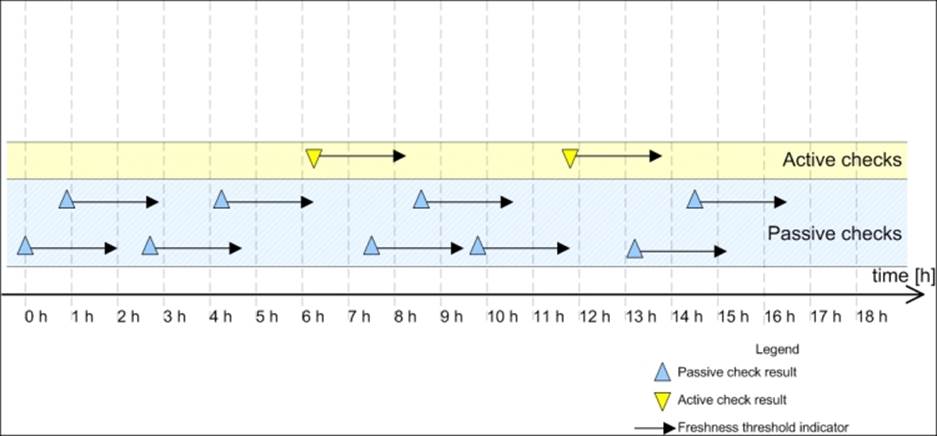
Each time there is at least one passive check result that is still valid (in other words, that was received within the past two hours), Nagios will not perform any active checks. However, two hours after the last passive or active check result is received, Nagios will perform an active check to keep the results up-to-date.
Sending passive check results for hosts
Nagios allows applications and event handlers to send out passive check results for host objects. In order to use them, the host needs to be configured to accept passive check results. In order to be able to submit passive check results, we need to configure Nagios to allow the sending of passive check results and set the host objects to accept them.
Submitting passive host check results to Nagios requires sending a command to the Nagios external command pipe. This way, the other applications on your Nagios server can report the status of the hosts.
The command to submit passive checks is PROCESS_HOST_CHECK_RESULT (visit http://www.nagios.org/developerinfo/externalcommands/commandinfo.php? command_id=115). This command accepts the hostname, status code, and the textual output from a check. The host status code should be 0 for an UP state, 1 for DOWN, and 2 for an UNREACHABLE state. The following is a sample script that will accept the hostname, status code, and output from a check and will submit these to Nagios:
#!/bin/sh
NOW=`date +%s`
HOST=$1
STATUS=$2
OUTPUT=$3
echo "[$NOW] PROCESS_HOST_CHECK_RESULT;$HOST;$STATUS;$OUTPUT" \
>/var/nagios/rw/nagios.cmd
exit 0
As an example of the use of this script, the command sent to Nagios for host01, status code 2 (UNREACHABLE), and output router 192.168.1.2 down would be as follows:
[1206096000] PROCESS_HOST_CHECK_RESULT;host01;2;router 192.168.1.2 down
While submitting results, it is worth noting that Nagios might take some time to process them, depending on the intervals between checks of the external command pipe in Nagios. Unlike active checks, Nagios will not take network topology into consideration by default. This is very important in situations where a host behind a router is reported to be down because the router is actually down.
By default, Nagios handles results from active and passive checks differently. When Nagios plans and receives results from active checks, it takes the actual network topology into consideration and performs a translation of the states based on these results. This means that if Nagios receives a result indicating that a host is down, it assumes that all child hosts are in an UNREACHABLE state.
When a passive result check comes in to Nagios, Nagios expects that the result already has a network topology included. When a host is reported to be DOWN as a passive check result, Nagios does not perform a translation from DOWN to UNREACHABLE. Even if its parent host is currently DOWN, the child host state is also stored as DOWN.
How Nagios handles passive check results can be defined in the main Nagios configuration file. In order to make Nagios treat passive host check results in the same way as active check results, we need to enable the following option:
translate_passive_host_checks=1
By default, Nagios treats host results from passive checks as hard results. This is because, very often, passive checks are used to report host and service statuses from other Nagios instances. In such cases, only reports regarding hard state changes are propagated across Nagios servers. If you want Nagios to treat all passive check results for hosts as if they were soft results, you need to enable the following option in the main Nagios configuration file:
passive_host_checks_are_soft=1
Sending passive check results for services
Passive service checks are very similar to passive host checks. In both the cases, the idea is that Nagios receives information about host statuses over the external command pipe. As with passive checks of hosts, all that is needed is to enable the global Nagios option to accept passive check results and to also enable this option for each service that should allow the passing of passive check results.
The results are passed to Nagios in the same way as they are passed for hosts. The command to submit passive checks is PROCESS_SERVICE_CHECK_RESULT (visit http://www.nagios.org/developerinfo/externalcommands/commandinfo.php? command_id=114 for more details). This command accepts the hostname, service description, status code, and the textual output from a check. Service status codes are the same as those for active checks—0 for OK, 1 for WARNING, 2 for CRITICAL, and 3 for an UNKNOWN state. The following is a sample script that will accept the hostname, status code, and output from a check and submit these to Nagios:
#!/bin/sh
CLOCK=`date +%s`
HOST=$1
SVC=$2
STATUS=$3
OUTPUT=$4
echo "[$CLOCK] PROCESS_SERVICE_CHECK_RESULT;$HOST;$SVC;$STATUS;$OUTPUT">/var/nagios/rw/nagios.cmd
exit 0
As a result of running the script, the command that is sent to Nagios for host01, service PING, status code 0 (OK), and output RTT=57 ms is as follows:
[1206096000] PROCESS_SERVICE_CHECK_RESULT;host01;PING;0;RTT=57 ms
A very common scenario for using passive checks is a check that takes a very long time to complete. When submitting results, it is worth noting that Nagios might take some time to process them, depending on the intervals between checks of the external command pipe in Nagios.
A major difference between hosts and services is that service checks differentiate between soft and hard states. When new information regarding a service gets passed to Nagios via the external command pipe, Nagios treats it in the same way as if it had been received by an active check. If a service is set up with a max_check_attempts directive of 5, then the same number of passive check results would be needed in order for Nagios to treat the new status as a hard state change.
The passive service checks are often used to report the results of long lasting tests that were run asynchronously. A good example of such a test is checking whether there are bad blocks on a disk. This requires trying to read the entire disk directly from the block device (such as /dev/sda1) and checking if the attempt has failed. This can't be done as an active check as reading the device takes a lot of time and larger disks might require several hours to complete. For this reason, the only way to perform such a check is to schedule it from the system, for example, by using the cron daemon (visit http://man.linuxquestions.org/index.php?query=cron). The script should then post results to the Nagios daemon.
The following is a script that runs the dd system command (visit http://man.linuxquestions.org/index.php?query=dd) to read an entire block device. Based on whether the read was successful or not, the appropriate status code along with the plugin output is sent out.
#!/bin/sh
SVC=$1
DEVICE=$2
TMPFILE=`mktemp`
NOW=`date +%s`
PREFIX="[$NOW] PROCESS_SERVICE_CHECK_RESULT;localhost;$SVC"
# try to read the device
dd bs=1M if=$DEVICE of=/dev/null >$TMPFILE 2>&1
CODE=$?
RESULT=`grep copied <$TMPFILE`
rm $TMPFILE
if [ $CODE == 0 ] ; then
echo "$PREFIX;0;$RESULT"
else
echo "$PREFIX;2;Error while checking device $DEVICE"
fi
exit 0
If the check fails, then a critical status, along with text stating that there was a problem checking the specific device, is sent out to Nagios. If the check was successful, an output mentioning number of bytes and the speed of transfer is sent out to Nagios. A typical output would be something like this:
254951424 bytes (255 MB) copied, 9.72677 seconds, 26.2 MB/s
The hostname is hardcoded to localhost. Using this script requires configuring a service to have active checks disabled and passive checks enabled. As the checks will be done quite rarely, it's recommended that you set max_check_attempts to 1. It is also possible to use the badblocks (please visit http://linux.die.net/man/8/badblocks for more details) command to check for bad blocks on a hard drive.
Troubleshooting errors
It's not always possible to set up passive checks correctly the first time. In such cases, it is a good thing to try to debug the issue one step at a time in order to find any potential problems. Sometimes, the problem could be a configuration issue, while in other cases, it could be an issue such as the mistyping of the host or service name.
One thing worth checking is whether the Web UI shows changes after you have sent the passive result check. If it doesn't, then at some point, things are not working correctly. The first thing you should start with is enabling the logging of external commands and passive checks. To do this, make sure that the following values are enabled in the main Nagios configuration file:
log_external_commands=1
log_passive_checks=1
In order for the changes to take effect, a restart of the Nagios process is needed. After this has been done, Nagios will log all commands passed via the command pipe and log all of the passive check results it receives.
A very common problem is that the application or script cannot write data to the Nagios command pipe. In order to test this, simply try to write to the Nagios external command pipe in the same manner that the application/script's user is running. For example, if the script is running as the user daemon, try the following as root:
root@ubuntuserver:# su –s/bin/sh daemon
$ echo TEST >/var/nagios/rw/nagios.cmd
The su command will switch the user to the specified user. The next line is run as the user daemon and an attempt to write to the Nagios external command pipe is made. The -s flag for the su command forces /bin/sh as the shell to use. It is useful in cases where the user's default shell is not a proper shell, that is, it is set to /bin/false for security reasons to prevent the account from interactive shell access.
If the preceding command runs fine and no errors are reported, then your permissions are set up correctly. If an error shows up, you should add the user to the nagioscmd group as described in Chapter 2, Installing Nagios 4. The following command will add the userdaemon to the nagioscmd group:
root@ubuntuserver:# adduser daemon nagioscmd
The next thing to do is to manually send a passive check result to the Nagios command pipe and check whether the Nagios log file was received and parsed correctly. To do this, run the following command as the same user that the application or script is running as:
root@ubuntuserver:# su –s/bin/sh daemon
$ echo "[`date +%s`] PROCESS_HOST_CHECK_RESULT;host1;2;test" \
>/var/nagios/rw/nagios.cmd
The name host1 needs to be replaced with an actual hostname from your configuration. A few seconds after running this command, the Nagios log file should reflect the command that we have just sent. You should see the following lines in your log:
EXTERNAL COMMAND: PROCESS_HOST_CHECK_RESULT;host1;2;test
[1220257561] PASSIVE HOST CHECK: host1;2;test
If both of these lines are in your log file, then we can conclude that Nagios has received and parsed the command correctly. If only the first line is present, then it means either that the option to receive passive host check results is disabled globally or that it is disabled for this particular object. The first thing you should do is to make sure that your main Nagios configuration file contains the following line:
accept_passive_host_checks=1
Next, you should check your configuration to see whether the host definition has passive checks enabled as well. If not, simply add the following directive to the object definition:
passive_checks_enabled 1
If you have misspelled the name of the host object, then the following will be logged:
Warning: Passive check result was received for host 'host01',
but the host could not be found!
In this case, make sure that your hostname is correct. Similar checks can also be done for services. You can run the following command to check if a passive service check is being handled correctly by Nagios:
root@ubuntuserver:# su –s/bin/sh daemon
$ echo "[`date +%s`] PROCESS_SERVICE_CHECK_RESULT;host1;APT;0;test" \
>/var/nagios/rw/nagios.cmd
Again, host1 should be replaced by the actual hostname, and APT needs to be an existing service for that host. After a few seconds, the following entries in the Nagios log file (/var/nagios/nagios.log) will indicate that the result has been successfully parsed:
EXTERNAL COMMAND: PROCESS_SERVICE_CHECK_RESULT;host1;APT;0;test
PASSIVE SERVICE CHECK: host1;APT;0;test
If the second line is not in the log file, there are two possible causes. One is that the global option to accept service passive checks by Nagios is disabled. You should start by making sure that your main Nagios configuration file (/etc/nagios/nagios.cfg) contains the following line:
accept_passive_service_checks=1
The other possibility is that the host does not have passive checks enabled. You should make sure that the service definition has passive checks enabled as well, and if not, add the following directive to the object definition:
define host
{
host_name host1
passive_checks_enabled 1
}
If you have misspelled the name of the host or service, then the following information will be logged in the Nagios log file:
Warning: Passive check result was received for service 'APT' on host
'host1', but the service could not be found!
Using NSCA
Passive checks are sent to Nagios via the external command pipe. As it is a named pipe on a specific machine, the main problem is that all passive check results need to be sent from this machine.
Very often, checks need to be carried out on one or more remote hosts. This requires a mechanism to pass results from the machines that perform the tests to the computers running the Nagios daemon, which will process the results. This is why NSCA was developed. It is a client-server application that allows the passing of service and host check results over the network. This protocol allows the use of encryption, so the results are sent securely.
NSCA allows the sending of results directly to the Nagios external command pipe. It consists of two parts: the server and the client. The part responsible for receiving check results and passing them to Nagios is the server. The server listens on a specific TCP port for NSCA clients passing information. It accepts and authenticates incoming connections and passes these results to the Nagios external command pipe. All information is encrypted using the MCrypt library (visit http://mcrypt.sourceforge.net/).
The client part accepts one or more host or service check results on a standard input and sends them to the NSCA server using the specified IP address and port. Each line received on the standard input is a single check result that should be sent to the NSCA server. An NSCA client can be used to transmit more than one result over a period of time. Therefore, it is not necessary to launch a new NSCA client instance for each new result.
Authentication is done using the MCrypt libraries for encryption, and NSCA uses a password to verify that the status message is valid. You should either generate a random password or choose a password that is not dictionary based and use uppercase and lowercase letters as well as one or more digits. It is necessary to specify the same encryption method along with exactly the same password for both the client and the server in order for it to work properly. The following illustration shows how passive checks are done on the same host as well as when sent over the network using NSCA:
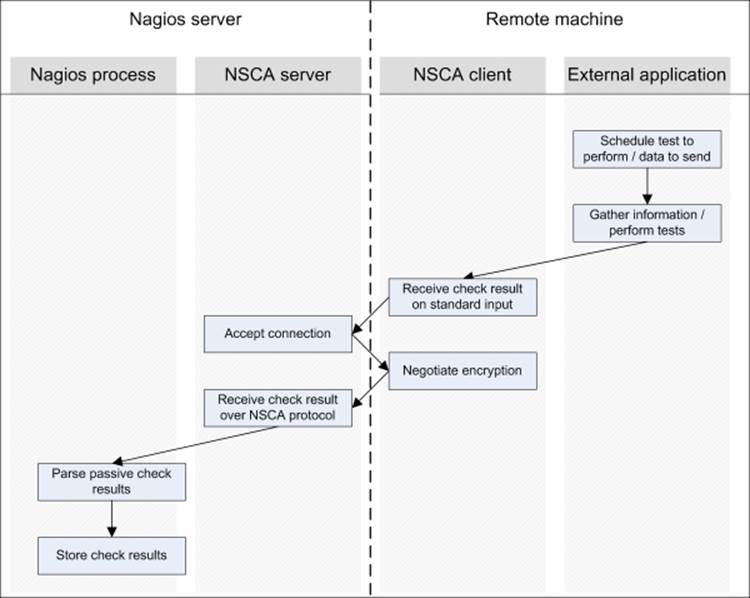
This example shows how the results are passed down directly from an external application to the Nagios daemon. Most complex operations are performed directly by NSCA. The application only needs to gather results from the check or checks, spawn the send_nscabinary, and make sure that the results are sent out properly.
NSCA is also commonly used in conjunction with distributed Nagios monitoring. This means that more than one computer runs a Nagios server and the results are distributed between Nagios servers running on different machines. In such cases, NSCA is often used to pass information from one machine to another (this is known as distributed monitoring and is described in detail in Chapter 10, Advanced Monitoring).
Downloading NSCA
NSCA is a part of the main Nagios project, and its source code can be downloaded from the same Nagios download page as the rest of Nagios. Many Linux distributions already contain prebuilt NSCA binaries. If you are not an experienced user and just want to test NSCA out, you might want to try the prebuilt binaries.
For Ubuntu Linux, the package name is nsca. So all that you need to do is to run the following command:
apt-get install nsca
For systems that offer yum for downloading packages, the command is as follows:
yum install nsca
NSCA binaries for various operating systems can also be found on Nagios Exchange, at http://exchange.nagios.org/. There is also a binary for Microsoft Windows operating systems. This allows the creation of applications that monitor desktop computers and report the results directly to Nagios.
In order to build NSCA from sources, we will need to download the source code. This can be downloaded from the Nagios project page and can be found in the addons section (visit http://www.nagios.org/download/addons/ for more details). The file is named in the format nsca-2.9.1.tar.gz, where 2.9.1 is the version of NSCA. It is always recommended that you download the latest version.
Compiling NSCA
Note
If you do not plan to compile NSCA from the source and intend to use a prebuilt set of binaries, you should continue to the next section.
NSCA requires a small set of prerequisites to be installed on the system which include a standard set of tools, required for compilation, to be present on the system. For encryption, the libmcrypt package, along with the development files, needs to be installed as well. On an Ubuntu Linux system, this requires the installation of the packages by executing the following command:
apt-get install gcc make binutils cpp pkg-config libmcrypt-dev libc6-dev
For RedHat Enterprise Linux and CentOS, the command is as follows:
yum install gcc make binutils cpp pkgconfig mcrypt-devel glibc-devel
For other Linux distributions, the commands to run and install the packages and package names might be slightly different, but the package names should be similar to that of either Ubuntu or RedHat/CentOS packages. Please make sure that you install the standard compilation utilities as you might often be building NSCA for machines that you did not compile Nagios on. This means that they might not have the basic development libraries and compiler installed.
The next step is to run the configuration script to set up parameters for the compilation process. Assuming that we want NSCA to be installed in the same way as the Nagios setup (detailed in Chapter 2, Installing Nagios 4), the following configure script should be run:
sh configure \
--sysconfdir=/etc/nagios \
--prefix=/opt/nagios \
--localstatedir=/var/nagios \
--libexecdir=/opt/nagios/plugins \
--with-nsca-user=nagios \
--with-nsca-grp=nagioscmd
In case any of the tools or files are missing, the configuration script will abort indicating what the missing part is. If this happens, you should install the missing binaries or libraries. How you should do this depends on the exact operating system and distribution used. For Ubuntu systems, it should be by using the same command as the one used for building Nagios:
apt-get install gcc make binutils cpp libpq-dev libmysqlclient15-dev\
libssl0.9.8 libssl-dev pkg-config apache2 \
libgd2-xpm libgd2-xpm-dev libgd-tools \
libpng12-dev libjpeg62-dev \
perl libperl-dev libperl5.8 libnet-snmp-perl
After a successful run of the configuration script, you should see a message stating that you can now build NSCA binaries. The next step is to run the following make command to build the NSCA client and server:
make all
If you plan to build only the client or server part, use the make send_nsca or make nsca commands, respectively. If the compilation of NSCA has failed with src/nsca.c line 480 or similar, it may be because of a bug present in the latest NSCA version at the time of writing this book. The bug is documented at http://tracker.nagios.org/view.php?id=379 and the fix is to change line 480 of src/nsca.c to:
checkresult_test_fd=open(checkresult_test,O_WRONLY|O_CREAT,0644);
The binaries are built as src/send_nsca and src/nsca. The first one is the NSCA client, and the other one is the server. You can install the binaries by running the following command manually:
install src/nsca /opt/nagios/bin/nsca
install src/send_nsca /opt/nagios/bin/send_nsca
You can also copy the binaries manually: copy the send_nsca client to the machines that will send the results to Nagios, and send nsca to the machine where Nagios is running. However, this may cause library incompatibilities and is only recommended when both the target machine and machine where the binaries were built are using same operating system, version, and are both either 32-bit or 64-bit machines, that is, it is not recommended that you copy binaries from a 32-bit Ubuntu Linux system to a 64-bit CentOS system.
Configuring the NSCA server
Now that we have working binaries for the NSCA server, either compiled from sources or installed from packages, we can proceed with configuring the NSCA server to listen for incoming connections. There are a couple of ways in which it can be set up: as a standalone process that handles incoming connections, as part of inetd (visit http://en.wikipedia.org/wiki/inetd), or as the xinetd setup (visit http://www.xinetd.org/). In either case, we will need a configuration file that will tell it which encryption algorithm to use and the password that will be used to authenticate NSCA client connections. NSCA also needs to know the path of the Nagios external command pipe.
The main difference between these two installation types is that the standalone version requires fewer resources to handle a larger number of incoming connections. On the other hand, inetd- or xinetd-based NSCA is much easier to set up. An inetd-based setup is easier to maintain. Several inetd implementations also allow the configuration of connections only from specific IP addresses or the acceptance of connections only from specific users for Unix systems. There is no ideal way in which NSCA should be set up.
The configuration file is similar to that of the main Nagios configuration file: each parameter is written in the format <name>=<value>. If you compiled NSCA from the source, a default configuration can be found in the sample-config/nsca.cfg file.
The first parameter that should be set is password. This should be set to the same value for the NSCA server and all NSCA clients. It's best to set it to a random string. Using a dictionary-based password might leave your Nagios setup susceptible to attacks; malicious users might send fake results that cause event triggers to perform specific actions.
Another option that needs to be set is decryption_method, which specifies the algorithm to be used for encryption. This is an integer value. A list of possible values and what they mean can be found in the sample configuration file. Both decryption_method and passwordneed to be set to the same value on the server side and the client side. A sample configuration is as follows:
server_address=192.168.1.1
server_port=5667
nsca_user=nagios
nsca_group=nagioscmd
command_file=/var/nagios/rw/nagios.cmd
password=ok1ij2uh3yg
decryption_method=1
The server_address option is optional and specifies the IP address that NSCA should listen for. If omitted, NSCA will listen on all available IP addresses for incoming connections. When it is specified, NSCA will only accept connections from the specified IP address. The specified decryption_method value of 1 means XOR, which provides no encryption and should not be used in production. Security and proper configuration of encryption is described in detail later in this chapter.
The remainder of this section will assume that the NSCA server configuration file is located at /etc/nagios/nsca.cfg. At this point, it is good to create an NSCA configuration based on the preceding example or the sample NSCA configuration file, nsca.cfg.
The fastest way to start NSCA is to start it manually in standalone mode. In this mode, NSCA handles listening on the specified TCP port and changing the user/group by itself. To do this, simply run the NSCA binary with the following parameters:
/opt/nagios/bin/nsca -c /etc/nagios/nsca.cfg --daemon
If you plan to have NSCA start up along with Nagios, it is a good idea to add a line to your /etc/init.d/nagios script that runs Nagios at system boot. Running NSCA should go in the start section, and stopping NSCA (via the killall command—seehttp://en.wikipedia.org/wiki/killall—or by using the pid file) should be put in the stop section of the init script. The NSCA source distribution also comes with a script that can be placed as /etc/init.d/nsca to start and stop the NSCA server.
Another possibility is to configure NSCA to run from the inetd or xinetd super-server daemons. This requires adding the definition of the NSCA server to the proper configuration files, and those daemons will handle accepting connections and spawning actual NSCA processes when needed. In order to add the NSCA definition to inetd or xinetd, we first need to add a service definition of the TCP port used. In order to do that, we need to add the following line to the /etc/services file:
nsca 5667/tcp
This will indicate that TCP port 5677 maps to the service name nsca. This information is used later by the super-server daemons to map port numbers to names in the configuration. For inetd, we also need to add the service configuration to the /etc/inetd.conf file. A sample definition is as follows:
nsca stream tcp nowait nagios /opt/nagios/bin/nsca -c /etc/nagios/nsca.cfg --inetd
The following entry should be written to the inetd.conf file as a single line. We should reload inetd by running the following script:
/etc/init.d/inetd reload
This will cause it to reload the service definitions. NSCA should be run whenever a connection on port 5667 comes in. Setting up NSCA using xinetd is very similar. All that's needed is to create a /etc/xinetd.d/nsca file with the following contents:
service nsca
{
flags = REUSE
socket_type = stream
wait = no
user = nagios
group = nagioscmd
server = /opt/nagios/bin/nsca
server_args = -c /etc/nagios/nsca.cfg --inetd
log_on_failure += USERID
disable = no
}
Next, we need to reload xinetd by running the following command:
/etc/init.d/xinetd reload
And after that the NSCA should also be run when a connection on port 5667 comes in. You might add the only_from statement in the xinetd service definition to limit IP addresses from which a connection can come in. It works differently from server_address in the NSCA configuration. The only_from option specifies the addresses of the remote machines that will be allowed to connect. On the other hand, the server_address option is used to specify the IP addresses that NSCA will listen on.
When running under inetd or xinetd, the NSCA server ignores the server_address, server_port, nsca_user, and nsca_group parameters from the configuration files. These attributes are configured at the inetd/xinetd level. These attributes are only meaningful when running NSCA in standalone mode.
Sending results over NSCA
Now that our NSCA server is up and running, we can continue with actually submitting results over the network. We will need the send_nsca client binary on all of the machines that will report passive check results to Nagios.
There are various prebuilt binaries available at Nagios Exchange, including a native Win32 binary, which allows the sending of results from any check using NSCA. As it is a prebuilt version, there is no need to compile or install it. Simply copy the binary to a Windows machine, and it can be used with any valid NSCA client configuration.
As with the NSCA server, the client uses a configuration file. This requires the specification of the password and encryption_method parameters. Here is a sample configuration that can be used in conjunction with the configuration for a server created earlier:
password=ok1ij2uh3yg
encryption_method=1
The NSCA client accepts the status results that should be sent out to the server on standard input. Each line indicates a single result from a check. The syntax of the host check result that should be passed to send_nsca is as follows:
<hostname>[TAB]<return code>[TAB]<plugin output>
The return code is the same as the one for sending passive checks: 0 for UP, 1 for DOWN, and 2 for UNREACHABLE. Sending a passive service check result requires the specification of the service name as well:
<hostname>[TAB]<service name>[TAB]<return code>[TAB]<plugin output>
In this case, the return codes are the same as the exit codes for checks: 0 for OK, 1 for WARNING, 2 for CRITICAL, and 3 for UNKNOWN. Exit codes have been explained in detail in Chapter 4, Using the Nagios Plugins. The command differentiates the host and service checks by the number of fields that are passed in a line.
Note
As the tab character is the separator for the NSCA protocol, the plugin output should not contain any additional tab characters as this may cause NSCA not to work properly.
The NSCA client command has the following syntax:
send_nsca -H <host_address> [-c config_file]
[-p port] [-to to_sec] [-d delim]
The -H option specifies the name of the NSCA server to which messages should be transmitted. The -p option specifies the port to send messages on; the port defaults to 5667 if nothing is specified. The timeout in seconds is specified using the -to flag. A field delimiter can also be specified using the -d option; if this is omitted, it defaults to tab-delimited. The easiest way to test whether you can send data to NSCA correctly is to try to send a host status for a valid computer. As send_nsca accepts information on standard input, it is enough to run an echo command and send its output to the NSCA client. A sample script is provided as follows:
#!/bin/sh
HOST=localhost
NSCAHOST=127.0.0.1
echo -e "$HOST\t1\tHost temporarily down" | \
/opt/nagios/bin/send_nsca –H $NSCAHOST –c /etc/nagios/send_nsca.cfg
exit 0
The script will send a report that the host, localhost, is currently down with the status description, Host temporarily down. The NSCAHOST variable is used to specify the destination to which the NSCA server should send messages. While the preceding example is set to127.0.0.1, it should be replaced with the actual IP address of your Nagios server. A similar script can be written for sending service-related reports to Nagios. The only difference is that the return codes mean something different and that the service name is sent along with the hostname. The following is an example that sends a warning state:
#!/bin/sh
HOST=localhost
SERVICE="NSCA test"
NSCAHOST=127.0.0.1
echo -e "$HOST\t$SERVICE\t1\tService in warning state" | \
/opt/nagios/bin/send_nsca -H $NSCAHOST -c /etc/nagios/send_nsca.cfg
exit 0
This example sends out a warning status to Nagios over NSCA. The parameters are very similar, and the main difference is in the return codes. Moreover, a service description also needs to be passed; in this case, it is NSCA test. If the service has max_check_attemptsset to anything other than 1, the script needs to send out multiple status messages to Nagios. This can be done by piping multiple echo commands into a single send_nsca binary.
Applications that pass multiple results over a short period of time might pass multiple status results without having to rerun send_nsca for each result. Instead, you can simply send multiple lines to the same send_nsca process, and it will send information on all of the statuses to Nagios. This approach reduces the overhead of spawning multiple new processes.
Configuring NSCA for secure communication
Both passive checks and NSCA allow the sending of statuses for machines and applications to Nagios. This produces several types of security concerns. If a malicious user is able to send reports to Nagios, he or she can force a change to the status of one or more objects by frequently sending its status. He or she can also flood Nagios or NSCA with a large number of invalid requests that might cause performance problems. This might stop Nagios from receiving actual passive check results. For example, SNMP traps may not be passed to Nagios; if the trap is not received, it will prevent the running of an event handler that may fix the problem.
Therefore, being able to send results to Nagios should be made as secure as possible so that only authorized applications can communicate with it. Securing passive checks that are sent directly over external command pipe is relatively easy. It only requires the external command pipe to be accessible to Nagios and to the applications that are allowed to send data to it.
Securing NSCA is a more complex issue and requires ensuring that every step of the communication is secure. The first step is to make sure that the NSCA configuration files have adequate access rights. They should be set so that the NSCA daemon and clients are able to read them but other users cannot. In the client case, the issue is that all users who invoke send_nsca should be able to read its configuration file. This will ensure that your NSCA password and encryption methods cannot be read by unauthorized users.
Another thing that affects your setup security is whether the password used for communications is strong. It is recommended that you use a random password composed of lowercase and uppercase letters as well as digits. It is also recommended that you use one of the algorithms based on MCrypt, not the simple XOR algorithm. The recommended values are 16, which is RIJNDAEL-256 or 9, which is Twofish. Both are very secure encryption algorithms.
The next step is to make sure that only authorized IP addresses are allowed to send information to the NSCA server. This can be done either through xinetd configuration or by using a system firewall such as netfilter/iptables (http://www.netfilter.org/) for Linux. In both cases, it is best to define a list of allowed IPs and automatically reject connections from unknown hosts.
Summary
Nagios allows both the monitoring of services on its own and the receipt of information about computer and service statuses from other applications. Being able to send results directly to Nagios creates a lot of opportunities for extending how Nagios can be used.
In this chapter, we learned about passive checks—the difference between active and passive checks and how to enable receiving passive check results. The chapter also covered how to submit passive check results to Nagios for both hosts and services.
We also learned how to troubleshoot not being able to send passive check results to Nagios properly. We have learned about NSCA, which is a tool for sending passive check results over a network. We also talked through how to set up NSCA server and client both by using binary distributions and by compiling NSCA from sources. We also set up an NSCA server that will receive passive check results.
We learned how to send passive check results to Nagios remotely using the send_nsca binary and how to set up NSCA securely.
The next chapter will cover how to monitor remote hosts and how SSH protocol can be used to run checks remotely in a secure way. It will also cover Nagios Remote Plugin Executor (NRPE), which is a client-server protocol that allows running checks remotely.
All materials on the site are licensed Creative Commons Attribution-Sharealike 3.0 Unported CC BY-SA 3.0 & GNU Free Documentation License (GFDL)
If you are the copyright holder of any material contained on our site and intend to remove it, please contact our site administrator for approval.
© 2016-2026 All site design rights belong to S.Y.A.