Achieving Extreme Performance with Oracle Exadata (Oracle Press) (2011)
PART II
Best Practices
CHAPTER 5
Managing the Exadata Database Machine
Once the Oracle Exadata Database Machine is deployed in your data center, you are required to perform ongoing administration tasks on its software and hardware components, as you would with any other system.
The initial setup and configuration of the Database Machine is typically priced into Exadata proposals by Oracle and performed by Oracle Advanced Customer Services (ACS) upon delivery and installation of the hardware. The setup process includes the installation and configuration of the operating system and the Oracle software, and the configuration of InfiniBand and Ethernet networks. At the end of the setup process, the Database Machine is ready and configured and includes a working Oracle database. You are then able to create additional new databases and start migrating databases from non-Exadata platforms, or start deploying your brand-new database applications. Since you might want to better understand the installation process or might want to configure additional databases on the Exadata Storage Servers on your own, we cover this process in this chapter.
The Exadata Storage Server Software components, including the Exadata Storage Server Software and the Oracle Linux operating system, need to be administered on an ongoing basis. The administration tasks include patching and upgrading of the operating system and the Exadata Storage Server Software, and monitoring of the software and hardware components. Apart from the regular administration activities, you may also perform tasks related to the setup of advanced Exadata Storage Server Software features, such as I/O Resource Manager and Exadata security.
This chapter will discuss the different processes and tools available for performing administration tasks on the Exadata Storage Server components. The topics covered in the remainder of this chapter are focused on the architecture, administration, and monitoring of the Exadata Storage Servers.
NOTE
This chapter does not focus on administration of the database servers in the Exadata Database Machine. The database servers are managed, maintained, and monitored similar to a regular Oracle Database 11g Release 2 utilizing Real Application Clusters (RAC) and Automatic Storage Management (ASM). When required, you would patch the Oracle database and the grid infrastructure software, perform administration tasks, monitor and tune the databases, back up the database and operating system, and perform database upgrades, just as you would on standard Oracle systems. Moreover, you need to manage the database server nodes operating system (Oracle Linux or Solaris) and the hardware as you would normally manage any other Intel-based servers in your data center. Please also refer to Chapter 2.
Exadata Storage Server Architecture
At a high level, the Exadata Database Machine is composed of a database grid, a storage grid, and the InfiniBand network that provides the unified fabric for storage and database interinstance communication. The Oracle Sun servers that comprise the database and the storage grids are built using open standards-based hardware, and are made of components that are normally found in enterprise-class servers such as CPUs, memory, PCIe slots, hard disks, Host Channel Adapters (HCA), and Ethernet interfaces. The operating system managing the Oracle Sun servers that are the Oracle Exadata Storage Server cells in the storage grid is Oracle Linux.
In the following section, we will discuss the architecture of the software components of Exadata Database Machine in detail.
Database Server Software Components
The database grid of the Database Machine utilizes Oracle ASM as the storage management layer. Oracle ASM acts as the cluster volume manager for the storage served by the Exadata Storage Servers, and is the only software that can be used to manage the storage grid of the Database Machine. Moreover, you are not allowed to directly attach or mount the storage served by the Exadata Storage Servers to any other server or storage volume manager.
Oracle ASM provides data placement and management services on the Exadata Storage Servers, stripes and mirrors the database extents into chunks called ASM allocation units (ASM AU, also called ASM extents), and spreads them across the disks served by the Exadata Storage Servers. Oracle ASM provides high availability of the extents and eliminates single points of failure by keeping a mirrored copy of the extent available at all times. The striping of data by ASM provides optimal I/O performance, as the I/O requests will be parallelized across all the available Exadata Storage Servers in the grid that houses the striped data.
Oracle ASM will be active during the initial placement of data, and also when performing ongoing management operations, such as rebalancing of data across the Exadata Storage Servers. The database server processes initiate I/O requests directly with the Exadata Storage Servers and bypass the Oracle ASM instance, thus reducing the unnecessary overhead of involving ASM for each database I/O operation. The direct communication of the database with the storage is possible because the database server stores the extent maps of ASM files in the SGA, which enables read/write I/O requests directly with the Exadata Storage Servers without requiring the Oracle ASM instance. This method of initiating I/O requests is the same when the ASM files reside on non-Exadata-based storage.
The database server process and the Oracle ASM instance communicate with Exadata Storage Servers using the iDB protocol. iDB is a data transfer protocol implemented in the Oracle kernel and provides intelligence that enables the database and ASM instances to utilize Exadata-specific features such as offload processing and I/O Resource Manager (IORM). iDB is built upon Reliable Datagram Sockets (RDS), which is the same protocol used by database RAC interinstance communication over the InfiniBand network. RDS incorporates optimizations such as Remote Direct Memory Access (RDMA) to minimize the network protocol overhead by allowing distributed applications to transfer data directly between their memory structures without involving the operating system memory, a feature that is more commonly referred to as Zero-copy Datagram Protocol (ZDP).
The RDS protocol also enables iDB to facilitate I/O bandwidth allocations for Exadata IORM, and provides bandwidth aggregation and failover of the InfiniBand network. The iDB communication is facilitated by software processes that reside on the database nodes and the Exadata Storage Servers, as shown in Figure 5-1.
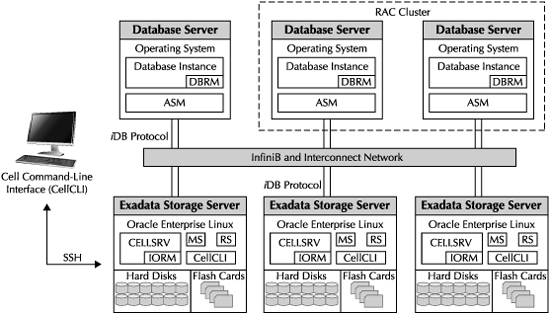
FIGURE 5-1. Software components of the Oracle Exadata Database Machine
The Database Resource Manager (DBRM) component of the Oracle database performs management of CPU and I/O resources. DBRM communicates with Exadata Storage Server processes for performing I/O Resource Management for intradatabase resource manager plans. IORM utilizes the DBRM intradatabase plans generated by administrators, and regulates the I/O utilization among different consumer groups within the database.
Exadata Storage Server Software Components
The storage grid in the Exadata Database Machine is composed of multiple Exadata Storage Servers, with each server providing a network-accessible storage device to be utilized by Oracle ASM. The operating system managing the Exadata Storage Servers is Oracle Linux, and the Oracle software providing the core features of the Exadata Storage Server is Oracle Exadata Storage Server Software.
The Exadata Storage Server Software consists of the following components:
![]() Cell Server (CELLSRV) The CELLSRV process is the main kernel of Exadata Storage Server Software and is responsible for serving iDB requests initiated by the database and ASM instances. The CELLSRV process handles simple block I/O requests along with offload processing requests. The CELLSRV process implements IORM plans and performs throttling of I/O bandwidth based on I/O priorities as defined by the plan. CELLSRV also interacts with DBRM for implementing intradatabase resource manager plans.
Cell Server (CELLSRV) The CELLSRV process is the main kernel of Exadata Storage Server Software and is responsible for serving iDB requests initiated by the database and ASM instances. The CELLSRV process handles simple block I/O requests along with offload processing requests. The CELLSRV process implements IORM plans and performs throttling of I/O bandwidth based on I/O priorities as defined by the plan. CELLSRV also interacts with DBRM for implementing intradatabase resource manager plans.
![]() Management Server (MS) The MS process provides management and monitoring functions for the Exadata Storage Server Software. The MS process is responsible for triggering alerts when exceptions are encountered by the Exadata Storage Server components. The MS process communicates with CELLSRV and the operating system utilities in order to check the health of the software and hardware components.
Management Server (MS) The MS process provides management and monitoring functions for the Exadata Storage Server Software. The MS process is responsible for triggering alerts when exceptions are encountered by the Exadata Storage Server components. The MS process communicates with CELLSRV and the operating system utilities in order to check the health of the software and hardware components.
![]() Restart Server (RS) The RS process handles startup and shutdown requests of the Exadata Storage Server Software. The RS process monitors the CELLSRV and MS process, and restarts them when they die abruptly. There is also a backup RS process that takes care of restarting the primary RS process if the primary itself is not running.
Restart Server (RS) The RS process handles startup and shutdown requests of the Exadata Storage Server Software. The RS process monitors the CELLSRV and MS process, and restarts them when they die abruptly. There is also a backup RS process that takes care of restarting the primary RS process if the primary itself is not running.
![]() CellCLI The Cell Command Line Interface (CellCLI) is the utility that you use to perform management and administration functions on the Exadata Storage Server Software. More details on CellCLI are covered later in this chapter.
CellCLI The Cell Command Line Interface (CellCLI) is the utility that you use to perform management and administration functions on the Exadata Storage Server Software. More details on CellCLI are covered later in this chapter.
Exadata Storage Layout
The components of the Exadata Storage Servers that provide persistent storage services are the High Performance or High Capacity hard disks and the flash disks that are created on Sun Flash Accelerator F20 PCIe cards. In this section, we will discuss the best practices for provisioning these storage devices and presenting them to Oracle ASM. Once the storage is presented to Oracle ASM, you can create ASM diskgroups, and eventually create tablespaces in the Oracle database that utilizes the diskgroups to store database objects.
LUNs, Cell Disks, and Grid Disks
As shown in Figure 5-2, each hard disk gets presented to the Exadata Storage Server Software and the OS as a logical unit (LUN). A LUN is the representation of the hard disk to the OS. The Exadata Storage Server Software will take the LUN and format it to create a cell disk. There is a one-to-one relationship between a LUN and a cell disk.
When the cell disk is created, it reserves a small portion of the available storage on the LUN for a system area. The system area is used to store information about the LUNs, cell disks, and grid disks (discussed next) created on top of the cell disks. The system area on the first two drives is special since it stores the Oracle Linux operating system and the Linux file systems of the Exadata Storage Server.
Grid disks add another layer of logical abstraction on the physical storage and are created on top of cell disks. Grid disks are the entities that get presented to Oracle ASM as ASM disks, and ASM diskgroups get created across the available ASM disks (i.e., grid disks). You can create multiple grid disks per cell disk, and when a grid disk is created, it will carve out a chunk of space from the unused outer tracks of the physical disk. The first grid disk created on the cell disk will allocate space from the outer tracks and move towards the inner tracks, reserving the number of tracks that correspond to the size of the grid disk. This grid disk provides the fastest performance since the outer tracks of a hard disk provide the best read/write performance. The next grid disk you will create starts from the tracks where the first grid disk ends, and this process repeats until you exhaust all the space on the cell disk or you are done creating the grid disks.
Creating multiple grid disks per cell disk allows you to create multiple pools of storage on the same Exadata Storage Server. The multiple grid disks can be assigned to separate ASM diskgroups, which can be provisioned to different databases. Even within the same database, you can store your active data on the grid disks created on the outer tracks and the less active data on the grid disks created on the inner tracks. The best practice for creating grid disks is to create a minimum of two grid disks per cell disk. The first grid disk will be used to store user data since it provides the best performance. The second grid disk can be used to store the database Fast Recovery Area (FRA) for storing the database flashback logs, archive logs, and backups.
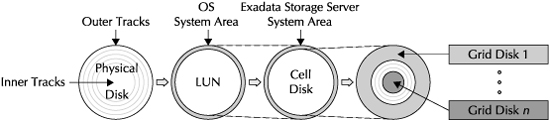
FIGURE 5-2. Relationship between LUNS, cell disks, and grid disks
Interleaved Grid Disks
One drawback of creating multiple grid disks per cell disk as just described is that it does not provide the second grid disk the opportunity to be placed on the faster outer tracks. Moreover, the space utilization within a grid disk is such that only half of the space tends to be used for hot data, and the remaining half is used for mirrored blocks or colder data, which does not need the higher performance of the outer tracks. This situation can be mitigated by creating interleaved grid disks instead of regular grid disks, as shown in Figure 5-3.
With interleaved grid disks, you would provide the second grid disk the opportunity to be placed towards the faster-performing outer tracks. This mechanism is useful when you set up the Exadata Storage Server for multiple storage pools by creating multiple ASM diskgroups. All the ASM diskgroups will have the opportunity to utilize the faster-performing areas of the cell disk, and thus attempt to equalize the performance.
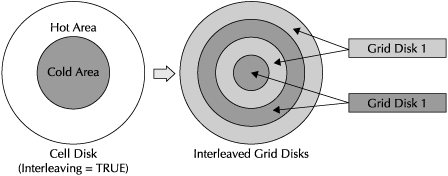
FIGURE 5-3. Interleaved grid disks
Interleaving is enabled at the cell disk level by setting the INTERLEAVING attribute at the cell disk creation time. When you enable interleaving, it divides the cell disk into two equal parts; the first part is the faster-performing or the hot part, and is allocated towards the outer tracks; the second part is slower-performing or the cold part, and is allocated towards the inner tracks. When you create the interleaved grid disk on the cell disk, half of the interleaved grid disk is placed in the hot area and the remaining half is placed in the cold area. The process will be repeated when you create multiple interleaved grid disks until you exhaust the space on the cell disk or you no longer wish to create additional grid disks.
Flash Disks and Exadata Smart Flash Cache
Each Exadata Storage Server in the Exadata Database Machine comes preinstalled with Sun Flash Accelerator F20 PCIe cards. The PCIe-based flash storage technology is primarily used to speed up access to data, since I/Os against flash are much faster than I/Os against the hard disks. Each flash card is divided into multiple modules, and each module is exposed to the operating system as one LUN, and this LUN is categorized as a flash disk LUN, as shown in Figure 5-4.
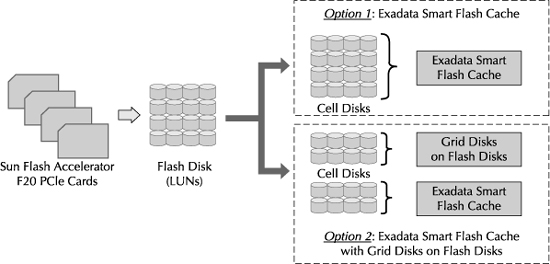
FIGURE 5-4. Relationship between flash disk, Exadata Smart Flash Cache, and flash-based grid disks
The three main options for managing and utilizing the flash disks in the Exadata Storage Server are highlighted here:
![]() Exadata Smart Flash Cache The first option is to let the Exadata Storage Server Software, described in detail in Chapter 3, manage the flash disks and configure them to be used by the Exadata Smart Flash Cache feature. The Exadata Smart Flash Cache will store the frequently accessed data (hot data) into the flash cards, leading to a substantial improvement in disk read performance on hot data, whereas the infrequently accessed data (cold data) resides on the cost-effective, hard disk-based storage. When the database server requests read or write operations from the Exadata Storage Server Software, it sends additional information about the request that indicates whether the blocks are candidates to be read again. Based upon this additional information, the Exadata Storage Server decides on caching the blocks in the Exadata Smart Flash Cache.
Exadata Smart Flash Cache The first option is to let the Exadata Storage Server Software, described in detail in Chapter 3, manage the flash disks and configure them to be used by the Exadata Smart Flash Cache feature. The Exadata Smart Flash Cache will store the frequently accessed data (hot data) into the flash cards, leading to a substantial improvement in disk read performance on hot data, whereas the infrequently accessed data (cold data) resides on the cost-effective, hard disk-based storage. When the database server requests read or write operations from the Exadata Storage Server Software, it sends additional information about the request that indicates whether the blocks are candidates to be read again. Based upon this additional information, the Exadata Storage Server decides on caching the blocks in the Exadata Smart Flash Cache.
When the I/O requests sent to Exadata Storage Server are for random reads and index reads (db file sequential reads), the blocks are likely to be read again and hence will be cached by the Exadata Smart Flash Cache algorithm. In case of I/Os involving table scans, backups, redo log writes, and ASM mirrored writes, the blocks are most likely not read again and will bypass the Exadata Smart Flash Cache. However, there is an exception to this rule, and it applies to tables and partitions that are defined using the KEEP qualifier, as described in Chapter 3 and also next.
Exadata Smart Flash Cache is configured by default and is also the best practice for managing the flash disks, since the Exadata Storage Server Software will be responsible for managing the flash without requiring any user intervention or tuning.
![]() Pinning Objects in Exadata Smart Flash Cache This option is an extension to the first one, and it allows the user to enable the database objects such as tables, indexes, partitions, and LOB columns, to be pinned in the Exadata Smart Flash Cache. The objects that are specified to be pinned are not exactly pinned in the cache 100 percent of the time, but rather given special treatment by the Exadata Smart Flash Cache algorithm, and the treatment is to keep the object in cache more aggressively and longer than the other objects. It is important to point out that the Flash Cache does not get preloaded with the pinned objects, but rather, the individual blocks of the object get loaded in an incremental manner upon being accessed by the users.
Pinning Objects in Exadata Smart Flash Cache This option is an extension to the first one, and it allows the user to enable the database objects such as tables, indexes, partitions, and LOB columns, to be pinned in the Exadata Smart Flash Cache. The objects that are specified to be pinned are not exactly pinned in the cache 100 percent of the time, but rather given special treatment by the Exadata Smart Flash Cache algorithm, and the treatment is to keep the object in cache more aggressively and longer than the other objects. It is important to point out that the Flash Cache does not get preloaded with the pinned objects, but rather, the individual blocks of the object get loaded in an incremental manner upon being accessed by the users.
The database object-level setting of the CELL_FLASH_CACHE attribute determines whether the object is enabled to be pinned in the Flash Cache. The CELL_FLASH_CACHE storage attribute can be set to KEEP, DEFAULT, or NONE. When set to KEEP, the object will be enabled for pinning, and when set to NONE it will never be cached. The DEFAULT attribute invokes the default caching algorithm, which is what was discussed in the first option.
The default behavior of the caching algorithm when it encounters Exadata Smart Scans is to skip the Smart Scan blocks from being cached altogether. However, if you have the CELL_FLASH_CACHE set to KEEP on the table undergoing a Smart Scan operation, the table will be cached in the Flash Cache.
You can modify the caching behavior on the object with a simple ALTER statement. In this example, the stocks table is enabled to be pinned in the Flash Cache.
SQL> ALTER TABLE stocks STORAGE (CELL_FLASH_CACHE KEEP);
NOTE
Be aware that changing the CELL_FLASH_CACHE from KEEP to NONE or DEFAULT will not remove the kept blocks from the Flash Cache—this change will simply subject the pinned blocks to the more aggressive aging algorithm used for the NONE or DEFAULT settings.
![]() User Managed Flash Disks The third option of managing the flash disks is to have them partially managed as Exadata Smart Flash Cache and partially managed by the user for manually placing database objects. When the user manages the flash disk, the grid disks are created on a portion of the flash-based cell disks and exposed to Oracle ASM. Oracle ASM creates ASM diskgroups that reside on the flash disks, and thus provide the extreme I/O performance of flash storage. This option allows you to place the hot or frequently accessed tables directly on a tablespace that is created on the flash-based ASM diskgroup.
User Managed Flash Disks The third option of managing the flash disks is to have them partially managed as Exadata Smart Flash Cache and partially managed by the user for manually placing database objects. When the user manages the flash disk, the grid disks are created on a portion of the flash-based cell disks and exposed to Oracle ASM. Oracle ASM creates ASM diskgroups that reside on the flash disks, and thus provide the extreme I/O performance of flash storage. This option allows you to place the hot or frequently accessed tables directly on a tablespace that is created on the flash-based ASM diskgroup.
One of the drawbacks of this method is that it requires the user to analyze and identify the tables that qualify as “frequently accessed”, and also when the access pattern of the data changes, the user needs to perform ongoing management of the flash disk space by moving objects in and out of the flash-based ASM diskgroup.
Another drawback of this method is that you will be wasting at least half of the flash disk space by mirroring the data using NORMAL or HIGH redundancy settings on the ASM diskgroup. You cannot do away with mirroring since flash-based storage has higher failure rates when compared with the hard disks and mirroring will provide you a better level of protection.
ASM Disks and ASM Diskgroup
An ASM diskgroup is the primary storage entity of ASM that is exposed to the Oracle Database for storing database files. The ASM diskgroup is composed of one or more ASM disks, which are nothing but the grid disks exposed from each Exadata Storage Server to Oracle ASM. It is important to know that all ASM disks within an ASM diskgroup should reside in the Exadata Storage Servers in order for the database to utilize the Exadata-related features such as Exadata SQL offload processing.
With Oracle ASM, you can define failure groups in an ASM diskgroup. An ASM failure group is composed of ASM disks within the ASM diskgroup that have the tendency to fail together because they share the same hardware. The reason for creating failure groups is to identify the ASM disks that are candidates for storing mirrored copies of data. You do not want to store the mirror copy of an ASM extent in an ASM disk that belongs to the same failure group, because they both can fail together and you can end up losing your data. When you are creating ASM diskgroups in an Exadata environment, the failure groups are created automatically by the ASM instance since ASM knows to group the disks belonging to the same Exadata Storage Server in the same failure group.
An Exadata Grid redundant array of inexpensive disks (Grid RAID) uses ASM mirroring capabilities by specifying a redundancy level when creating the ASM diskgroup. In order for the ASM extents to be available during Exadata Storage Server failures, it is a requirement to use ASM mirroring by using NORMAL or HIGH redundancy diskgroups. The NORMAL redundancy option will allocate one mirror copy of the ASM extent in a different failure group as the one allocated to the primary copy, whereas the HIGH redundancy option will allocate two mirrored copies of the extent in two separate failure groups.
The NORMAL redundancy tolerates a single Exadata Storage Server failure or multiple failures within the same Storage Server at a time, and the HIGH redundancy tolerates two Exadata Storage Server failures or multiple failures confined to two Storage Servers at a time in the storage grid. When you choose the redundancy level, ensure that the post-failure capacity and performance due to reduced number of Exadata Storage Servers in the Database Machine provide an acceptable level of service to the applications.
In the example shown in Figure 5-5, there are two Exadata Storage Servers—Server A and Server B. Two ASM diskgroups are created across Server A and Server B in the grid. The DATA diskgroup is defined on the faster-performing (or hot) grid disks, and the RECOV diskgroup is defined on the slower-performing (or cold) grid disks. The diskgroups are created with NORMAL redundancy, which implicitly creates two failure groups per each diskgroup, and the extents from Server A’s failure group will be mirrored to Server B’s failure group. If Server A fails, then Oracle ASM transparently fetches the mirrored extent from Server B and satisfies the I/O request without incurring any downtime.
The names of the ASM disks are the same as the Exadata Storage Server grid disks, and can be retrieved from the ASM instance by querying the name attribute of v$asm_disk. By looking at the ASM disk name, you can pinpoint the Exadata Storage Server and the cell disk to which the ASM disk belongs. This is possible because the ASM disk name contains the Exadata Storage Server name and the cell disk name as a prefix. The prefix is added by the system and works well to locate the cell disk to which the grid disk belongs. However, when you have multiple grid disks created per cell disk, in order to identify whether the grid disk was created on the hot or the cold areas of the hard disk, you need to add a user-defined prefix to the system-defined name. This is accomplished by using the PREFIX attribute of the CREATE GRIDDISK command. The PREFIX needs to be meaningful to the user and should be defined such that it will help you identify the location of the grid disk within the cell disk.
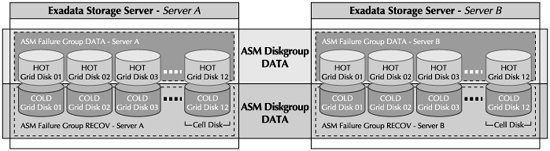
FIGURE 5-5. ASM diskgroup architecture
Exadata Storage Server Administration
To perform administration tasks on the Exadata Storage Servers, you first need to establish a communication path to the server’s terminal console. One of the options for accessing the console is through KVM (keyboard, video and mouse) hardware that comes with X2-2 configurations of the Oracle Exadata Database Machine and its predecessors. But to access the KVM hardware, you need to be physically present alongside the Database Machine, and you have no choice but to use KVM when configuring the Database Machine for the first time. Once you perform the initial configuration steps that are outlined in the Exadata Storage Server first boot sequence section later in the chapter, the Exadata Storage Servers are made accessible over the Ethernet network and you can then use alternative methods that allow you to log in remotely.
Once the server is accessible over the network, you can use the Secure Shell (SSH) protocol to login remotely using an SSH-enabled client. The KVM console can also be redirected over the network to your desktop using the Sun Integrated Lights Out Management (ILOM) remote client. Another method to access the server console without the graphics is to redirect the console to a serial port and use ILOM to access the serial port through its web-based interface. No matter what remote method you use, the host you log in from should be able to access the Ethernet management network of the Exadata Database Machine.
Once you are at the OS login prompt, you need an OS user with privileges that are appropriate for performing administration tasks. The OS users and groups that exist on the Exadata Storage Servers are configured during the factory install process, and you will use only these preconfigured users to log in.
After logging in with the appropriate user, you have access to a variety of OS tools and the Cell Command-Line Interface (CellCLI). The CellCLI utility is available only on the Exadata Storage Servers, and if you need to access this utility from a remote host, you can use the Distributed Command Line Interface (dcli). The dcli utility has the ability to execute CellCLI commands, simultaneously and in parallel, against a set of Exadata Storage Servers, thereby eliminating the need to run the same command multiple times on each Exadata Storage Server. Dcli comes in quite handy when performing certain configuration and monitoring steps. The CellCLI and dcli utilities are discussed next.
Using CellCLI
Using CellCLI, you can configure the Exadata Storage Server Software components, perform administration tasks such as startup and shutdown of the Exadata Storage Server Software, and perform monitoring and maintenance activities. CellCLI is a command-line executable that comes preinstalled on the Exadata Storage Servers and allows you to administer only the Storage Server on which the utility resides. You can execute CellCLI either by directly logging on to the Storage Server or through a networked server that can access the Storage Server using SSH.
NOTE
The term “Cell” is sometimes used to reference the Exadata Storage Server. The Cell is also an object within the Exadata Storage Server that can be queried through CellCLI. The Cell object refers to the Exadata Storage Server itself and stores its attributes such as the name, status, and network settings.
The commands that can be executed at the CellCLI prompt follow syntactical rules as with any other command-line interface. The lexical syntax of CellCLI commands is
{admin-command | object-command object} [options];
The first part of the command indicates the type of the command, and this can be of type admin-command or the object-command. The detailed description on the lexical syntax is given here:
![]() admin-command dictates an administration action to CellCLI. These commands will perform operations that are directed to the CellCLI utility. Common admin commands are START, SPOOL, HELP, and QUIT.
admin-command dictates an administration action to CellCLI. These commands will perform operations that are directed to the CellCLI utility. Common admin commands are START, SPOOL, HELP, and QUIT.
![]() object-command will direct administrative actions to be performed on the cell objects. The object command is qualified by an object clause, which is the cell object upon which the command will be applied. Examples of cell objects are the cell disks, grid disks, flash cache, and the cell. Common object commands are CREATE, ALTER, and LIST.
object-command will direct administrative actions to be performed on the cell objects. The object command is qualified by an object clause, which is the cell object upon which the command will be applied. Examples of cell objects are the cell disks, grid disks, flash cache, and the cell. Common object commands are CREATE, ALTER, and LIST.
![]() options provides the ability to specify additional parameters or options to the command.
options provides the ability to specify additional parameters or options to the command.
CellCLI can be invoked in an interactive mode, which is the default mode and does not require any options to be specified at the command line. The interactive mode allows users to execute multiple commands in a single session until the user executes the QUIT or EXIT command.
The following example invokes the CellCLI utility and runs the LIST command to list the attributes of the Cell object. The Cell object is associated with the Exadata Storage Server and will store its attributes such as the cell name, online/offline status, and the IP addresses configured for the server. The LIST command is explained in detail in the monitoring section of this chapter.
$> CellCLI
CellCLI> LIST CELL DETAIL
CellCLI> QUIT
You can also invoke CellCLI with the -e option and supply the CellCLI command directly at the OS command line as shown next. This command will display the same result as the previous example.
$> CellCLI -e LIST CELL DETAIL
Exadata Storage Server OS Users and Privileges
The CellCLI utility does not have its own authentication mechanism and will rely on the operating system authentication of the Linux user. Based upon the user that invokes CellCLI, the users will be assigned appropriate privileges within the CellCLI domain. The pre-created OS users that you will use to log in to the Exadata Storage Server are root, celladmin, and cellmonitor, and these are the only users allowed on the Storage Servers. These users are authorized to perform tasks related to administration, monitoring, and maintenance of the Exadata Storage Server and the Exadata Storage Server Software. Since you will have super-user privileges on the server with the root user, remember that performing any modifications to the Exadata Storage Server or its components is prohibited by Oracle, and this includes installation and modification of both existing and new software and hardware components, except for the modifications done by applying ongoing Exadata Storage Server patches and upgrades.
The Exadata Storage Server OS users have the following characteristics and privileges associated with them:
![]() cellmonitor The cellmonitor user can perform monitoring functions on the Exadata Storage Server using the CellCLI interface. The user is authorized only to execute the CellCLI LIST command, and all other commands that modify the configuration of the Exadata Storage Server, such as CREATE and ALTER commands, are blocked for cellmonitor.
cellmonitor The cellmonitor user can perform monitoring functions on the Exadata Storage Server using the CellCLI interface. The user is authorized only to execute the CellCLI LIST command, and all other commands that modify the configuration of the Exadata Storage Server, such as CREATE and ALTER commands, are blocked for cellmonitor.
![]() celladmin The celladmin user has the authority to perform administration tasks from the CellCLI interface. The administration tasks include creating, altering, and deleting of cell objects, such as grid disks and cell disks. The only CellCLI command that the celladmin user is not authorized to run is the CALIBRATE command, which is the command to capture I/O performance metrics of hard disks and Exadata Smart Flash Cache by exercising an I/O load against these devices.
celladmin The celladmin user has the authority to perform administration tasks from the CellCLI interface. The administration tasks include creating, altering, and deleting of cell objects, such as grid disks and cell disks. The only CellCLI command that the celladmin user is not authorized to run is the CALIBRATE command, which is the command to capture I/O performance metrics of hard disks and Exadata Smart Flash Cache by exercising an I/O load against these devices.
At the OS level, the celladmin user can access the Automatic Diagnostics Repository Command Interface (adrci) utility to package incidents for sending to Oracle support.
![]() root The root user has super-user privileges at the OS and the CellCLI levels. The root user can execute OS utilities for performing maintenance and setup of Exadata Storage Server hardware and software components. Root can modify the OS parameter files, which is required for certain configuration steps, such as modifying the Exadata Storage Server IP addresses and setting up Exadata security.
root The root user has super-user privileges at the OS and the CellCLI levels. The root user can execute OS utilities for performing maintenance and setup of Exadata Storage Server hardware and software components. Root can modify the OS parameter files, which is required for certain configuration steps, such as modifying the Exadata Storage Server IP addresses and setting up Exadata security.
Root is also a super-user on the CellCLI interface and has the authority to run all CellCLI commands, including CALIBRATE.
Using dcli
The dcli utility provides a centralized command-line interface for managing multiple Exadata Storage Servers from a single location. The dcli utility allows you to execute an OS command, in parallel, against a set of Exadata Storage Servers. When the command completes, the output of the command from each of the Exadata Storage Servers is combined into one and displayed as a unified result.
By using dcli, you can execute a CellCLI command against a set of Exadata Storage Servers in parallel, and you can observe the output returned by the command from all the Storage Servers from one central location. The dcli utility comes in extremely handy when you want to execute the same command against multiple servers without having to type them individually, in contrast to the CellCLI utility that will only allow you to run commands on a single Storage Server at a time.
The dcli utility can be set up on any host, provided the following requirements are met:
![]() The dcli executable residing on the Exadata Storage Server needs to be copied to the host that will execute dcli commands. The Exadata Storage Servers have dcli preinstalled with the factory image.
The dcli executable residing on the Exadata Storage Server needs to be copied to the host that will execute dcli commands. The Exadata Storage Servers have dcli preinstalled with the factory image.
![]() dcli is a Python script and requires Python to be installed and accessible by the user invoking dcli. Python is preinstalled and configured on the database servers and the Exadata Storage Servers, and if you plan on using a server residing outside of the Database Machine, ensure that it can support Python 2.3 or later.
dcli is a Python script and requires Python to be installed and accessible by the user invoking dcli. Python is preinstalled and configured on the database servers and the Exadata Storage Servers, and if you plan on using a server residing outside of the Database Machine, ensure that it can support Python 2.3 or later.
![]() SSH equivalence of the user executing the dcli commands on the remote host needs to be set with the Exadata Storage Server user that will be used to execute the commands. This configuration needs to be done on all Exadata Storage Servers that you will be managing from dcli. You can use the dcli utility itself to set up SSH equivalence. Refer to the Exadata Storage Server Software Users Guide—Using the dcli for more details.
SSH equivalence of the user executing the dcli commands on the remote host needs to be set with the Exadata Storage Server user that will be used to execute the commands. This configuration needs to be done on all Exadata Storage Servers that you will be managing from dcli. You can use the dcli utility itself to set up SSH equivalence. Refer to the Exadata Storage Server Software Users Guide—Using the dcli for more details.
The dcli utility is invoked from the OS command line and has the usage syntax specified here:
$> dcli [options] [command]
The two parameters that the dcli takes as input are options and command. The command is the OS command that you will execute on the Exadata Storage Server. The CellCLI command is our focus for this chapter, but essentially, you can execute any OS commands (for example, OS-level monitoring commands such as vmstat) from dcli as long as the user that was used for the SSH equivalence has the authority to run the command on the Exadata Storage Server. A point to be noted is that dcli executes one command at a time and does not allow executing multiple commands in a single invocation.
Some frequently used options of dcli are listed here:
![]() -c cells Allows you to specify the Exadata Storage Server(s) that you want to execute the command on. Multiple servers are separated by a comma.
-c cells Allows you to specify the Exadata Storage Server(s) that you want to execute the command on. Multiple servers are separated by a comma.
![]() -g group_file You can add the list of Exadata Storage Servers to group_file and use the file instead of a long, comma-separated list.
-g group_file You can add the list of Exadata Storage Servers to group_file and use the file instead of a long, comma-separated list.
![]() -l user This option will log in to the Exadata Storage Server using the user specified. The user needs to be set up for SSH equivalence, with the remote OS user invoking dcli.
-l user This option will log in to the Exadata Storage Server using the user specified. The user needs to be set up for SSH equivalence, with the remote OS user invoking dcli.
![]() -k This option is used to set up SSH equivalence. It will also need the -c or the -g option to specify the Exadata Storage Servers to set up SSH equivalence.
-k This option is used to set up SSH equivalence. It will also need the -c or the -g option to specify the Exadata Storage Servers to set up SSH equivalence.
![]() -x script If the command is too long to be specified on the command line, you can save the command in a script file and use the -x option to execute the script file.
-x script If the command is too long to be specified on the command line, you can save the command in a script file and use the -x option to execute the script file.
![]() -h This will display the help on dcli.
-h This will display the help on dcli.
When executing CellCLI through dcli, you should use the -e option of CellCLI at the dcli command line.
dcli Examples
To set up SSH user equivalence using dcli, create a text file (named group_file for this example) that contains all Exadata Storage Server hostnames or IP addresses, and execute the dcli command with the -k option, as shown next. The command prompts you to enter the password for the user that will have the SSH equivalence set. The password is required to set up the SSH equivalence key files.
$> dcli -k -g group_file
If you want to display the name and status of the grid disks on each Exadata Storage Server, execute the following dcli command. The command will execute the LIST GRIDDISK command on all the Exadata Storage Servers that are specified in the group_file.
$> dcli -g group_file "CellCLI -e LIST GRIDDISK ATTRIBUTES name, status"
Exadata Storage Server Setup
The initial setup and configuration of the Exadata Storage Servers will be performed when the Exadata Database Machine gets installed at the customer site. We will touch upon the initial configuration setup steps briefly in this section.
At a high level, the setup process of the Exadata Storage Servers can be divided into two phases. The first phase deals with configuring the Exadata Storage Server and the operating system to make them accessible via the management network by listening on the appropriate Ethernet IP addresses. This phase will also configure the Fully Qualified Domain Name (FQDN), Domain Name Server (DNS), and a few other steps that we will discuss in the next section.
The steps involved in the second phase configure the Exadata Storage Server Software and carve out storage devices to make the Exadata Storage Server presentable to Oracle ASM as ASM disks. The ASM disks will be used to configure ASM diskgroups, and eventually used to create tablespaces in the Oracle Database.
The next section will first discuss the steps required for configuring the Exadata Storage Server and the OS.
Phase 1: Exadata Storage Server and OS Configuration
The Database Machine gets delivered to the customer site with a preinstalled factory image of the OS and the Exadata Storage Server Software. The OS and the software are not fully configured upon delivery, since the configuration steps require IP addresses of InfiniBand and Ethernet networks to be set up and routable (among other requirements, which we will see later), and this is only possible when the machine is at the customer site and not at the factory.
Exadata Storage Server First Boot Sequence
When the server is booted for the first time using the factory image, it will undergo a first boot sequence. The sequence is a series of prompts requesting your input, and, based on the information you provide, the Exadata Storage Server will be configured to listen on the network using the IP addresses provided at the prompt.
It will be necessary to have the following information ready prior to going through the first boot sequence:
![]() DNS Servers: It is not a requirement to register the Ethernet IP addresses of the Exadata Storage Server in the DNS, but if you are doing so, the Primary and Secondary DNS Server information needs to be provided.
DNS Servers: It is not a requirement to register the Ethernet IP addresses of the Exadata Storage Server in the DNS, but if you are doing so, the Primary and Secondary DNS Server information needs to be provided.
![]() Time zone and location of the Exadata Storage Servers.
Time zone and location of the Exadata Storage Servers.
![]() Network Time Protocol (NTP) Servers are needed for network time synchronization.
Network Time Protocol (NTP) Servers are needed for network time synchronization.
![]() Ethernet and InfiniBand IP addresses: You will require one InfiniBand IP address during the first boot sequence. Even though you have two InfiniBand ports in each Exadata Storage Server, the ports are bonded for high availability on each server and will be presented to the OS as one port requiring one IP address. You also need one Ethernet IP address for the management network that connects the Ethernet ports of the Exadata Storage Server to the Exadata Database Machine’s Ethernet admin switch.
Ethernet and InfiniBand IP addresses: You will require one InfiniBand IP address during the first boot sequence. Even though you have two InfiniBand ports in each Exadata Storage Server, the ports are bonded for high availability on each server and will be presented to the OS as one port requiring one IP address. You also need one Ethernet IP address for the management network that connects the Ethernet ports of the Exadata Storage Server to the Exadata Database Machine’s Ethernet admin switch.
![]() Fully qualified domain name (FQDN) for the server.
Fully qualified domain name (FQDN) for the server.
![]() Oracle ILOM setup: The Oracle ILOM interface will be set up during the first boot sequence, and its configuration requires one IP address upon which its built-in web server will listen upon. Once ILOM is configured, you will be able to use a web browser to connect to ILOM and perform server-level management functions, such as startup and shutdown of the server, monitor the hardware, and many more tasks. More details on ILOM are discussed later in this chapter.
Oracle ILOM setup: The Oracle ILOM interface will be set up during the first boot sequence, and its configuration requires one IP address upon which its built-in web server will listen upon. Once ILOM is configured, you will be able to use a web browser to connect to ILOM and perform server-level management functions, such as startup and shutdown of the server, monitor the hardware, and many more tasks. More details on ILOM are discussed later in this chapter.
After the first boot configuration is complete, the Exadata Storage Server will be booted to the Linux prompt and you are ready to log in with the built-in users. Once you log in, the Exadata Storage Server Software processes are started, but still will not be fully functional and require additional configuration, which will be discussed in the next phase.
Perform Sanity Checks on the Exadata Storage Server Using CALIBRATE
In order to make sure that the Exadata Storage Server hardware is performing as advertised, you should execute the CellCLI CALIBRATE command. The CALIBRATE command will exercise the storage devices of the server with a prebuilt I/O load profile, and will monitor the raw I/O performance at the block level. You should compare the metrics you get from the result of CALIBRATE and compare it with the advertised values. An example of running the CALIBRATE command is shown next. The use of the FORCE parameter will be mandatory if you have already created the Exadata Cell object (the Exadata Cell object is discussed in the next section).
[root@cell01 ~]# CellCLI
CellCLI: Release 11.2.1.2.0 - Production on Mon Nov 02 16:42:06 PST 2009
Copyright (c) 2007, 2009, Oracle. All rights reserved.
Cell Efficiency ratio: 1.0
CellCLI> CALIBRATE FORCE
Calibration will take a few minutes…
Aggregate random read throughput across all hard disk luns: 1601 MBPS
Aggregate random read throughput across all flash disk luns: 4194.49 MBPS
Aggregate random read IOs per second (IOPS) across all hard disk luns: 4838
Aggregate random read IOs per second (IOPS) across all flash disk luns: 137588
Controller read throughput: 1615.85 MBPS
Calibrating hard disks (read only) …
Lun 0_0 on drive [20:0] random read throughput: 152.81 MBPS, and 417 IOPS
Lun 0_1 on drive [20:1] random read throughput: 154.72 MBPS, and 406 IOPS
. . .
Lun 0_10 on drive [20:10] random read throughput: 156.84 MBPS, and 421 IOPS
Lun 0_11 on drive [20:11] random read throughput: 151.58 MBPS, and 424 IOPS
Calibrating flash disks (read only, note that writes will be significantly
slower).
Lun 1_0 on drive [[10:0:0:0]] random read throughput: 269.06 MBPS, and 19680
IOPS
Lun 1_1 on drive [[10:0:1:0]] random read throughput: 269.18 MBPS, and 19667
IOPS
…
Lun 5_2 on drive [[11:0:2:0]] random read throughput: 269.15 MBPS, and 19603
IOPS
Lun 5_3 on drive [[11:0:3:0]] random read throughput: 268.91 MBPS, and 19637
IOPS
CALIBRATE results are within an acceptable range.
NOTE
The CALIBRATE command will exhaust all the available I/O resources on the Exadata Storage Server. Take caution when running this command, especially if you have databases that are actively utilizing the storage.
Phase 2: Exadata Storage Server Software Configuration
Before you start configuring the Exadata Storage Server Software, you need to decide on the provisioning model of the grid disks and the flash disks. The points to be considered are the number of grid disks to be created per cell disk, use of interleaved grid disks, and whether to utilize the flash disks as Exadata Smart Flash Cache or as grid disks, or a mix of the two. The best practice is to create at least two grid disks per cell disk, and to configure all the flash disks as Exadata Smart Flash Cache. For more details, refer to the earlier section in this chapter about architecting the storage on the Exadata Storage Servers.
The first step in configuring the Exadata Storage Server Software is to configure the Cell object. The Cell object refers to the Exadata Storage Server Software instance as a whole, and some of the parameters that you will set up in this step are the interconnect network that the Exadata Storage Server uses to serve the data traffic to the database nodes and the SNMP settings for monitoring of and forwarding of alerts. The steps that will follow the Cell creation step deal with configuring Exadata cell disks, grid disks, and Exadata Flash Cache.
Create the Exadata Cell Object
When configuring the Cell object, ensure that the interconnect network that the Exadata Storage Server uses to route data to the database nodes is the InfiniBand network. You can do this by verifying the name of the InfiniBand network interface using the Linux ifconfig utility. The dual ports of the InfiniBand network interface are configured during the initial setup process in a bonded mode and given a logical name of bond0.
Some of the other optional settings that you can perform during the Cell creation are to set up the Simple Mail Transfer Protocol (SMTP) server information for forwarding of alerts via e-mails and to set up the Simple Network Management Protocol (SNMP) to forward SNMP traps to a management and monitoring software infrastructure. You can also assign the logical realm name to the Exadata Storage Server. Realms are a logical grouping of Exadata Storage Servers for security purposes, and are discussed later in this chapter.
To create the Cell object, invoke the CellCLI utility and execute the CREATE CELL command.
CellCLI> CREATE CELL cell01 interconnect1=bond0, realmname=prod_cells
Cell cell01 successfully altered
Create the Cell Disks and Grid Disks
The LUNs (logical units) presented to the Exadata Storage Server Software are used to create cell disks and grid disks. Use the CREATE CELLDISK command shown next to create cell disks on the LUNs for which the cell disks have not yet been created, using default values. The cell disk is created on the entire LUN, and you are only allowed to create one cell disk per LUN, since there is a one-to-one mapping between a cell disk and a LUN. The CREATE CELLDISK command can be run repeatedly without affecting the LUNs or cell disks that were created earlier. This step should be repeated on all Exadata Storage Servers available in the Database Machine.
CellCLI> CREATE CELLDISK ALL
CellDisk CD_00_cell01 successfully created
. . .
CellDisk CD_10_cell01 successfully created
CellDisk CD_11_cell01 successfully created
After creating the cell disks, the next step is to create the grid disks. You can create one or more grid disks on a cell disk, and the first grid disk you create will be placed on the outermost tracks of the cell disks, unless you use interleaved grid disks, as described previously. The outer tracks are faster performing than the inner tracks, so the data that gets placed on grid disks residing on the outer tracks of the hard disk can be fetched much quicker than the data placed on the grid disk created on inner tracks. The best practice is to create a minimum of two grid disks on each cell disk and use the first (and the faster) grid disk for storing user data, and the second (and the slower) grid disk will be assigned to the ASM diskgroup that will house the FRA of the Oracle database.
The commands listed next will create two grid disks, allocating 300GB to the first disk and the remaining to the second. The PREFIX clause will prefix a text string to the name of the grid disk, which is useful for identifying the grid disks from ASM as mentioned earlier.
CellCLI> CREATE GRIDDISK ALL PREFIX=data, size=300G
GridDisk data_CD_1_cell01 successfully created
. . .
GridDisk data_CD_12_cell01 successfully created
CellCLI> CREATE GRIDDISK ALL PREFIX=recov
GridDisk recov_CD_1_cell01 successfully created
…
GridDisk recov_CD_12_cell01 successfully created
Create the Exadata Smart Flash Cache
Each Exadata Storage Server has flash disks created on the Sun Flash Accelerator F20 PCIe card modules, with each module exposed as one flash disk. As described earlier, you have a choice of creating Exadata Smart Flash Cache using the flash disks, or a combination of Flash Cache and grid disks. The default and the best practice configuration of flash disks is to create Exadata Smart Flash Cache on all the available flash disks, using the command shown here:
CellCLI> CREATE FLASHCACHE ALL
Flash cache cell01_FLASHCACHE successfully created
ASM and Database Configuration
The Oracle ASM cluster on the database nodes needs to be configured to use the grid disks created by the previous steps. Oracle ASM will be creating ASM diskgroups across the grid disks that are exposed by the Exadata Storage Servers. The database server also needs to be configured to communicate with the Exadata Storage Servers. The list of steps provided here configures the database and ASM nodes.
1. Set up the configuration files on the database and ASM host. The database and ASM nodes need the cellip.ora and cellinit.ora files that will be used by the database and the ASM cluster for routing the storage traffic to the Exadata Storage Servers via the InfiniBand network. The cellip.ora file stores the IP addresses of the Exadata Storage Server that will be accessed by the database and ASM clusters. The cellinit.ora file stores the IP address of the local database host InfiniBand network interface. These files are located in the /etc/oracle/networkconfig/directory on the database and ASM hosts. The sample contents of these files are as shown:
$> cat /etc/oracle/cell/networkconfig/cellip.ora
$> cat /etc/oracle/cell/networkconfig/cellinit.ora
2. Configure the database instance. The database cluster initialization parameter file needs to have the COMPATIBLE parameter set to 11.2.0.1.0 in order to ensure communication with the Exadata Storage Server Software. The ASM and database binaries require the COMPATIBLE parameter to be set to the version of the Exadata Storage Server Software. The parameter cannot be dynamically modified and will require a restart of the database. Use this command to set COMPATIBLE:
SQL Plus> ALTER SYSTEM SET COMPATIBLE='11.2.0.1.0' SCOPE=SPFILE;
3. Configure the ASM instance. In order for the ASM instance to be able to discover the grid disks on the Exadata Storage Servers, the ASM instance parameter file needs to be updated with the appropriate ASM_DISKSTRING parameter. The ASM_DISKSTRING parameter will determine the discovery path of the storage devices exposed by the Exadata Storage Servers to ASM. For the grid disks created on the Exadata Storage Servers, the storage path is o/*/*. You can update the ASM_DISKSTRING parameter dynamically with the following alter system command:
SQL Plus> ALTER SYSTEM SET ASM_DISKSTRING='o/*/*' SCOPE=BOTH;
4. Create ASM diskgroups. The Exadata Storage Server grid disks available to Oracle ASM are used to create ASM diskgroups. The grid disks can be queried from the ASM instance using the following SQL against the v$asm_disk view:
SQL> SELECT PATH, header_status STATUS FROM V$ASM_DIS
WHERE path LIKE 'o/%';
Once you have the list of the available ASM disks, you can use the CREATE DISKGROUP command shown next to create ASM diskgroups. This example will create two ASM diskgroups—DATA and RECOV. Note that you do not require the FAILGROUP clause, since ASM will define a failure group for each Exadata Storage Server. You are required to set the COMPATIBLE.RDBMS and COMPATIBLE.ASM attributes to 11.2.0.1.0, and the CELL.SMART_SCAN_CAPABLE attribute to true. This attribute enables the SQL offload processing on the objects that are placed in this ASM diskgroup.
SQL> CREATE DISKGROUP data NORMAL REDUNDANCY DISK 'o/*/DATA*'
ATTRIBUTE 'AU_SIZE' ='4M',
'cell.smart_scan_capable'='TRUE',
'compatible.rdbms'='11.2.0.1.0',
'compatible.asm'='11.2.0.1.0';
SQL> CREATE DISKGROUP recov NORMAL REDUNDANCY DISK 'o/*/RECOV*'
ATTRIBUTE 'AU_SIZE' ='4M',
'cell.smart_scan_capable'='TRUE',
'compatible.rdbms'='11.2.0.1.0',
'compatible.asm'='11.2.0.1.0';
Exadata Storage Server Security Configuration
The grid disks on the Exadata Storage Servers are the logical entities that will be used by ASM and the database to store database objects. Using the security features that are built into the Exadata Storage Server, you can configure permissions and set access controls on a grid disk and thereby authorize it to be accessed by a specific database or ASM cluster. This feature is useful in a consolidation environment with multiple databases deployed on the Exadata Database Machine, requiring you to control access to grid disks to a database or set of databases.
Exadata Security can be configured using one of the following modes:
![]() Open security In open security (or no security) mode, no access controls are set on the grid disks. Open security is useful when you are running development or test databases on the Exadata Database Machine and do not require stringent security requirements, or when you are running a production database and have secured access to the Database Machine by securing the network and the operating system. This is the default security mode, and out of the box, this is the mode that gets configured during the default setup of the Database Machine.
Open security In open security (or no security) mode, no access controls are set on the grid disks. Open security is useful when you are running development or test databases on the Exadata Database Machine and do not require stringent security requirements, or when you are running a production database and have secured access to the Database Machine by securing the network and the operating system. This is the default security mode, and out of the box, this is the mode that gets configured during the default setup of the Database Machine.
![]() ASM-scoped security Using the ASM-scoped security mode, you can set access controls on a grid disk and make it available to a specific ASM cluster, and to all databases that are accessing the ASM cluster. ASM-scoped security can be used when all databases that utilize an ASM cluster need the same level of access controls on the grid disks.
ASM-scoped security Using the ASM-scoped security mode, you can set access controls on a grid disk and make it available to a specific ASM cluster, and to all databases that are accessing the ASM cluster. ASM-scoped security can be used when all databases that utilize an ASM cluster need the same level of access controls on the grid disks.
![]() Database-scoped security The database-scoped security mode allows you to set access controls on a grid disk such that it is made available to a specific database cluster. ASM-scoped security is a pre-requisite for setting up database-scoped security. This mode of security is appropriate when you want to control the access to grid disks at the individual database cluster level.
Database-scoped security The database-scoped security mode allows you to set access controls on a grid disk such that it is made available to a specific database cluster. ASM-scoped security is a pre-requisite for setting up database-scoped security. This mode of security is appropriate when you want to control the access to grid disks at the individual database cluster level.
Exadata Storage Server Realms
Exadata Storage Server realms are logical groups of Exadata Storage Servers that are associated with a specific database or ASM cluster. Realms are optionally defined at the Storage Server level, with each server being associated with at most one realm, and the grid disks that belong to the server all reside in the same realm. Exadata Storage Servers belonging to a realm will have the same level of security and access controls set for the database and the ASM clusters. Figure 5-6 shows a typical use of realms.
There are multiple reasons for implementing Exadata Storage Server realms. One reason is to create multiple pools of storage in the storage grid. Storage pools are useful when you are consolidating multiple database environments on the Database Machine and you require dedicated storage pools for a particular database or ASM cluster. Another reason to use realms is to group Exadata Storage Servers together based upon similar security and access policy requirements of the database and ASM instances.
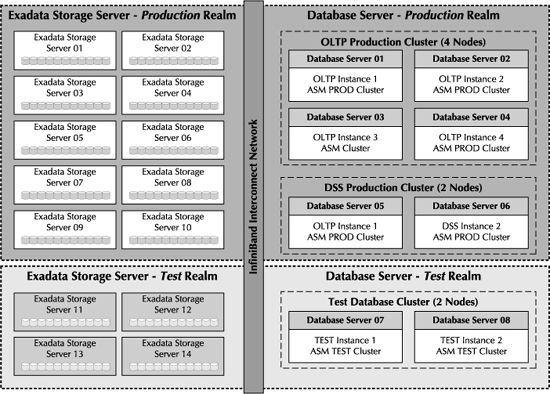
FIGURE 5-6. Exadata Storage Server realms
You can associate an Exadata Storage Server with a realm when you execute the CREATE CELL command using CellCLI. Or, you can use the ALTER CELL command to associate a realm with an existing Exadata Storage Server on which the Exadata Cell object was already created, as shown here:
CellCLI> ALTER CELL realmname=my_production_realmn
Implementing Exadata Security
The mechanism used for authenticating and authorizing grid disks to ASM and database clusters is based on security keys. The Exadata Storage Server assigns keys to grid disks, and the entities requesting access to the grid disk will need to provide this key during the security handshake phase. In case of ASM-scoped security, the ASM cluster provides the key, and the Exadata Storage Server will match up the key to the assigned keys of the grid disk. If they match, then the ASM cluster is authenticated to access the grid disk. The process is similar for the database-scoped security, except that the database cluster provides the key to the Exadata Storage Servers when requesting access to the grid disks. This authentication mechanism is transparent to the end user and happens underneath the covers, and only needs to be configured one time when performing the initial setup.
The keys for the grid disks are created and assigned using the CREATE KEY and ASSIGN KEY commands at the CellCLI prompt. The keys for the database-scoped and ASM-scoped security will be stored in the cellkey.ora file. The cellkey.ora file is located on the database and ASM cluster nodes, and each ASM and database cluster will have its own cellkey.ora file stored in different locations on the server.
Use the following guidelines as best practices for configuring Exadata Security:
![]() The security configuration should be implemented on all database servers that belong to the same realm. You cannot just configure a few nodes within a realm and not all of them. Ensure that the cellkey.ora file is the same for all the nodes within the realm in order to avoid a mismatch in the configuration, which could result in errors.
The security configuration should be implemented on all database servers that belong to the same realm. You cannot just configure a few nodes within a realm and not all of them. Ensure that the cellkey.ora file is the same for all the nodes within the realm in order to avoid a mismatch in the configuration, which could result in errors.
![]() ASM-scoped security and database-scoped security should not be mixed in the same realms; you will configure the realm to use one or the other, but not both.
ASM-scoped security and database-scoped security should not be mixed in the same realms; you will configure the realm to use one or the other, but not both.
![]() When you configure the security on the grid disks, you can use the dcli utility to avoid mismatch of access control configuration for grid disks that belong to the same ASM diskgroup. Dcli will ensure that you run the same command across multiple grid disks and will ensure consistency across the grid disks access control definitions to minimize errors.
When you configure the security on the grid disks, you can use the dcli utility to avoid mismatch of access control configuration for grid disks that belong to the same ASM diskgroup. Dcli will ensure that you run the same command across multiple grid disks and will ensure consistency across the grid disks access control definitions to minimize errors.
Exadata Storage Server Monitoring
The need for monitoring the hardware and software components comprising the Exadata Database Machine is unquestionable. Sometimes, a malfunctioning hardware component or an erratic behavior of a software component can cause failures that can adversely affect performance, or even the availability of the Exadata Database Machine. Being able to proactively detect and fix hardware and software issues will ensure optimal performance and healthy functioning of the Database Machine components.
This section will discuss the different tools and utilities available to monitor the Exadata Storage Servers. The monitoring methods will ensure that the different software and hardware components of the Exadata Storage Servers are operating as advertised and, more importantly, performing to their full potential without incurring undue bottlenecks. Any anomalies in the behavior of these components will be captured by the monitoring infrastructure, and the administrators will be alerted so that the corrective actions can be immediately implemented.
The tools available for monitoring the Exadata Storage Servers are the command-line utilities such as CellCLI and SQLPlus, and the web-based Oracle Enterprise Manager. The following options for monitoring the Exadata Storage Servers are discussed in this section:
![]() Monitoring with metrics and alerts
Monitoring with metrics and alerts
![]() Monitoring of active requests on the Exadata Storage Server
Monitoring of active requests on the Exadata Storage Server
![]() Monitoring using the Oracle Database v$views
Monitoring using the Oracle Database v$views
![]() Using Oracle Enterprise Manager for monitoring
Using Oracle Enterprise Manager for monitoring
![]() Using Oracle Integrated Lights Out Manager
Using Oracle Integrated Lights Out Manager
Monitoring with Metrics and Alerts
The Exadata Storage Server Software has a built-in infrastructure to monitor the overall health of the server and the health of its individual hardware and software components. The monitoring infrastructure periodically collects information about certain parameters that are deemed critical for the normal functioning of the Exadata Storage Server. When these parameters cross predefined threshold boundaries, the monitoring infrastructure will automatically trigger alerts to the concerned administrators. The alerts will assist administrators to take corrective actions in a timely manner and help ensure a speedy resolution to the problem. These types of problems, if left unresolved, can hamper the availability of the Exadata Storage Servers and the Exadata Database Machine.
Metrics and alerts form the core infrastructure behind the monitoring of Exadata Storage Servers. These topics are discussed in this section.
Metrics
The software and hardware components that comprise the Exadata Storage Server are characterized into entities called objects. Examples of objects are cell disks, grid disks, Exadata Smart Flash Cache, host interconnect network, and the Exadata Storage Server itself. Each object is associated with certain properties that measure its performance or state, and these properties are characterized as metrics. An example of a metric associated with the cell disk object is the property that measures the total MBs read from the cell disk due to large I/O requests (the metric MBytes read from disk for large I/Os).
The metrics are categorized into the following types based on their values:
![]() Instantaneous metrics always capture the current value of the property of the object being measured.
Instantaneous metrics always capture the current value of the property of the object being measured.
![]() Cumulative metrics measure the property of the object whose values have accumulated since the metric was created.
Cumulative metrics measure the property of the object whose values have accumulated since the metric was created.
![]() Rate metrics record the rate of change of the metric value measured over a given period.
Rate metrics record the rate of change of the metric value measured over a given period.
![]() Transition metrics capture a change in the state of the object when the object transitions to a different state.
Transition metrics capture a change in the state of the object when the object transitions to a different state.
The metric values are categorized into different domains called thresholds. The different types of thresholds that are predefined by the system are normal, warning, and critical. When the object associated with the metric is working as expected, the metric value will fall in the normal range, below the warning threshold. A metric that falls over the critical threshold indicates that the Exadata Storage Server has encountered a critical issue with the object or the metric and the object may not be functioning as expected. The metric value that falls between the warning and critical thresholds is considered to be in the warning range.
Metrics are measured in units that correlate to the type of metric. For example, the CPU utilization metric will be measured as a percentage, and the CPU temperature will be measured in degrees Celsius.
Multiple metrics will be associated with an object, and all the possible metrics that have an effect on the overall functioning and behavior of the Exadata Storage Server have been predefined by the Exadata Storage Server Software. Users are not allowed to modify or add to the system-defined metrics; however, they are allowed to modify the preset thresholds or create new thresholds on the built-in metrics.
The metric collection process in the Exadata Storage Server is similar to the Automatic Workload Repository (AWR) metrics collection of the Oracle database. The CELLSRV process periodically records the metric values in the main process memory. The Management Server (MS) process will periodically flush the metrics accumulated by CELLSRV from the main memory and persist it to the hard disk. The metrics are then kept on disk for a default period of seven days. This default period can be modified, if needed, by altering the metricHistoryDays attribute using CellCLI. This example will modify the metricHistoryDays attribute to store 12 days’ worth of metric history:
CellCLI> alter cell set metricHistoryDays=12
NOTE
The complete list of system-defined metrics, objects, alerts, and thresholds are described in the Oracle Exadata Storage Server Software Users Guide.
Alerts
Alerts are notices of important events occurring in the Exadata Storage Server. The events leading to an alert will generally indicate that the server has encountered an issue that can hamper its normal function. The Exadata Storage Server Software has predefined alerts on critical events that are known to interfere with the normal functioning of the Exadata Storage Server.
The MS process is responsible for triggering alerts. MS will trigger alerts when it encounters the following issues:
![]() Hardware issues Errors due to the failure of a hardware component such as the flash card.
Hardware issues Errors due to the failure of a hardware component such as the flash card.
![]() Software issues Internal errors raised by the CELLSRV process or errors due to a misconfiguration of the Exadata Storage Server Software.
Software issues Internal errors raised by the CELLSRV process or errors due to a misconfiguration of the Exadata Storage Server Software.
![]() Metrics having critical or warning values When metric values cross into the warning or critical threshold range, alerts can be triggered. These alerts will be triggered once the users define thresholds on the metric values.
Metrics having critical or warning values When metric values cross into the warning or critical threshold range, alerts can be triggered. These alerts will be triggered once the users define thresholds on the metric values.
Alerts can be stateful or stateless. Stateful alerts indicate a condition that can be tested again to see if the issue still exists. Alerts that are raised due to a cumulative metric exceeding a threshold value is an example of a stateful alert. Stateless alerts are events that have occurred at a point in time and the condition that triggered the alert no longer exists. An example of a stateless alert is the ORA-00600 errors raised by the CELLSRV process in the Automatic Diagnostics Repository (ADR) due to internal software issues that were encountered in the past.
Alerts are associated with a severity level of critical, warning, clear, or informational. The level of severity determines the degree of the fault that occurred in the system.
![]() Critical alerts indicate a condition that can interfere with the normal functioning of the Exadata Storage Server. Critical alerts will require immediate attention from the administrators to take corrective actions. If the alert definition is based on a metric (not hardware or internal alerts), the critical alert is raised when the metric value crosses over to the critical threshold. For hardware and internal alerts, the critical alerts are raised based on predefined conditions.
Critical alerts indicate a condition that can interfere with the normal functioning of the Exadata Storage Server. Critical alerts will require immediate attention from the administrators to take corrective actions. If the alert definition is based on a metric (not hardware or internal alerts), the critical alert is raised when the metric value crosses over to the critical threshold. For hardware and internal alerts, the critical alerts are raised based on predefined conditions.
![]() Warning alerts indicate an issue that is categorized as a warning condition, or a condition that has the tendency to become critical if it is not immediately taken care of. If the alert definition is based on a metric, the warning alert is raised when the metric value crosses into the warning threshold.
Warning alerts indicate an issue that is categorized as a warning condition, or a condition that has the tendency to become critical if it is not immediately taken care of. If the alert definition is based on a metric, the warning alert is raised when the metric value crosses into the warning threshold.
![]() A clear alert is signaled by the system when the previously raised warning or critical alert gets cleared because the condition no longer exists. If the alert definition is based on a metric, the clear alert indicates that the metric value is now within the normal threshold.
A clear alert is signaled by the system when the previously raised warning or critical alert gets cleared because the condition no longer exists. If the alert definition is based on a metric, the clear alert indicates that the metric value is now within the normal threshold.
![]() Informational alerts are merely messages that do not require administrative actions. These alerts are neither notified by e-mail nor propagated through the SNMP agents, but can be viewed through the CellCLI interface.
Informational alerts are merely messages that do not require administrative actions. These alerts are neither notified by e-mail nor propagated through the SNMP agents, but can be viewed through the CellCLI interface.
The health of the Exadata Storage Server can be monitored either by querying metrics and alerts using the CellCLI interface or by configuring automated mechanisms for propagating alerts to the administrator responsible for managing and maintaining the Exadata Database Machine. The alerts can be notified using e-mails, or can be propagated to external SNMP agents, or can be monitored using the Oracle Enterprise Manager Exadata plug-in. The next few topics talk about the monitoring of metrics and alerts using the CellCLI interface.
Monitoring Metrics Using CellCLI
The CellCLI interface allows you to query internal system objects that are used by Exadata Storage Server Software to persist data collected by the monitoring and alerting infrastructure. The metric definitions and their values are internally stored in the metricdefinition, metriccurrent, and the metrichistory objects. The metricdefinition object stores the definitions of the metrics and their configuration; the metriccurrent object stores the current values of the metrics; and the metrichistory object stores the historical values of the metrics.
To get a detailed list of all the attributes of these objects, use the DESCRIBE command from the CellCLI interface.
CellCLI> DESCRIBE METRICDEFINITION;
To query the metrics and their values from these objects, you will use the LIST command. You can filter the results of the LIST command by using a WHERE clause. You can display either specific columns of interest using the ATTRIBUTES clause or all columns using the DETAIL clause. For a detailed usage of the LIST command, refer to the Oracle Exadata Storage Server Software Users Guide.
Example 5-1
If you would like to get a list of all metrics that have been defined in the system, use the LIST METRICDEFINITION command. The command in the next example will display the metrics associated with the cell object, along with their descriptions and units. The cell object is associated with the Exadata Storage Server hardware.
CellCLI> LIST METRICDEFINITION WHERE objectType='CELL' -
ATTRIBUTES name, description, unit
Monitoring Current Metrics
When interested in monitoring the current state of the system, you would start with the metriccurrent object. The LIST METRICCURRENT command is used to display the current value of a metric. Depending on the type of metric, the current value can indicate an instantaneous value, cumulative value, rate of change, or a transition in the state of the metric.
Here are a few examples of monitoring using metriccurrent object.
Example 5-2
The LIST command shown next displays the current value of cl_fans metric. The cl_fans metric is an instantaneous metric that displays the number of working fans in the Exadata Storage Server, and is a metric associated with the Cell object.
CellCLI> LIST METRICCURRENT CL_FANS DETAIL;
Example 5-3
The next example displays the current value of the cd_io_by_r_lg metric for the celldisk object. The cd_io_by_r_lg metric is the cumulative MBs read for large I/Os from a cell disk. The celldisk object is associated with the cell disks of the Exadata Storage Server.
CellCLI> LIST METRICCURRENT CD_IO_BY_R_LG WHERE objectType='CELLDISK'
Monitoring Metric History
Monitoring historical values of metrics helps you to correlate current issues with the ones that occurred previously and to predict potential issues that could arise based on a historical pattern discovery, and thereby empowers you to prevent future problems. The LIST METRICHISTORY command will display the historical values associated with the metric. As discussed earlier, the number of days of metric history that is stored in the system is determined by the metricHistoryDays setting on the Exadata Storage Server.
Example 5-4
At times, you might be interested in getting a list of historical values of a metric that raised an alert because the value of the metric was in an abnormal range. The following example will display the historical values of fc_io_rq_r for which a critical or warning alert was triggered. The fc_io_rq_r metric stores the cumulative value of the read I/O requests that were satisfied from the Exadata Smart Flash Cache.
CellCLI> LIST METRICHISTORY FC_IO_RQ_R WHERE alertState!='normal' -
ATTRIBUTES name, alertState, metricValue
Example 5-5
Similar to the previous example, the next example displays the historical values of the cumulative metric n_mb_sent for the cases when the accumulated value of the metric exceeded 100MB. The n_mb_sent metric is the cumulative number of MBs transmitted from the Exadata Storage Server to the database server.
CellCLI> LIST METRICHISTORY N_MB_SENT WHERE metricValueMax > 100
Monitoring IORM Metrics
I/O Resource Manager (IORM), described in detail in Chapter 3, is the key engine behind the scheduling of I/O resources in the Exadata Storage Server. The metric collection process will capture metrics related to the utilization of I/O resources for each IORM plan configured on the server. It is possible to monitor the I/O resource consumption of the different plans and, more importantly, to identify if the I/O requests are waiting to be scheduled because they have exceeded their I/O allocations as defined by the plan. Once the IORM waits are identified, they can be tuned by altering the plan’s I/O allocations or by adding resources to satisfy the I/O requests.
Each of the three types of IORM plans (intradatabase, category, and interdatabase plans) have a set of metrics that are captured by the Exadata Storage Server Software. For each plan, the metrics will capture:
![]() Total I/O requests generated
Total I/O requests generated
![]() I/O requests per second issued in the last minute
I/O requests per second issued in the last minute
![]() Total number of seconds the I/O requests waited due to scheduling by IORM
Total number of seconds the I/O requests waited due to scheduling by IORM
![]() The average number of seconds the requests waited to be scheduled in the last minute
The average number of seconds the requests waited to be scheduled in the last minute
These metrics are captured separately for small I/Os and large I/Os. Large I/Os are full scans typically generated by data warehousing workloads and the I/O size is larger than 128K. Small I/Os are typically generated by OLTP workloads where the I/O size is smaller than or equal to 128K. Refer to the Oracle Exadata Storage Server Software Users Guide for the complete list of system-defined IORM metrics.
The IORM metrics are queried from the metriccurrent and metrichistory objects by using the objectType attribute as the filter. The IORM-related objectType has the values of IORM_CATEGORY, IORM_DATABASE, and IORM_CONSUMER_GROUP for the category, interdatabase, and intradatabase IORM plans, respectively. The metricObjectName attribute identifies the different resources within the IORM plan, and the metricValue stores the current I/O utilization rate. In an interdatabase plan, the metricObjectName attribute will display the database instance that is part of the IORM plan.
Certain system-defined IORM categories exist in the Exadata Storage Server that are associated with system-generated I/O requests, such as ASM rebalance I/O operations, I/O requests generated by database background processes, and backup I/O. The I/O priorities of these requests are predefined by the system, and some I/O requests, such as redo and control file I/O, will have higher priority over the user-generated I/O. Other requests such as ASM rebalance and backup I/O will have a lower priority than the user I/O.
Here are some examples of monitoring IORM metrics.
Example 5-6
This example will list the current IORM metrics related to interdatabase, category, and intradatabase plans. The attributes displayed will be the name, metricObjectName, metricValue, and the collectionTime. The collectionTime will store the timestamp of the metric collection.
CellCLI> LIST METRICCURRENT WHERE objectType ='IORM_DATABASE' -
ATTRIBUTES name, metricObjectName, metricValue, collectionTime
CellCLI> LIST METRICCURRENT WHERE objectType ='IORM_CATEGORY' -
ATTRIBUTES name, metricObjectName, metricValue, collectionTime
CellCLI> LIST METRICCURRENT WHERE objectType ='IORM_CONSUMER_GROUP' -
ATTRIBUTES name, metricObjectName, metricValue, collectionTime
Example 5-7
Monitoring historical values is important to understand the trend in I/O utilization rates by the consumers so you can tune your IORM plan allocations. The next example lists the historical values of interdatabase plan metrics that measure waits incurred due to scheduling of I/O requests by IORM. These metrics have the _io_wt_ string in the name attribute.
CellCLI> LIST METRICHISTORY WHERE objectType ='IORM_DATABASE' -
AND name like '.*_IO_WT_.*' AND metricValue > 0 -
ATTRIBUTES name, metricObjectName, metricValue, collectionTime
Example 5-8
The metrics with _io_rq_ string in the name display the I/O requests issued by each IORM plan to the Exadata Storage Server. The following command will list the historical values of these metrics for the category IORM plan, the result of which you can use to find the category plan that initiated the most I/O requests and modify the I/O resource allocations for the plan as appropriate.
CellCLI> LIST METRICHISTORY WHERE objectType ='IORM_CATEGORY' -
AND name like '.*_IO_RQ_.* ' AND metricValue > 0 -
ATTRIBUTES name, metricObjectName, metricValue, collectionTime
Monitoring Alerts Using CellCLI
The possible alerts that can be raised by the system are queried from the alertdefinition object using the LIST command. The alerts raised due to hardware and software issues are predefined and cannot be altered or deleted by the users. However, the users can create their own alerts based on the predefined metrics and thresholds. A few examples of monitoring alerts using CellCLI are provided next.
Example 5-9
This example executes the LIST command to display all alerts that are defined in the system (the results are truncated). As you can see, the metric-based alerts have the metricName attribute populated. The system-defined alerts, such as ADRAlert and HardwareAlert, are not based on a metric and hence do not have a metricName. The alert StatefulAlert_CD_IO_ERRS_MIN is based on the cd_io_errs_min metric, which is the metric that captures the rate of I/O errors on a cell disk per minute.
CellCLI> LIST ALERTDEFINITION ATTRIBUTES name, metricName, alertType,
description
ADRAlert Stateless "Incident Alert"
HardwareAlert Stateless "Hardware Alert"
StatefulAlert_CD_IO_ERRS_MIN CD_IO_ERRS_MIN Stateful "Threshold Alert"
Example 5-10
This LIST command displays the definition of the HardwareAlert in detail.
CellCLI> LIST AERTDEFINITION HardwareAlert DETAIL
name: HardwareAlert
alertShortName: Hardware
alertSource: Hardware
alertType: Stateless
description: "Hardware Alert"
metricName:
Alert History
Alerts are captured in the alerthistory object. The alerthistory object can be manually queried to display a detailed history on the alerts triggered in the system since the last metricHistoryDays. The alerthistory object has the examinedBy attribute, which gets updated when the alert is acknowledged by an administrator.
This example will list all alerts that are of critical severity and the ones that have not been acknowledged:
CellCLI> LIST ALERTHISTORY WHERE severity ='critical' -
AND examinedBy ='' DETAIL
Acknowledging Alerts
To acknowledge an alert, use the ALTER command and update the examinedBy attribute. This action will notify other administrators that the alert has been acknowledged and worked upon. The ALTER ALERTHISTORY command allows you to modify either individual alerts (by providing the alert identifier) or all alerts in the system. These examples illustrate the use of this command:
CellCLI> ALTER ALERTHISTORY 123456633 examinedBy='JohnSmith'
CellCLI> ALTER ALERTHISTORY ALL examinedBy='JohnSmith'
Propagating Alerts via SNMP and SMTP
When alerts are triggered by the system, they can be optionally configured to be propagated through e-mails or SNMP agents to the outside world. The e-mails are sent to predefined addresses using SMTP, and the SNMP messages will be propagated to external SNMP agents. The Exadata Storage Server Software needs to be configured in order to enable this propagation.
The cell object attributes associated with SMTP and SNMP settings are
![]() smtpToAddr The e-mail address where the SMTP notifications are delivered
smtpToAddr The e-mail address where the SMTP notifications are delivered
![]() snmpSubscriber The SNMP subscriber hosts receiving the SNMP alerts
snmpSubscriber The SNMP subscriber hosts receiving the SNMP alerts
![]() notificationPolicy The policy dictating the types of alerts that will be forwarded
notificationPolicy The policy dictating the types of alerts that will be forwarded
![]() notificationMethod Indicates the notification methods that are active
notificationMethod Indicates the notification methods that are active
This example configures the SMTP and SNMP settings. The other attributes used in the example should be self-explanatory.
CellCLI> ALTER CELL smtpServer='smtp.example.com', -
smtpFromAddr='exadataV2@example.com', -
smtpFrom='John Smith', -
smtpToAddr='john.smith@example.com', -
snmpSubscriber=((host=host1),(host=host2)), -
notificationPolicy='critical,warning, clear', -
notificationMethod='mail,snmp'
The SMTP and SNMP settings can be validated by using these ALTER CELL VALIDATE commands:
CellCLI> ALTER CELL VALIDATE MAIL
CellCLI> ALTER CELL VALIDATE SNMP
Creating Threshold Alerts
To configure alerts based on metrics, you need to create thresholds on the metric values using the CREATE THRESHOLD command. Thresholds can be created on metrics that are defined in the alertdefinition object and have the description attribute set to ‘Threshold Alert.’ Based on the thresholds, an alert will be triggered when the metric value transitions to the warning or a critical range.
Use this LIST command to display the metrics upon which you can define thresholds:
CellCLI> LIST ALERTDEFINITION WHERE description = 'Threshold Alert' DETAIL
Example 5-11
The example shown next creates a threshold that triggers alerts based on the gd_io_errs_min metric. The gd_io_errs_min metric measures the rate of I/O errors on a grid disk per minute. The threshold created will raise a warning alert when the gd_io_errs_min metric value crosses over 100, and will raise a critical alert when the value crosses 200.
CellCLI> CREATE THRESHOLD gd_io_errs_min.gd_threshold warning=100, critical=200, -
comparison='='
Monitoring Flash Cache Statistics
The flashcachecontent object stores information about the objects stored in the Exadata Smart Flash Cache. You can query the size occupied by the objects and the utilization statistics such as the cache hit-and-miss ratios by querying the flashcachecontent object. To view all the attributes of the flashcachecontent object, use the DESCRIBE command, as shown here:
CellCLI> DESCRIBE FLASHCACHECONTENT
cachedKeepSize
cachedSize
dbID
hitCount
hoursToExpiration
missCount
objectNumber
tableSpaceNumber
Monitoring an Object’s Placement in Exadata Smart Flash Cache
If you would like to verify that a specific object has been placed in the Exadata Smart Flash Cache, you should first look up the object_id of the object from the dba_objects dictionary view and then match the object_id against the objectNumber attribute of the flashcachecontent object, as shown in this example:
SQL> SELECT object_id FROM DBA_OBJECTS WHERE object_name='SALES';
OBJECT_ID
- - - - - - - - -
12354
CellCLI> LIST FLASHCACHECONTENT WHERE objectNumber=12354 DETAIL
cachedSize: 192244484
dbID: 34211
hitCount: 215241
missCount: 1014
objectNumber: 12354
tableSpaceNumber: 1
Monitoring Exadata Flash Cache Status
The details on the Exadata Smart Flash Cache and its status can be monitored using the flashcache object. When the object is queried, it will display the cell disks that comprise the Flash Cache, along with the total size of the cache and its overall status.
CellCLI> LIST FLASHCACHE DETAIL
name: cell1_FLASHCACHE
cellDisk: FD_00_cell1,FD_01_cell1,FD_02_cell1,FD_03_cell1
creationTime: 2009-11-05T06:55:16-08:00
id: a86a91ba-73e4-422a-bc83-7a9dbe715a0f
size: 1.5625G
status: normal
Monitoring Active Requests
The I/O requests that are actively processed by the Exadata Storage Servers can be monitored using the activerequest object. Use the DESCRIBE ACTIVEREQUEST command to get the complete list of attributes monitored by this object. A few relevant attributes of this object are listed here:
![]() ioGridDisk The grid disk serving the I/O request.
ioGridDisk The grid disk serving the I/O request.
![]() ioReason The reason why the I/O is generated.
ioReason The reason why the I/O is generated.
![]() ioType The type of the I/O activity.
ioType The type of the I/O activity.
![]() requestState Determines the state of the active request. Some values of this attribute are accessing from disk, sending or receiving from the network, and waiting in the queue for predicate pushing (Exadata Smart Scans).
requestState Determines the state of the active request. Some values of this attribute are accessing from disk, sending or receiving from the network, and waiting in the queue for predicate pushing (Exadata Smart Scans).
![]() objectNumber The database object_id associated with the request.
objectNumber The database object_id associated with the request.
The following command displays all active requests of type predicate pushing, which indicates that the request is performing a Smart Scan operation on the Exadata Storage Server:
LIST ACTIVEREQUEST WHERE ioType ='predicate pushing' DETAIL
Monitor Using the Oracle Database
Using the database dictionary views from the database instance, you can monitor the efficiency of the Exadata Storage Server Software and the individual SQLs utilizing the Exadata Storage Server features such as Smart Scans, storage indexes, and Exadata Smart Flash Cache.
The following topics are discussed in this section:
![]() Monitoring SQL offload processing execution plans
Monitoring SQL offload processing execution plans
![]() Using SQL to monitor the Exadata Storage Server features
Using SQL to monitor the Exadata Storage Server features
Monitoring SQL Offload Processing Execution Plans
The Smart Scan feature of the Exadata Storage Server Software will offload processing of certain SQL operations to the Exadata Storage Servers, thereby allowing the data to be processed closer to where it resides. SQL offload processing is enabled by default at the database instance level by the initialization parameter CELL_OFFLOAD_PROCESSING.
When CELL_OFFLOAD_PROCESSING is TRUE, the database will attempt to offload the SQL to be processed by the Exadata Storage Servers. The decision to offload the SQL is a runtime decision and depends on several factors, which are detailed in the Exadata Storage Server Software Users Guide. When CELL_OFFLOAD_PROCESSING is set to FALSE, the database processes the SQL in the database servers and the Exadata Storage Servers will merely serve regular blocks to the database nodes.
CELL_OFFLOAD_PROCESSING can be set at the system and the session level by using the ALTER SYSTEM or the ALTER SESSION commands. This command enables SQL offload processing for the session executing the command:
SQL> ALTER SESSION SET CELL_OFFLOAD_PROCESSING = TRUE;
You can also enable (or disable) the CELL_OFFLOAD_PROCESSING for a SQL by using the OPT_PARAM hint. The SQL-level setting overrides the session-level settings, which in turn overrides the system-level settings. This example will enable offload processing only for the SQL using the OPT_PARAM hint:
SQL> SELECT /*+ OPT_PARAM('cell_offload_processing', 'true') */ COUNT(*)
FROM SALES;
Whether the SQL query is offloaded to the Exadata Storage Server for processing or not, you can always look at the execution plan of the SQL with the EXPLAIN PLAN command and determine the predicate or portion of the SQL that will be a candidate for offload processing. The EXPLAIN PLAN command has been enhanced to display the offloaded predicates in the storage section of its output. This feature of EXPLAIN PLAN exists even when you do not have the Exadata Storage Servers as the storage grid serving the database.
The database parameter CELL_OFFLOAD_PLAN_DISPLAY must be set to AUTO or ALWAYS in order for the EXPLAIN PLAN to display the predicate offload information. You can modify the parameter by using the ALTER SESSION or ALTER SYSTEM command, as shown in this example:
SQL> ALTER SESSION SET CELL_OFFLOAD_PLAN_DISPLAY = ALWAYS;
The possible values for CELL_OFFLOAD_PLAN_DISPLAY are
![]() AUTO This is the default value. AUTO will instruct EXPLAIN PLAN to display the storage section when the Exadata Storage Servers are configured as the storage layer.
AUTO This is the default value. AUTO will instruct EXPLAIN PLAN to display the storage section when the Exadata Storage Servers are configured as the storage layer.
![]() ALWAYS This setting will display the storage section, regardless of whether the database storage layer resides on Exadata Storage Servers or not.
ALWAYS This setting will display the storage section, regardless of whether the database storage layer resides on Exadata Storage Servers or not.
![]() NEVER The storage section will never be displayed.
NEVER The storage section will never be displayed.
The output shown here is an example of EXPLAIN PLAN with the storage section (highlighted in bold):
SQL> select count(*) from SALES where CUSTOMER_ID>2000; Execution Plan
Plan hash value: 2189604569
----------------------------------------------------------
|Id| Operation | Name | Rows | Bytes| Cost (%CPU)| Time |
-----------------------------------------------------------------------------
| 0| SELECT STATEMENT | | 1 | 13 | 5815 (1)| 00:01:10 |
|1| SORT AGGREGATE | | 1 | 13 | | |
|*2| TABLE ACCESS STORAGE FULL| SALE |1347K | 16M| 5815 (1)| 00:01:10 |
-----------------------------------------------------------------------------
Predicate Information (identified by operation id):
---------------------------------------------------
2 - storage("CUSTOMER_ID"> (2000))
filter("CUSTOMER_ID"> (2000))
Using SQL to Monitor the Exadata Storage Server
In this section, we will discuss the frequently used monitoring commands that you can execute from the database nodes using SQL for calculating efficiencies of various Exadata Storage Server features.
Calculating the Exadata Smart Scan Efficiency
The efficiency of Exadata Smart Scans is defined as the ratio of bytes fetched by the hard disks on the Exadata Storage Server to the bytes forwarded to the database servers for further processing. The higher values of this ratio indicate that the Storage Servers are filtering more results and are forwarding only the relevant information to the database servers, thereby indicating a higher efficiency of Smart Scans. When there are no Smart Scan operations occurring, the offload efficiency will be 1.
The Smart Scan efficiency can be computed for individual SQL statements, and also for the Exadata Storage Server. The formula for computing the efficiency at the Exadata Storage Server level using the v$sysstat statistics is given here:
(cell IO uncompressed bytes + cell physical IO bytes saved by storage index)/(cell physical IO interconnect bytes returned by smart scan)
The v$sysstat statistics referenced in this calculation are defined here:
![]() Cell IO uncompressed bytes is the statistic that represents the total size of uncompressed data processed on the Exadata Storage Server. When the data is compressed and needs to be decompressed on the Exadata Storage Server for evaluating Smart Scan predicates, the size of data after decompression is added to this statistic instead of the compressed size.
Cell IO uncompressed bytes is the statistic that represents the total size of uncompressed data processed on the Exadata Storage Server. When the data is compressed and needs to be decompressed on the Exadata Storage Server for evaluating Smart Scan predicates, the size of data after decompression is added to this statistic instead of the compressed size.
![]() Cell physical IO bytes saved by storage index represents the total I/O bytes saved by the storage index, which otherwise would lead to a physical I/O if the index didn’t exist. In the equation for calculating Smart Scan efficiency, this statistic is added to the cell IO uncompressed bytes, and this is done in order to separate the benefits obtained by the storage indexes from that of the Smart Scans.
Cell physical IO bytes saved by storage index represents the total I/O bytes saved by the storage index, which otherwise would lead to a physical I/O if the index didn’t exist. In the equation for calculating Smart Scan efficiency, this statistic is added to the cell IO uncompressed bytes, and this is done in order to separate the benefits obtained by the storage indexes from that of the Smart Scans.
![]() Cell physical IO interconnect bytes returned by Smart Scan is the total I/O bytes returned by the Exadata Storage Server to the database server for Smart Scan operations only. Other I/Os that are not related to Smart Scans are excluded from this statistic.
Cell physical IO interconnect bytes returned by Smart Scan is the total I/O bytes returned by the Exadata Storage Server to the database server for Smart Scan operations only. Other I/Os that are not related to Smart Scans are excluded from this statistic.
Use the following SQL to calculate the Smart Scan efficiency for the Exadata Storage Server:
SELECT (a.value+b.value)/c.value as efficiency
FROM v$sysstat a, v$sysstat b, v$sysstat c
WHERE a.name ='cell IO uncompressed bytes'
AND b.name ='cell physical IO bytes saved by storage index'
AND c.name ='cell physical IO interconnect bytes returned by smart scan',
EFFICIENCY
----------
45.9
Monitoring Storage Index Utilization
The statistic that you will use to measure the benefit of Exadata storage indexes is the cell physical I/O bytes saved by storage index. This statistic will display the I/O bytes saved by the storage indexes that otherwise would have led to a physical I/O. The statistic is available in the v$sysstat, v$sesstat, and v$mystat tables, and also the corresponding gv$ tables for the Oracle RAC cluster.
SELECT name, value
FROM v$sysstat
WHERE name ='cell physical IO bytes saved by storage index';
Monitoring Exadata Smart Flash Cache Efficiency
The relevant statistic to measure the hits against Exadata Smart Flash Cache is cell flash cache read hits. The statistic will display the cumulative number of I/O requests that were satisfied by Exadata Smart Flash Cache. The statistic is available in the v$sysstat, v$sesstat, and v$mystat tables, and also the corresponding gv$ tables for the RAC cluster.
SELECT name, value
FROM v$sysstat
WHERE name ='cell flash cache read hits';
NAME VALUE
-------------------------- -----
cell flash cache read hits 19876
Monitoring with Oracle Enterprise Manager
Oracle Enterprise Manager provides a broad set of system management functions for managing the entire stack of Oracle and non-Oracle products deployed in the enterprise-wide data center. With Enterprise Manager, you have a centralized mechanism for managing, monitoring, and administering the complete Oracle ecosystem, all the way from business processes and applications to the disk subsystem that houses the critical enterprise data. Enterprise Manager has a single web-based management console providing a unified interface that integrates seamlessly with other Enterprise Manager add-on components.
Enterprise Manager reduces the cost and complexity of managing grid-based applications by providing a rich service-level management functionality that enables top-down service-level monitoring that is focused on end-user performance. This capability will accelerate the diagnosis and resolution of critical performance issues that spawn multiple components of the enterprise grid by allowing the user to correlate issues across the components of the grid, and all this is available through a single unified interface.
Enterprise Manager can manage non-Oracle technologies through the use of System Monitoring Plug-ins. The System Monitoring Plug-in is a piece of software that has the core technology to interface with third-party targets and sometimes even Oracle targets such as the Exadata Storage Server. This functionality provides an integrated solution for managing the entire technology stack, both Oracle and non-Oracle, using the single unified Enterprise Manager console.
Enterprise Manager provides Management Connectors through which you can integrate third-party management software by using SNMP trap notifications. This capability allows the reuse of existing management tools that the company has already invested in, through a bidirectional event exchange mechanism of critical messages and events between the third-party tool and the Oracle Enterprise Manager. With this integration, you can create further actions to be taken by the third-party management tool from the alerts generated by Oracle Enterprise Manager, and vice versa. For example, by using the Management Connectors, it is possible to propagate an alert triggered by a target managed in Oracle Enterprise Manager to third-party incident management software that could automatically generate trouble tickets upon receiving the alert.
The System Monitoring Plug-ins and Management Connectors can also be created by third-party software vendors by following the guidelines that are set by Oracle. This allows you to extend and customize Oracle Enterprise Manager to monitor any component, including custom applications and network infrastructure, and enable you to integrate Enterprise Manager with other management tools that are able to monitor these components at a more granular level.
The components listed next comprise the Enterprise Manager architecture, as illustrated in Figure 5-7.
![]() Oracle Management Service (OMS) OMS is the heart of the Oracle Enterprise Manager architecture and is responsible for providing the management interface and the means for communicating between an Oracle Management Agent and the Oracle Management Repository.
Oracle Management Service (OMS) OMS is the heart of the Oracle Enterprise Manager architecture and is responsible for providing the management interface and the means for communicating between an Oracle Management Agent and the Oracle Management Repository.
![]() Oracle Management Agent (Management Agent) The Management Agent collects information from the monitored targets and feeds into the Oracle Management Repository through OMS.
Oracle Management Agent (Management Agent) The Management Agent collects information from the monitored targets and feeds into the Oracle Management Repository through OMS.
![]() Oracle Management Repository (Management Repository) Management Repository stores the information collected by the target systems through the Management Agents. The Management Repository resides in an Oracle Database.
Oracle Management Repository (Management Repository) Management Repository stores the information collected by the target systems through the Management Agents. The Management Repository resides in an Oracle Database.
![]() Oracle Enterprise Manager Grid Control Console (Grid Control Console) The web-based front end to the Management Service. Grid Control Console can be accessed through the network, and allows the user to monitor and manage all the targets from a single location.
Oracle Enterprise Manager Grid Control Console (Grid Control Console) The web-based front end to the Management Service. Grid Control Console can be accessed through the network, and allows the user to monitor and manage all the targets from a single location.
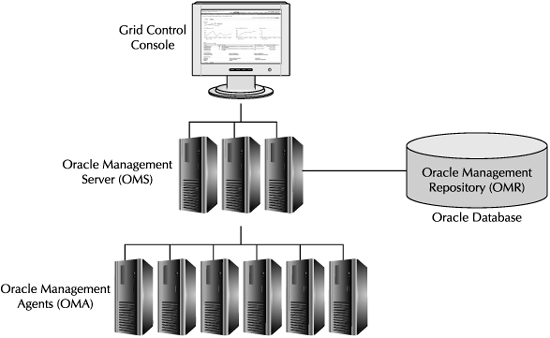
FIGURE 5-7. Enterprise Manager architecture
Oracle Enterprise Manager can monitor the Exadata Storage Servers through the System Monitoring Plug-in for Exadata and the Enterprise Manager Ops Center connector. These topics are discussed next.
Oracle Enterprise Manager System Monitoring Plug-In for Exadata
The System Monitoring Plug-in for the Oracle Exadata Storage Server enables you to manage and monitor Exadata Storage Server targets using Oracle Enterprise Manager. The plug-in allows you to gather storage configuration and performance information about the Exadata Storage Server components such as cell disks, grid disks, and the Exadata Smart Flash Cache.
The plug-in also allows you to utilize the notification and alerts infrastructure of Enterprise Manager to propagate alerts originally triggered by the Exadata Storage Servers, made possible by setting thresholds on the Exadata Storage Server metrics within Enterprise Manager. Moreover, the rich graphical user interface of the Grid Control Console and the comprehensive reporting capability of the tool will allow you to have a point-and-click administration interface to the Exadata Storage Server.
The System Monitoring Plug-in uses the Management Server and utilizes the Management Agent to manage the Exadata Storage Server targets. The Management Agent can be installed on any host (including the OMS host) that can communicate with the Exadata Storage Servers through the Secure Shell (SSH) protocol, connecting to the Exadata Storage Servers using the management Ethernet IP addresses. However, you should not install the agent on the Exadata Storage Server targets, because such an installation is not supported by Oracle. The setup and configuration of the System Monitoring Plug-in is documented in the System Monitoring Plug-in Installation Guide for the Oracle Exadata Storage Server.
You can start monitoring the Exadata Storage Server targets once the plug-in is installed and configured. The target section of the Grid Control Console will show the Exadata Storage Server targets. You will land at the home page of the Exadata Storage Server when you click one of the Exadata Storage Server targets.
The home page for an Exadata Storage Server is composed of the General, Alerts, Configuration, and the Related Actions sections, as shown in Figure 5-8. The General section shows the current status of the Exadata Storage Server, and the uptime during the last 24 hours is displayed as a percentage. You can also configure a Black Out schedule from this section by clicking the Black Out link. A Black Out schedule is used to suspend monitoring activities such as the triggering of alerts on the server, and is normally used for planned maintenance operations.
The Alerts section displays a list of alerts that are triggered by the Exadata Storage Servers. The attributes of the alerts that are displayed are the metric name, metric value, and the time of the alert. The Configuration section has links that allow you to view the saved configurations and settings of the Exadata Storage Servers, compare configuration settings, and view configuration history. The Related Links section navigates you to screens that help accomplish other monitoring tasks.
Configuring Enterprise Manager Alerts
The Exadata Storage Server metrics will determine the health of the Storage Servers. When these metrics reach critical levels, the administrators need to be notified immediately so that the situation can be rectified in order to ensure the stability and availability of the Exadata Database Machine. You can monitor the metrics and alerts by executing CellCLI commands on the Storage Servers, or you can configure the Storage Servers to forward alerts and metrics to Enterprise Manager. Once the metrics are propagated to Enterprise Manager, you can configure alerts to be triggered, run reports on metrics, and modify thresholds, and all this is possible using the point-and-click interface of Grid Control Console.
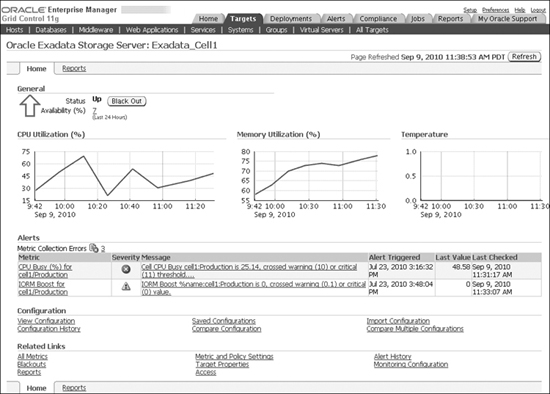
FIGURE 5-8. Home page of Enterprise Manager System Monitoring Plug-in for Exadata
In order for the Exadata Storage Server alerts to be propagated to Enterprise Manager, you would configure SNMP settings on the Storage Servers to forward alerts to the Management Agent. The Management Agent will store the alerts in the Management Repository, which enables the Enterprise Manager to further forward the alerts to administrators using the notifications and alerts policies defined in the Management Repository. This empowers the administrators to take corrective actions.
You can use the following commands to configure the Exadata Storage Servers for SNMP:
CellCLI> ALTER CELL notificationPolicy='critical,warning,clear', -
notificationMethod=SNMP -
snmpSubscriber=((host='abc.server.com',port=1234))
The snmpSubscriber attribute will specify the host and port number of the Oracle Management Agent that is monitoring the Exadata Storage Servers. The Exadata Storage Server will forward the alerts whose severity matches the one defined by the notificationPolicy. Once you are done with the SNMP setup, you can validate the setup by using the alter cell validate snmp command.
CellCLI> ALTER CELL VALIDATE SNMP
The configuration and settings of the alerts in Enterprise Manager are done in the Metric and Policy Settings page, shown in Figure 5-9. On this page, you can modify metric threshold values, edit monitoring settings for specific metrics, change metric collection schedules, and disable collection of a metric. For more information on the fields displayed in this page and how the thresholds can be modified, click Help from the top-right corner of this page.
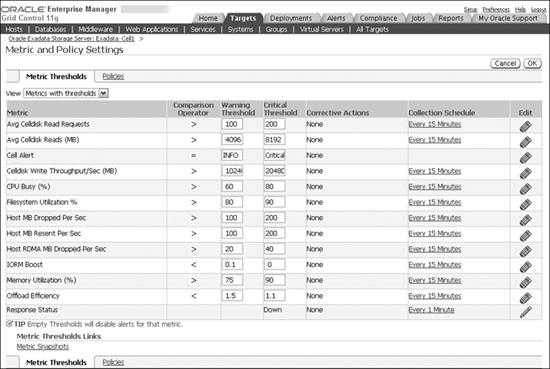
FIGURE 5-9. Configuring metric and policy settings using Enterprise Manager
Viewing Metrics and Reports
Enterprise Manager offers a comprehensive set of screens that allow you to view, modify, and report on metrics. You can view the list of the available metrics by clicking the All Metrics page. The All Metrics page of the Exadata plug-in is shown in Figure 5-10.
To access the built-in reports, click the Reports tab. The built-in reports will display the data related to the Exadata Storage Server performance and configuration, based on the data collected in the Management Repository. The reports have a Refresh icon, and clicking this icon will refresh the reports based on the data from the Management Repository, and does not get real-time data from the Exadata Storage Servers. Some of the built-in reports available in Enterprise Manager are performance reports of Exadata Storage Server components such as cell disks, grid disks, and I/O Resource Manager, as well as configuration reports of the Exadata Storage Server and the cell disks. Figure 5-11 shows a sample report.
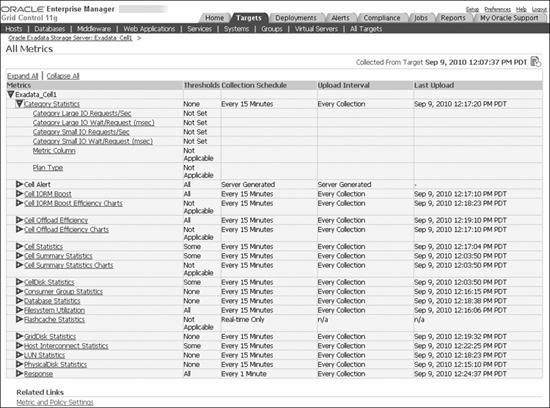
FIGURE 5-10. Enterprise Manager Plug-In for Exadata All Metrics page
Oracle Enterprise Manager Ops Center
Oracle Enterprise Manager Ops Center is a comprehensive, end-to-end, data center automation solution for managing Oracle Sun hardware, Solaris- and Linux-based operating systems, and Oracle virtualization technologies. Ops Center provides rich lifecycle management capabilities, starting from the discovery of bare-metal hardware to the provisioning and patching of operating systems and applications. Ops Center has a centralized management console that is integrated with hardware management infrastructure, such as Oracle Integrated Lights Out Manager (ILOM), for monitoring and management of hardware resources, virtualized environments, and applications.
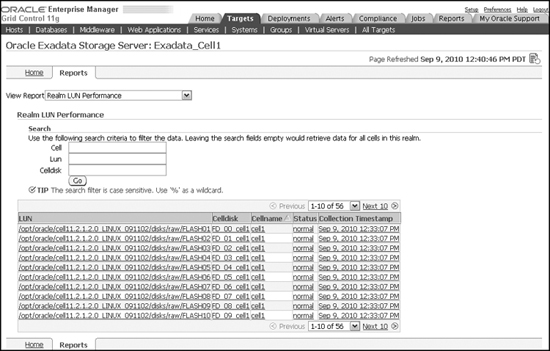
FIGURE 5-11. Sample cell performance report
Ops Center monitors the health of the operating system and the hardware resources for a variety of systems, including the Exadata Database Machine. Some of the hardware monitoring and management features of Ops Center are monitoring of hardware health status, power management and monitoring, ability to turn systems on and off, and monitoring the hardware connectivity. Ops Center also enables you to monitor the health of your Solaris, Linux, and Windows operating systems, including network connectivity, file system status, CPU usage, memory usage, and network bandwidth utilization.
Ops Center monitors certain parameters of the hardware and OS components that are of interest, and when these parameters cross predefined thresholds, notifications can be triggered. You can edit the thresholds that control how OS monitoring takes place. You can use notification profiles that trigger alerts to specific users. Refer to the Oracle Enterprise Manager Ops Center documentation for further details on managing and monitoring with Ops Center.
Oracle Enterprise Manager Ops Center Connector
If you utilize the monitoring capabilities of Ops Center within the Enterprise Manager Grid Control Console, you get the benefit of monitoring the storage, hardware, OS, and all the way up to the applications and the critical business services by using a centralized management console. This integration of Ops Center with Enterprise Manager is possible through the Oracle Management Connector for Ops Center. Using the connector, you can view consolidated information of the Exadata Database Machine servers, the network, and operating systems, within a single unified Grid Control Console.
The connector also enables the integration of alert notifications of Ops Center with Oracle Enterprise Manager. The notifications in Ops Center triggered due to Exadata Database Machine hardware component failures, or due to issues with operating system performance, or failures related to software components, will now become alerts in the Oracle Enterprise Manager. When combined with the System Monitoring Plug-in for Exadata, this capability provides a centralized platform for managing alerts, allowing you to better correlate alerts from Exadata Storage Servers with the alerts from Ops Center and accelerate the root-cause analysis when investigating issues.
Some of the other benefits of this integration are
![]() Consolidated event management of applications, database, and hardware
Consolidated event management of applications, database, and hardware
![]() Better visualization of critical issues across the technology stack for a faster resolution
Better visualization of critical issues across the technology stack for a faster resolution
The notification events occurring in the Ops Center will be forwarded by the Ops Center Management Console to the Oracle Enterprise Manager through the web services interface. Once the notifications are propagated to Oracle Enterprise Manager, they are treated as native Oracle Enterprise Manager alerts, and will utilize the built-in notifications framework and the policies that are set up in Enterprise Manager for notifying administrators of critical events occurring in the system.
The key features of the Ops Center Connector are
![]() The notifications forwarded by Ops Center to Enterprise Manager will be associated with the appropriate targets they originated from, depending on the mapping option that you select. The connector tracks the alerts forwarded from Ops Center and automatically updates the information in Enterprise Manager.
The notifications forwarded by Ops Center to Enterprise Manager will be associated with the appropriate targets they originated from, depending on the mapping option that you select. The connector tracks the alerts forwarded from Ops Center and automatically updates the information in Enterprise Manager.
![]() The alerts will be cleared from Enterprise Manager based on the properties set for notification options in the Grid Control Console.
The alerts will be cleared from Enterprise Manager based on the properties set for notification options in the Grid Control Console.
![]() The Ops Center notification severities of low and medium are mapped to the Enterprise Manager alert severity of warning, whereas the Ops Center severity of high is mapped to the Enterprise Manager alert severity of critical.
The Ops Center notification severities of low and medium are mapped to the Enterprise Manager alert severity of warning, whereas the Ops Center severity of high is mapped to the Enterprise Manager alert severity of critical.
![]() From Ops Center, you can choose the alerts that should propagate to Enterprise Manager by configuring the monitoring parameters and the user notification profile.
From Ops Center, you can choose the alerts that should propagate to Enterprise Manager by configuring the monitoring parameters and the user notification profile.
Oracle Integrated Lights Out Manager
Oracle Integrated Lights Out Manager (ILOM) is a systems management and monitoring tool that can remotely manage Oracle Sun servers, including the Exadata Storage Servers and the database servers of the Exadata Database Machine. ILOM provides a true lights-out management of the system, and can manage and monitor the system hardware independently of the state of the operating system.
The key abilities provided by ILOM are
![]() Remotely manage the power state of the systems.
Remotely manage the power state of the systems.
![]() Display the hardware configuration of the system.
Display the hardware configuration of the system.
![]() Monitor the hardware for faults and receive alerts about system events as they occur.
Monitor the hardware for faults and receive alerts about system events as they occur.
![]() Remotely access the command line and the GUI consoles of the host, and perform management functions as if you were using a locally attached keyboard, video, and mouse.
Remotely access the command line and the GUI consoles of the host, and perform management functions as if you were using a locally attached keyboard, video, and mouse.
![]() Observe the status of various system sensors and indicators.
Observe the status of various system sensors and indicators.
The architecture of ILOM consists of service processor hardware, which resides on the system board, and the management software that runs within the service processor hardware. The ILOM software and hardware comes preinstalled and preconfigured on a variety of Oracle Sun server platforms. ILOM can be integrated with other management and monitoring tools that are already installed in your data center using the SNMP interface, such as the integration with Oracle Enterprise Manager Ops Center discussed earlier. This integration will allow you to combine the provisioning and patching features of Ops Center, and extending that, to manage the system BIOS and to perform firmware updates of hardware components.
The service processor hardware of ILOM has a dedicated Ethernet port that you will use to connect with the management network of your data center. The users will access ILOM by connecting to the Ethernet IP address using the interfaces provided here:
![]() Web-based interface You can use the industry-standard web browser to log in to the web interface of ILOM and perform management and monitoring functions. The service processor hardware runs an embedded web server that is able to service requests coming from the web browser. With this capability, you can redirect the server KVM to the web browser running on a remote system. You can also share the remote system’s disk drive or CD-ROM with the server as if it was locally connected to the server that is being managed by ILOM.
Web-based interface You can use the industry-standard web browser to log in to the web interface of ILOM and perform management and monitoring functions. The service processor hardware runs an embedded web server that is able to service requests coming from the web browser. With this capability, you can redirect the server KVM to the web browser running on a remote system. You can also share the remote system’s disk drive or CD-ROM with the server as if it was locally connected to the server that is being managed by ILOM.
![]() Command-line interface (CLI) Using the CLI, you can interface with ILOM to perform operations that otherwise would be accomplished using the web browser interface. The CLI will allow you to script out your actions, which you can schedule to run without user intervention. The CLI is based on industry-standard Distributed Management Task Force Specification.
Command-line interface (CLI) Using the CLI, you can interface with ILOM to perform operations that otherwise would be accomplished using the web browser interface. The CLI will allow you to script out your actions, which you can schedule to run without user intervention. The CLI is based on industry-standard Distributed Management Task Force Specification.
![]() Intelligent Platform Management Interface (IPMI) IPMI is an industry-standard interface that will allow you to manage server hardware. Using IPMI, you can perform management and reporting of the servers, perform system monitoring, trigger alerts on exceptions, and recover systems by performing power resets. You can use the IPMITool utility to interface with ILOM and retrieve information about the server platform from the service processor hardware. The IPMITool is available on the host operating system of the server platform, or you can install it on a remote system and access the ILOM remotely.
Intelligent Platform Management Interface (IPMI) IPMI is an industry-standard interface that will allow you to manage server hardware. Using IPMI, you can perform management and reporting of the servers, perform system monitoring, trigger alerts on exceptions, and recover systems by performing power resets. You can use the IPMITool utility to interface with ILOM and retrieve information about the server platform from the service processor hardware. The IPMITool is available on the host operating system of the server platform, or you can install it on a remote system and access the ILOM remotely.
![]() SNMP interface SNMP is an industry-standard systems management protocol that is used to manage systems and devices connected over a network. SNMP consists of managed devices that will send SNMP messages via the network to the central management station. ILOM acts like a managed device and will forward SNMP messages to central management stations such as the Oracle Enterprise Manager Ops Center, and also to third-party monitoring software.
SNMP interface SNMP is an industry-standard systems management protocol that is used to manage systems and devices connected over a network. SNMP consists of managed devices that will send SNMP messages via the network to the central management station. ILOM acts like a managed device and will forward SNMP messages to central management stations such as the Oracle Enterprise Manager Ops Center, and also to third-party monitoring software.
Summary
The initial configuration of the Oracle Exadata Database Machine is typically performed by Oracle ACS upon delivery and installation. You will only need to perform routine ongoing management of its hardware and software components. The Oracle database and the Oracle Grid infrastructure components of the Database Machine are treated like any other Oracle install on a Linux or a Solaris platform, and are maintained and monitored just like you would maintain and monitor any other Oracle RAC system using ASM. The Exadata Storage Servers require minimal management since the bulk of administration tasks are performed during the initial setup phase.
The best practices of architecting the storage served by the Exadata Storage Servers are highlighted in this chapter. It is important that you understand the different ways of carving out the storage and the recommended best practices, especially when you deploy a consolidation environment and have a need to configure a shared storage grid among all workloads or a storage grid with dedicated storage pools for each workload.
The Exadata Storage Servers can be monitored using the command-line utilities such as the CellCLI and dcli, and the GUI-based Enterprise Manager Grid Control Console. You should use Enterprise Manager and utilize its unified management and reporting capabilities for managing and monitoring the Database Machine hardware, operating systems, Oracle database software, and the Exadata Storage Server Software, all in one centralized location. However, if you choose to utilize third-party monitoring software, you can integrate with the Database Machine through the SNMP interface and propagate alerts generated by the Exadata Storage Server Software, the Database Machine hardware, and even the Oracle Enterprise Manager system to the monitoring infrastructure of your choice.