Learning Informatica PowerCenter 9.x (2014)
Chapter 6. Monitoring Your Code – Using the Workflow Monitor Screen
In the previous chapter, we discussed some advanced topics on the Workflow Manager screen. Before we jump into this chapter, you now have an understanding of the various aspects of Informatica PowerCenter Designer and the Workflow Manager screen. This chapter will help you get a clear understanding about the Informatica PowerCenter Workflow Monitor screen. At this stage, you must be very clear on the basic usage of the Designer and Workflow Manager screen. We use the Workflow Monitor screen to check the status of the workflow that we executed in the Workflow Manager Screen. Apart from checking the status, the monitor screen serves various purposes, such as checking the statistics and understanding runtime details.
When you run the workflow, Workflow Monitor continuously receives information from Integration Services and other processes in order to display the information on the screen. The Workflow Monitor screen shows you the status of the workflow and the tasks being executed.
Using Workflow Monitor
The Workflow Monitor screen, as mentioned earlier, displays the status of the running workflow and tasks. It has two views to show the status—the Gantt Chart view and the Task View. You can select the view you wish to see. The Workflow Monitor screen can be seen in the following screenshot:
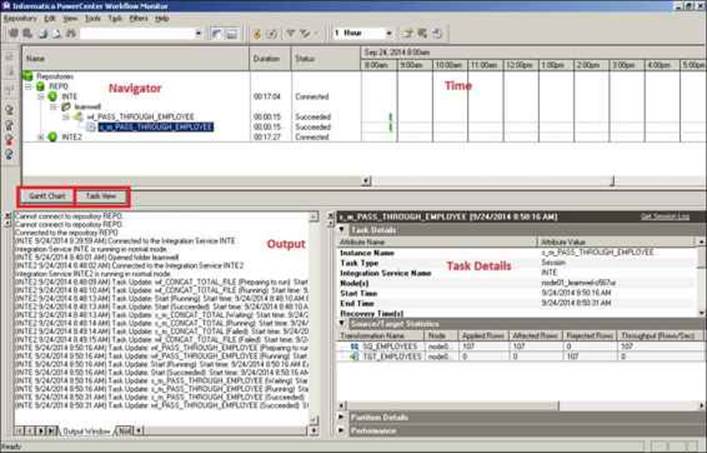
The screen is divided into the following sections:
· Navigator: This section of the screen displays various repositories, Integration Service, and the workflow names running at the instant. This section shows you all the objects that have been executed at least once.
· Output: This section displays various system-level information details received from Integration Service and repositories.
· Time: This section displays the timings of the execution of various workflows.
· Gantt Chart view: This view shows you the information of various workflow runs in a chronological order.
· Task view: This view shows you the information of various workflow runs in the report form.
· Task details: This section shows you the details of a task. It also shows you the source-to-target statistics and the performance and partition details, if selected.
Connecting to the Workflow Manager screen
When you open the Workflow Monitor screen, you need to connect to the repository and Integration Service to view the workflow and task status. You can view the Workflow Manager Screen through various ways:
· Under All Programs, navigate to Informatica 9.5.1 | Client | PowerCenter Client | PowerCenter Workflow Monitor
· From the Designer or Workflow Manager screen, click on the icon that represents Workflow Monitor (M)
Once you open the Workflow Monitor screen, perform the following steps to connect and view the workflow and task status:
1. Open the Workflow Monitor screen.
2. Right-click on the repository you wish to connect to (if you have multiple repositories available), and connect to it using the username and password. In our case, the repository is REPO.
3. Once you connect to the repository, the next step is to connect to Integration Service. This is done by right-clicking on the Integration Service you created. In our case, the Integration Service is INTE.
4. Select the workflow for which you wish to check the status. You can see the status if the workflow is executed at least once.
5. Select the view, which is Gantt Chart or the Task View, under which you wish to see the status of workflows and tasks.
Opening previous workflow runs
Apart from checking the status of the currently executing workflow, you can also check the status of the existing workflow runs in both Gantt Chart and the Task View.
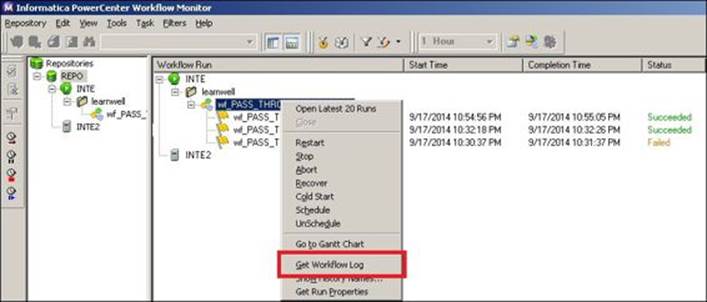
In the navigator of Workflow Monitor, select the workflow for which you wish to see previous runs. Right-click on the workflow and click on Open Latest 20 Run, as shown in the following screenshot:
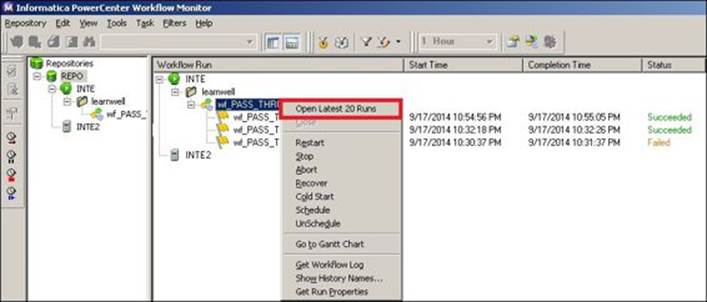
The list of latest 20 runs of the workflow will appear if available.
Running or recovering workflows or tasks
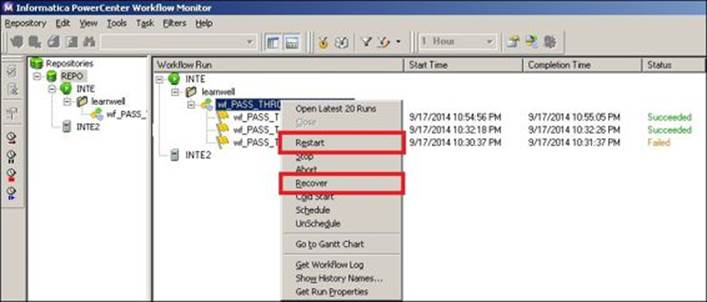
As mentioned earlier, the Workflow Monitor screen displays the workflow that is executed at least once. You can run or recover the workflow from the Workflow Monitor screen. To run or recover the workflow or task, right-click on the workflow/task in the navigator and selectRestart/Recover.
Stopping or aborting the workflow or task
You can stop or recover the workflow from the Workflow Monitor screen.
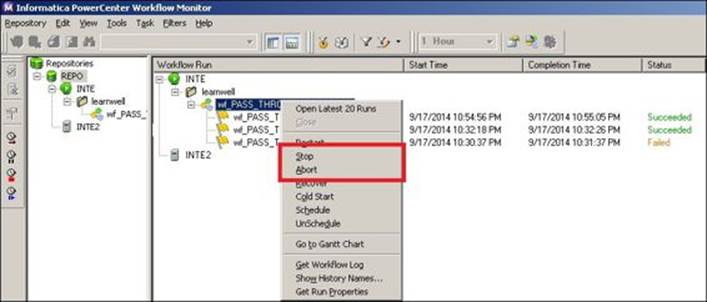
When you stop the process, Integration Service stops processing the scheduled tasks and all other processes of that workflow. However, it continues to process the currently running task. The process will stop once the current task execution is finished.
When you abort the task, it kills the DTM and hence, all the other processes get terminated. DTM in Informatica PowerCenter is called data transformation manager. This DTM does the work of managing and arranging all the prerequisites to run a session, such as checking the cache memory, checking the buffer memory, checking the table deadlock, and so on. Also, it helps generate the session log, execute pre-session and post-session SQL, and so on. To stop/abort the workflow or task, right-click on the workflow/task in the navigator and select Stop/Abort.
The status of workflows and tasks
Various statuses possible for workflows and tasks are as follows:
|
Status |
Status for Workflow/Task |
Description |
|
Succeeded |
Both |
The process is completed successfully |
|
Failed |
Both |
The process failed due to some error |
|
Running |
Both |
The process is getting executed currently |
|
Preparing to Run |
Workflow only |
The process is waiting for Integration Service to run the workflow |
|
Scheduled |
Workflow only |
The workflow is scheduled to run in the future |
|
Stopped |
Both |
The workflow has been stopped manually |
|
Stopping |
Both |
The Integration Service is in the process of stopping the workflow after manual selection |
|
Aborted |
Both |
The workflow has been aborted manually |
|
Aborting |
Both |
The Integration Service is in the process of aborting the workflow after manual selection |
|
Disabled |
Both |
You manually selected to disable the workflow or task |
|
Suspended |
Workflow only |
The workflow will show the suspended status because of the failure of the task. This status is available only if you selected Suspend on receiving an error. |
|
Suspending |
Workflow only |
The Integration Service is suspending the workflow. |
|
Terminated |
Both |
Integration Service is terminated due to some unexpected reasons. |
|
Terminating |
Both |
Integration Service is stopping, aborting, or terminating the workflow. |
|
Waiting |
Both |
Integration service is waiting for the resources that are required to execute the workflow. |
Viewing the session log and workflow log
You can view the session and workflow log from the Workflow Monitor screen. When you run the workflow, the workflow log and session logfile is saved in the form of a file at the location that you defined in the session's properties. You can maintain the history of the logfiles by adding a timestamp or by saving the session run.
To get the workflow log for the workflow, right-click on the workflow in the navigator and select Get Workflow Log.
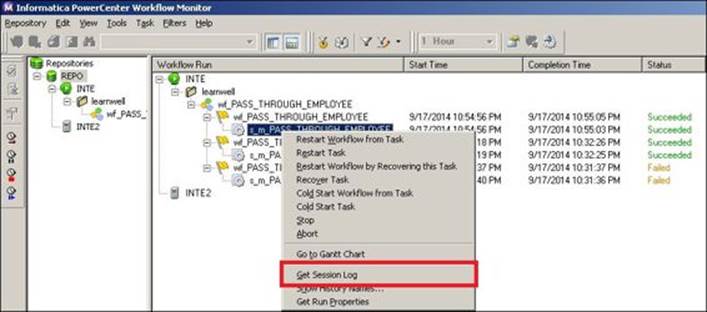
To get the session log for the workflow, right-click on the session task in the navigator and select Get Session Log.
Working with the workflow log
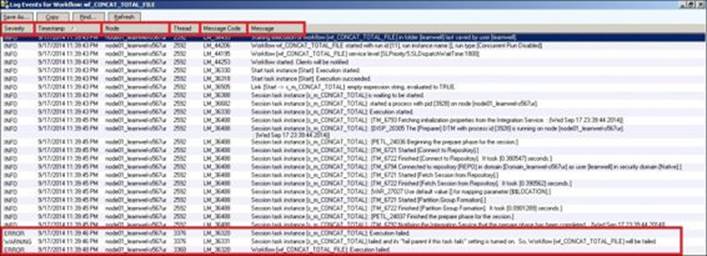
When you select to generate the workflow log, another screen opens, which shows you the details related to the workflow run. Informatica PowerCenter writes all the details related to the execution of the workflow in the log. Using the Workflow log, you can check all the system-related information that was used in executing the workflow along with the error messages if any. The following screenshot shows the workflow log:
The following table describes the various option of the workflow log:
|
Option |
Description |
|
Severity |
This shows you the status of the particular event that took place while executing the Workflow: · INFO: This indicates general system-level information · ERROR: This indicates the error that has occurred due to which the Workflow failed · WARNING: This indicates the process that was not executed as per expectations. The workflow might not fail because of warning. |
|
Timestamp |
This indicates the exact timing of the particular step that the workflow was running. |
|
Node |
This indicates the name of the node under which the workflow is executed. |
|
Thread |
This indicates the thread each step is using to execute. You can see the different threads in the session log. |
|
Message Code |
This indicates the system-defined message code. Usually in Informatica PowerCenter, we do not refer to message code. |
|
Message |
This shows you the detailed message, indicating the steps that occurred during the execution of the workflow. |
Working with the session log
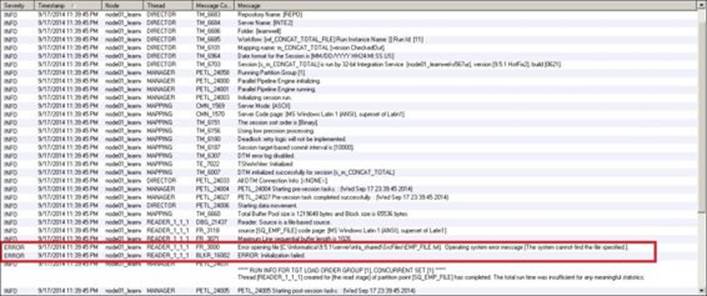
Similar to the workflow log, the session log also indicates the detailed level of information that provides you with a complete understanding of the process that occurred while the workflow was running. Session logs in Informatica give you the exact reason for the error that has occurred, using which you can debug the issue and correct the code. For example, in the following screenshot, the session log indicates the error as The system cannot find the file specified. This directly indicates that the file you wish to access does not exist. Check the details in the session task, correct the path, and your workflow will succeed.
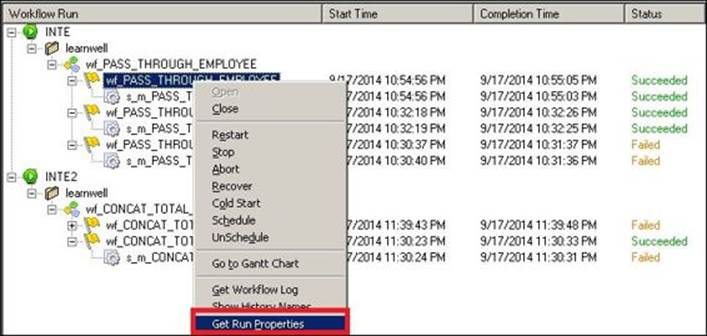
Viewing workflow run properties
Informatica PowerCenter Workflow Monitor indicates the workflow-level properties. To open the workflow run properties, right-click on the workflow and select Get Run Properties, as shown in the following screenshot:
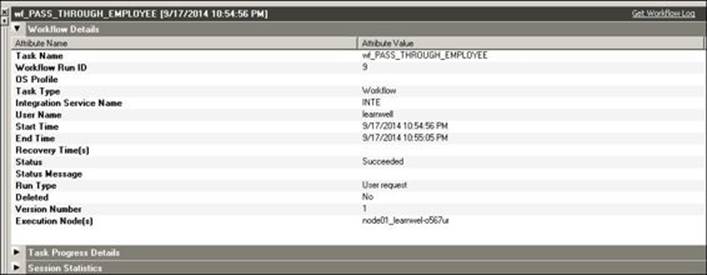
The workflow-level properties section will appear in the bottom-right section of the monitor screen, as shown in the following screenshot:
Various options under workflow run properties are as follows:
|
Properties |
Description |
|
Task Name |
This indicates the name of the workflow. |
|
Workflow Run ID |
This indicates the ID of the workflow run. |
|
OS Profile |
This indicates the name of the operating system profile assigned to the workflow. Usually, it is empty. |
|
Task Type |
This indicates the type of task. The value can be a workflow, session, and so on. In this case, the value is workflow, because we are looking at the workflow run properties. |
|
Integration Service Name |
This indicates the name of Integration Services used to run the workflow. |
|
User Name |
This indicates the name of User Services used to run the workflow. |
|
Start Time |
This indicates the start time of the workflow. |
|
End Time |
This indicates the end time of the workflow. |
|
Recovery Time(s) |
This indicates the number of times the workflow has been recovered. |
|
Status |
This indicates the status of the workflow. |
|
Status Message |
This indicates the status message of the workflow. |
|
Run Type |
This indicates the method used to execute the workflow. |
|
Deleted |
This indicates whether the workflow is deleted. The value can be yes or no. |
|
Version Number |
This indicates the version number of the workflow. |
|
Execution Node(s) |
This indicates the nodes on which the workflow is running. |
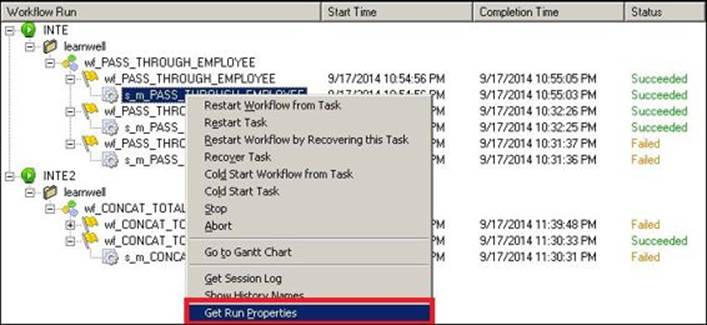
Viewing session run properties
Similar to workflow run properties, Informatica PowerCenter Workflow Monitor shows you the session-level run properties. To open the session run properties, right-click on the session and select Get Run Properties.
The session-level run properties section will appear in the bottom-right section of the monitor screen.
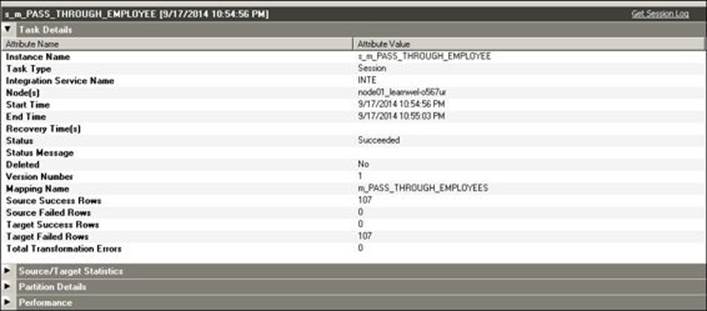
Properties of task details
Task details under session run properties are shown in the following screenshot:
The various options under Task Details of the session run properties are as follows:
|
Properties |
Description |
|
Instance Name |
This indicates the name of the session. |
|
Task Type |
This indicates the type of task. In this case, it is Session. |
|
Integration Service Name |
This indicates the name of Integration Services used to run the session. |
|
Node(s) |
This indicates the nodes on which the session is running. |
|
Start Time |
This indicates the start time of the session. |
|
End Time |
This indicates the end time of the session. |
|
Recovery Time(s) |
This indicates the number of times the session has been recovered. |
|
Status |
This indicates the status of the session task. |
|
Status Message |
This indicates the status message of the session task. |
|
Deleted |
This indicates whether the session is deleted. The value can be yes or no. |
|
Version Number |
This indicates the version number of the session task. |
|
Mapping Name |
This indicates the name of the mapping associated with the session task. |
|
Source Success Rows |
This indicates the number of records that are successfully extracted using the session task. |
|
Source Failed Rows |
This indicates the number of records that failed while extracting the data using the session task. |
|
Target Success Rows |
This indicates the number of records that were successfully loaded into the target using the session task. |
|
Target Failed Rows |
This indicates the number of records that failed to load into the target using the session task. |
|
Total Transformation Errors |
This indicates the number of transformation errors that occurred during the execution of the session task. |
Properties of source/target statistics
Source/Target-level task details under session run properties are shown in the following screenshot:
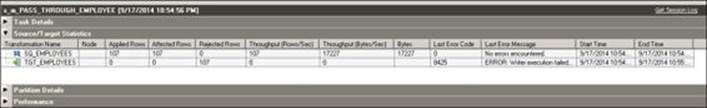
The various options under source/target statistics of session run properties are as follows:
|
Properties |
Description |
|
Transformation Name |
This indicates the name of the source qualifier or target instance name in the mapping. |
|
Node |
This indicates the nodes on which a particular transformation is running. |
|
Applied Rows |
This indicates the number of records that were successfully extracted from a source for processing or the records that are successfully loaded into the target after the processing. |
|
Affected Rows |
This indicates the number of records successfully extracted from the source or successfully loaded into the target. |
|
Rejected Rows |
This indicates the number of records rejected while extracting from the source or the number of records rejected while loading into the target. |
|
Throughput(Rows/Sec) |
This indicates the rate at which the data is extracted from the source or the rate at which data is loaded into the target. |
|
Throughput(Bytes/Sec) |
This indicates the rate at which the data is extracted from the source per second or the rate at which the data is loaded into the target per second. |
|
Bytes |
This indicates the total number of bytes transferred while extracting and loading the data. |
|
Last Error Code |
This indicates the latest error code that occurred while extracting or loading into the target. |
|
Last Error Message |
This indicates the latest error message that occurred while extracting or loading into the target. |
|
Start Time |
This indicates the start time of the extraction of data and the start time of the loading into the target. |
|
End Time |
This indicates the end time of the extraction of data and the end time of the loading into the target. |
You can also view the partitioning- and performance-level details if you configure to get them.
Common errors
When you execute the session and workflow, there are certain common errors that you might face, as follows:
· Source file not found: This indicates that the source file is not available at the specified location. Make sure that you have placed the file in the correct folder.
· Unable to generate the session log: This might be due to an invalid session task or because you may have forgotten to specify the lookup filename and path in the session task.
· Table or view not found: This indicates the database table into which you are willing to load the data that is not available. Make sure that you have created the table before you load the data into it.
· Communication link failure: This indicates whether the network issues are affecting the Integration Service or repository.
· Failed to allocate memory: This indicates whether the memory required to execute the process is available.
· Duplicate Primary/Foreign key: This indicates that you are trying to load the duplicate data in the primary key in the table.
To know more about the common errors that we come across, refer to http://docs.oracle.com/cd/E12102_01/books/AnyInstAdm784/AnyInstAdmTroubleshooting3.html for more errors.
Summary
In this chapter, we talked about various aspects of the Workflow Monitor screen. We started the chapter with a discussion on the various sections of the Workflow Monitor screen. We also saw the steps to connect to Workflow Monitor and you learned to check the status of the workflow and tasks. We checked how to restart and recover the workflow and task directly from Monitor Screen. We also checked the process to stop/abort the workflow. You learned how to check the workflow and session log. At the end of the chapter, we saw the workflow-level run properties and session-level run properties.
In the next chapter, we are going to talk about the different types of transformations available on the Informatica PowerCenter Designer screen.
All materials on the site are licensed Creative Commons Attribution-Sharealike 3.0 Unported CC BY-SA 3.0 & GNU Free Documentation License (GFDL)
If you are the copyright holder of any material contained on our site and intend to remove it, please contact our site administrator for approval.
© 2016-2026 All site design rights belong to S.Y.A.