Time Series Databases: New Ways to Store and Access Data (2014)
Chapter 2. A New World for Time Series Databases
As we saw with the old ship’s logs described in Chapter 1, time series data—tracking events or repeated measurements as a function of time—is an old idea, but one that’s now an old idea in a new world. One big change is a much larger scale for traditional types of data. Differences in the way global business and transportation are done, as well as the appearance of new sources of data, have worked together to explode the volume of data being generated. It’s not uncommon to have to deal with petabytes of data, even when carrying out traditional types of analysis and reporting. As a result, it has become harder to do the same things you used to do.
In addition to keeping up with traditional activities, you may also find yourself exposed to the lure of finding new insights through novel ways of doing data exploration and analytics, some of which need to use unstructured or semi-structured formats. One cause of the explosion in the availability of time series data is the widespread increase in reporting from sensors. You have no doubt heard the term Internet of Things (IoT), which refers to a proliferation of sensor data resulting in wide arrays of machines that report back to servers or communicate directly with each other. This mass of data offers great potential value if it is explored in clever ways.
How can you keep up with what you normally do and plus expand into new insights? Working with time series data is obviously less laborious today than it was for oceanographer Maury and his colleagues in the 19th century. It’s astounding to think that they did by hand the painstaking work required to collect and analyze a daunting amount of data in order produce accurate charts for recommended shipping routes. Just having access to modern computers, however, isn’t enough to solve the problems posed by today’s world of time series data. Looking back 10 years, the amount of data that was once collected in 10 minutes for some very active systems is now generated every second. These new challenges need different tools and approaches.
The good news is that emerging solutions based on distributed computing technologies mean that now you can not only handle traditional tasks in spite of the onslaught of increasing levels of data, but you also can afford to expand the scale and scope of what you do. These innovative technologies include Apache Cassandra and a variety of distributions of Apache Hadoop. They share the desirable characteristic of being able to scale efficiently and of being able to use less-structured data than traditional database systems. Time series data could be stored as flat files, but if you will primarily want to access the data based on a time span, storing it as a time series database is likely a good choice. A TSDB is optimized for best performance for queries based on a range of time. New NoSQL approaches make use of non-relational databases with considerable advantages in flexibility and performance over traditional relational databases (RDBMS) for this purpose. See for a general comparison of NoSQL databases with relational databases.
For the methods described in this book we recommend the Hadoop-based databases Apache HBase or MapR-DB. The latter is a non-relational database integrated directly into the file system of the MapR distribution derived from Apache Hadoop. The reason we focus on these Hadoop-based solutions is that they can not only execute rapid ingestion of time series data, but they also support rapid, efficient queries of time series databases. For the rest of this book, you should assume that whenever we say “time series database” without being more specific, we are referring to these NoSQL Hadoop-based database solutions augmented with technologies to make them work well with time series data.
NOSQL VERSUS RDBMS: WHAT’S THE DIFFERENCE, WHAT’S THE POINT?
NoSQL databases and relational databases share the same basic goals: to store and retrieve data and to coordinate changes. The difference is that NoSQL databases trade away some of the capabilities of relational databases in order to improve scalability. In particular, NoSQL databases typically have much simpler coordination capabilities than the transactions that traditional relational systems provide (or even none at all). The NoSQL databases usually eliminate all or most of SQL query language and, importantly, the complex optimizer required for SQL to be useful.
The benefits of making this trade include greater simplicity in the NoSQL database, the ability to handle semi-structured and denormalized data and, potentially, much higher scalability for the system. The drawbacks include a compensating increase in the complexity of the application and loss of the abstraction provided by the query optimizer. Losing the optimizer means that much of the optimization of queries has to be done inside the developer’s head and is frozen into the application code. Of course, losing the optimizer also can be an advantage since it allows the developer to have much more predictable performance.
Over time, the originally hard-and-fast tradeoffs involving the loss of transactions and SQL in return for the performance and scalability of the NoSQL database have become much more nuanced. New forms of transactions are becoming available in some NoSQL databases that provide much weaker guarantees than the kinds of transactions in RDBMS. In addition, modern implementations of SQL such as open source Apache Drill allow analysts and developers working with NoSQL applications to have a full SQL language capability when they choose, while retaining scalability.
Until recently, the standard approach to dealing with large-scale time series data has been to decide from the start which data to sample, to study a few weeks’ or months’ worth of the sampled data, produce the desired reports, summarize some results to be archived, and then discard most or all of the original data. Now that’s changing. There is a golden opportunity to do broader and deeper analytics, exploring data that would previously have been discarded. At modern rates of data production, even a few weeks or months is a large enough data volume that it starts to overwhelm traditional database methods. With the new scalable NoSQL platforms and tools for data storage and access, it’s now feasible to archive years of raw or lightly processed data. These much finer-grained and longer histories are especially valuable in modeling needed for predictive analytics, for anomaly detection, for back-testing new models, and in finding long-term trends and correlations.
As a result of these new options, the number of situations in which data is being collected as time series is also expanding, as is the need for extremely reliable and high-performance time series databases (the subject of this book). Remember that it’s not just a matter of asking yourself what data to save, but instead looking at when saving data as a time series database is advantageous. At very large scales, time-based queries can be implemented as large, contiguous scans that are very efficient if the data is stored appropriately in a time series database. And if the amount of data is very large, a non-relational TSDB in a NoSQL system is typically needed to provide sufficient scalability.
When considering whether to use these non-relational time series databases, remember the following considerations:
Use a non-relational TSDB when you:
§ Have huge amount of data
§ Mostly want to query based on time
The choice to use non-relational time series databases opens the door to discovery of patterns in time series data, long-term trends, and correlations between data representing different types of events. Before we move to Chapter 3, where we describe some key architectural concepts for building and accessing TSDBs, let’s first look at some examples of who uses time series data and why?
Stock Trading and Time Series Data
Time series data has long been important in the financial sector. The exact timing of events is a critical factor in the transactions made by banks and stock exchanges. We don’t have to look to the future to see very large data volumes in stock and commodity trading and the need for new solutions. Right now the extreme volume and rapid flow of data relating to bid and ask prices for stocks and commodities defines a new world for time series databases. Use cases from this sector make prime examples of the benefits of using non-relational time series databases.
What levels of data flow are we talking about? The Chicago Mercantile Exchange in the US has around 100 million live contracts and handles roughly 14 million contracts per day. This level of business results in an estimated 1.5 to 2 million messages per second. This level of volume and velocity potentially produces that many time series points as well. And there is an expected annual growth of around 33% in this market. Similarly, the New York Stock Exchange (NYSE) has over 4,000 stocks registered, but if you count related financial instruments, there are 1,000 times as many things to track. Each of these can have up to hundreds of quotes per second, and that’s just at this one exchange. Think of the combined volume of sequential time-related trade data globally each day. To save the associated time series is a daunting task, but with modern technologies and techniques, such as those described in this book, to do so becomes feasible.
Trade data arrives so quickly that even very short time frames can show a lot of activity. Figure 2-1 visualizes the pattern of price and volume fluctuations of a single stock during just one minute of trading.
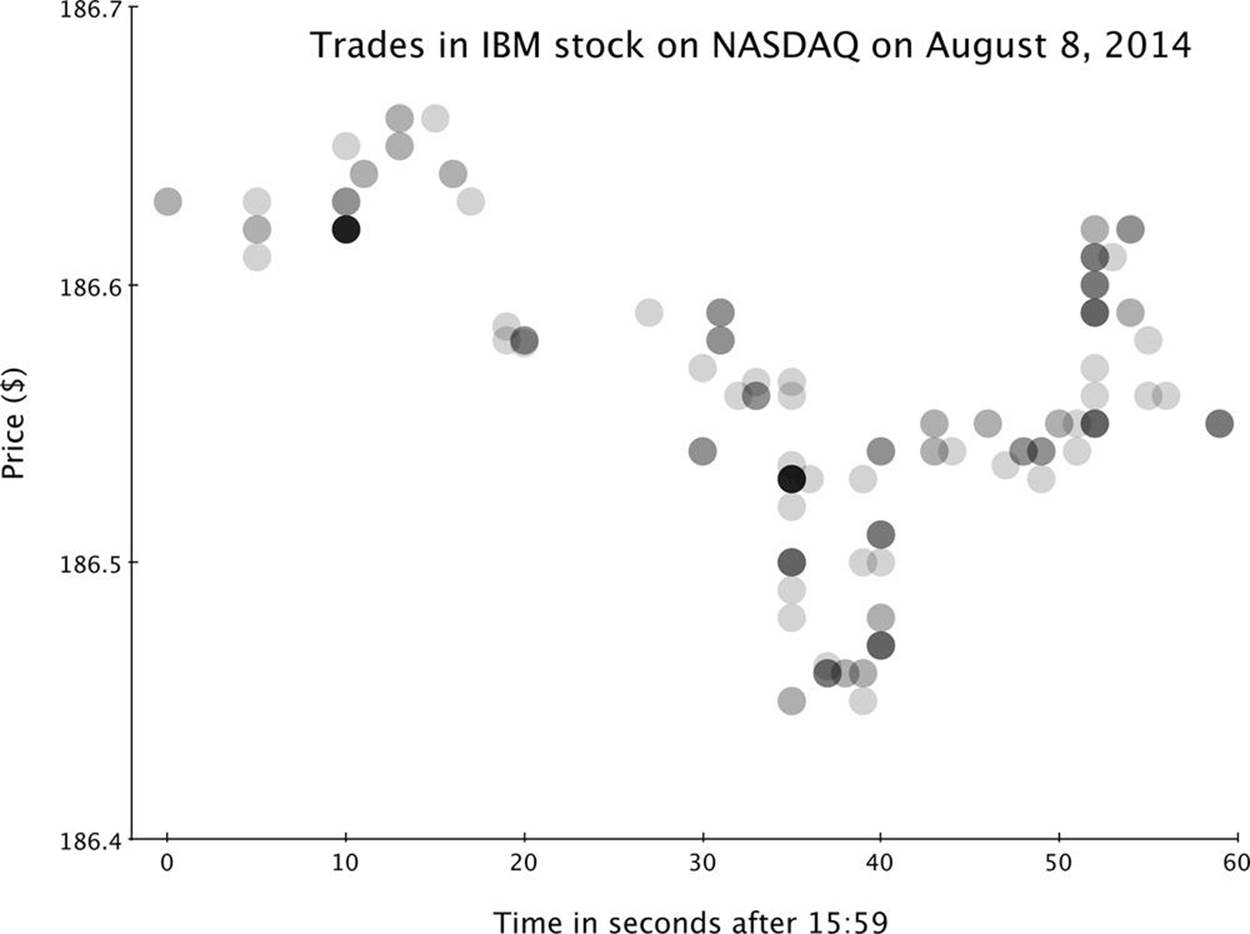
Figure 2-1. Data for the price of trades of IBM stock during the last minute of trading on one day of the NYSE. Each trade is marked with a semi-transparent dot. Darker dots represent multiple trades at the same time and price. This one stock traded more than once per second during this particular minute.
It may seem surprising to look at a very short time range in such detail, but with this high-frequency data, it is possible to see very short-term price fluctuations and to compare them to the behavior of other stocks or composite indexes. This fine-grained view becomes very important, especially in light of some computerized techniques in trading included broadly under the term “algorithmic trading.” Processes such as algorithmic trading and high-frequency trading by institutions, hedge funds, and mutual funds can carry out large-volume trades in seconds without human intervention. The visualization in Figure 2-1 is limited to one-second resolution, but the programs handling trading for many hedge funds respond on a millisecond time scale. During any single second of trading, these programs can engage each other in an elaborate back-and-forth game of bluff and call as they make bids and offers.
Some such trades are triggered by changes in trading volumes over recent time intervals. Forms of program trading represent a sizable percentage of the total volume of modern exchanges. Computer-driven high-frequency trading is estimated to account for over 50% of all trades.
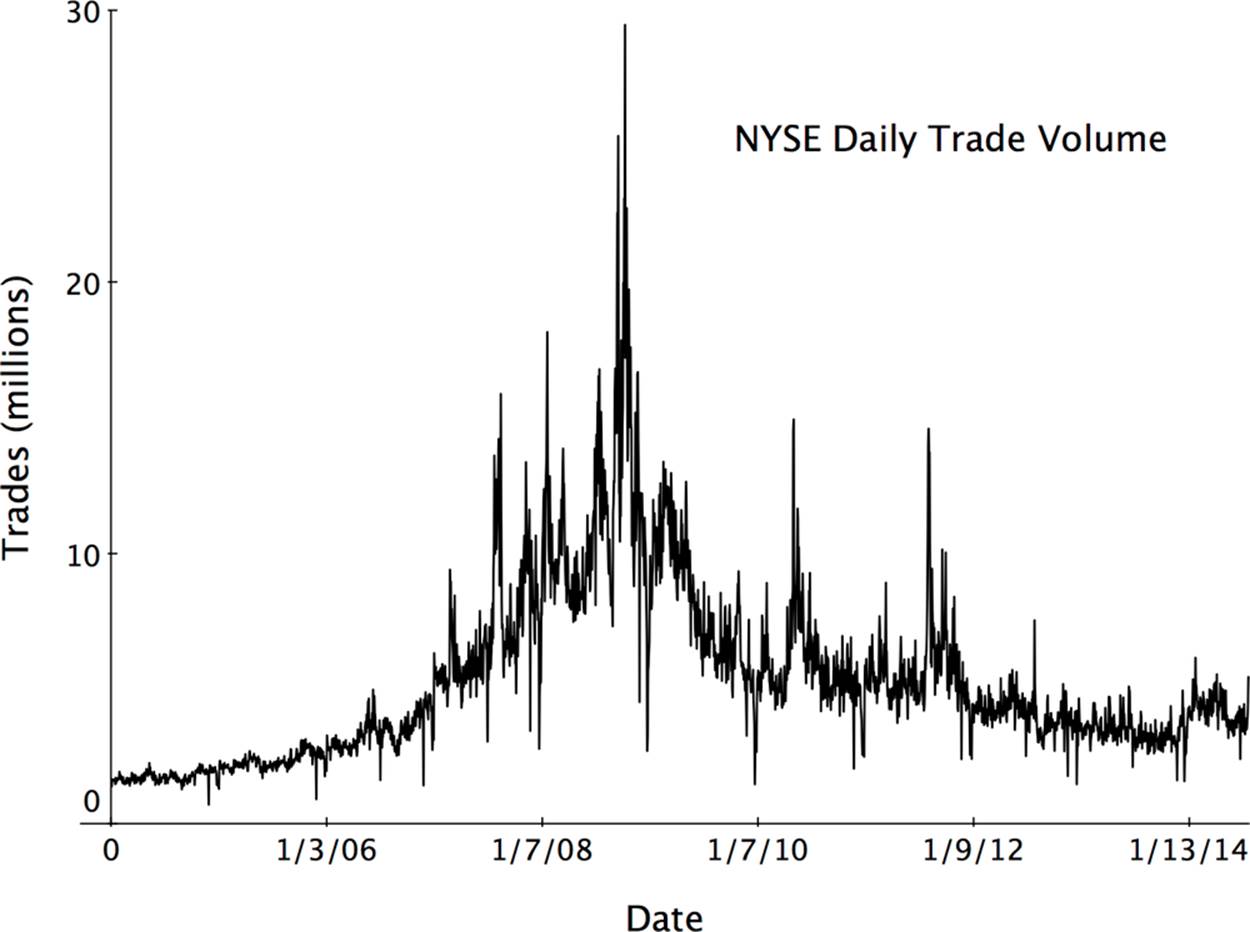
The velocity of trades and therefore the collection of trading data and the need in many cases for extremely small latency make the use of very high-performing time series databases extremely important. The time ranges of interest are extending in both directions. In addition to the very short time-range queries, long-term histories for time series data are needed, especially to discover complex trends or test strategies. Figure 2-2 shows the volume in millions of trades over a range of several years of activity at the NYSE and clearly reveals the unusual spike in volume during the financial crisis of late 2008 and 2009.
 New York Stock Exchange over a 10-year period." width="1000" height="746" border="0" />
Figure 2-2. Long-term trends such as the sharp increase in activity leading up to and during the 2008–2009 economic crisis become apparent by visualizing the trade volume data for the New York Stock Exchange over a 10-year period.
Keeping long-term histories for trades of individual stocks and for total trading volume as a function of time is very different from the old-fashioned ticker tape reporting. A ticker tape did not record the absolute timing of trades, although the order of trades was preserved. It served as a moving current window of knowledge about a stock’s price, but not as a long-term history of its behavior. In contrast, the long-term archives of trading data stored in modern TSDBs let you know exactly what happened and exactly when. This fine-grained view is important to meet government regulations for financial institutions and to be able to correlate trading behavior to other factors, including news events and sentiment analytics signals extracted from social media. These new kinds of inputs can be very valuable in predictive analytics.
Making Sense of Sensors
It’s easy to see why the availability of new and affordable technologies to store, access, and analyze time series databases expands the possibilities in many sectors for measuring a wide variety of physical parameters. One of the fastest growing areas for generating large-scale time series data is in the use of sensors, both in familiar applications and in some new and somewhat surprising uses.
In Chapter 1 we considered the wide variety of sensor measurements collected on aircraft throughout a flight. Trucking is another area in which the use of time series data from sensors is expanding. Engine parameters, speed or acceleration, and location of the truck are among the variables being recorded as a function of time for each individual truck throughout its daily run. The data collected from these measurements can be used to address some very practical and profitable questions. For example, there are potentially very large tax savings when these data are analyzed to document actual road usage by each truck in a fleet. Trucking companies generally are required to pay taxes according to how much they drive on public roads. It’s not just a matter of how many miles a truck drives; if it were, just using the record on the odometer would be sufficient. Instead, it’s a matter of knowing which miles the truck drives—in other words, how much each truck is driven on the taxable roads. Trucks actually cover many miles off of these public roads, including moving through the large loading areas of supply warehouses or traveling through the roads that run through large landfills, in the case of waste-management vehicles.
If the trucking company is able to document their analysis of the position of each truck by time as well as to the location relative to specific roads, it’s possible for the road taxes for each truck to be based on actual taxable road usage. Without this data and analysis, the taxes will be based on odometer readings, which may be much higher. Being able to accurately monitor overall engine performance is also a key economic issue in areas like Europe where vehicles may be subject to a carbon tax that varies in different jurisdictions. Without accurate records of location and engine operation, companies have to pay fees based on how much carbon they may have emitted instead of how much they actually did emit.
It’s not just trucking companies who have gotten “smart” in terms of sensor measurements. Logistics are an important aspect of running a successful retail business, so knowing exactly what is happening to each pallet of goods at different points in time is useful for tracking goods, scheduling deliveries, and monitoring warehouse status. A smart pallet can be a source of time series data that might record events of interest such as when the pallet was filled with goods, when it was loaded or unloaded from a truck, when it was transferred into storage in a warehouse, or even the environmental parameters involved, such as temperature.
Similarly, it would be possible to equip commercial waste containers, called dumpsters in the US, with sensors to report on how full they are at different points in time. Why not just peek into the dumpster to see if it needs to be emptied? That might be sufficient if it’s just a case of following the life of one dumpster, but waste-management companies in large cities must consider what is happening with hundreds of thousands of dumpsters. For shared housing such as apartments or condominiums, some cities recommend providing one dumpster for every four families, and there are dumpsters at commercial establishments such as restaurants, service stations, and shops. Periodically, the number of dumpsters at particular locations changes, such as in the case of construction sites. Seasonal fluctuations occur for both residential and commercial waste containers—think of the extra levels of trash after holidays for example.
Keeping a history of the rate of fill for individual dumpsters (a time series) can be useful in scheduling pickup routes for the large waste-management trucks that empty dumpsters. This level of management not only could improve customer service, but it also could result in fuel savings by optimizing the pattern for truck operations.
Manufacturing is another sector in which time series data from sensor measurements is extremely valuable. Quality control is a matter of constant concern in manufacturing as much today as it was in the past.
“Uncontrolled variation is the enemy of quality.”
— Attributed to Edward Deming—engineer and management guru in the late 20th century
In the quest for controlling variation, it’s a natural fit to take advantage of new capabilities to collect many sensor measurements from the equipment used in manufacturing and store them in a time series database. The exact range of movement for a mechanical arm, the temperature of an extrusion tip for a polymer flow, vibrations in an engine—the variety of measurements is very broad in this use case. One of the many goals for saving this data as a time series is to be able to correlate conditions precisely to the quality of the product being made at specific points in time.
Talking to Towers: Time Series and Telecom
Mobile cell phone usage is now ubiquitous globally, and usage levels are increasing. In many parts of the world, for example, there’s a growing dependency on mobile phones for financial transactions that take place constantly. While overall usage is increasing, there are big variations in the traffic loads on networks depending on residential population densities at different times of the day, on temporary crowds, and on special events that encourage phone use. Some of these special events are scheduled, such as the individual matches during the World Cup competition. Other special events that result in a spike in cell phone usage are not scheduled. These include earthquakes and fires or sudden political upheavals. Life events happen, and people use their phones to investigate or comment on them.
All of these situations that mean an increase in business are great news for telecommunication companies, but they also present some huge challenges in maintaining good customer service through reliable performance of the mobile networks. When in use, each mobile phone is constantly “talking” to the nearest cell phone tower, sending and receiving data. Now multiply that level of data exchange by the millions of phones in use, and you begin to see the size of the problem. Monitoring the data rates to and from cell towers is important in being able to recognize what constitutes a normal pattern of usage versus unusual fluctuations that could impair quality of service for some customers trying to share a tower. A situation that could cause this type of surge in cell phone traffic is shown in the illustration in Figure 2-3. A temporary influx of extra cell phone usage at key points during a sports event could overwhelm a network and cause poor connectivity for regular residential or commercial customers in the neighborhood. To accommodate this short-term swell in traffic, the telecom provider may be able to activate mini-towers installed near the stadium to handle the extra load. This activation can take time, and it is likely not cost-effective to use these micro-towers at low-traffic loads. Careful monitoring of the moment-to-moment patterns of usage is the basis for developing adaptive systems that respond appropriately to changes.
In order to monitor usage patterns, consider the traffic for each small geographical region nearby to a cell tower to be a separate time series. There are strong correlations between different time series during normal operation and specific patterns of correlation that arise during these flash crowd events that can be used to provide early warning. Not surprisingly, this analysis requires some pretty heavy time series lifting.
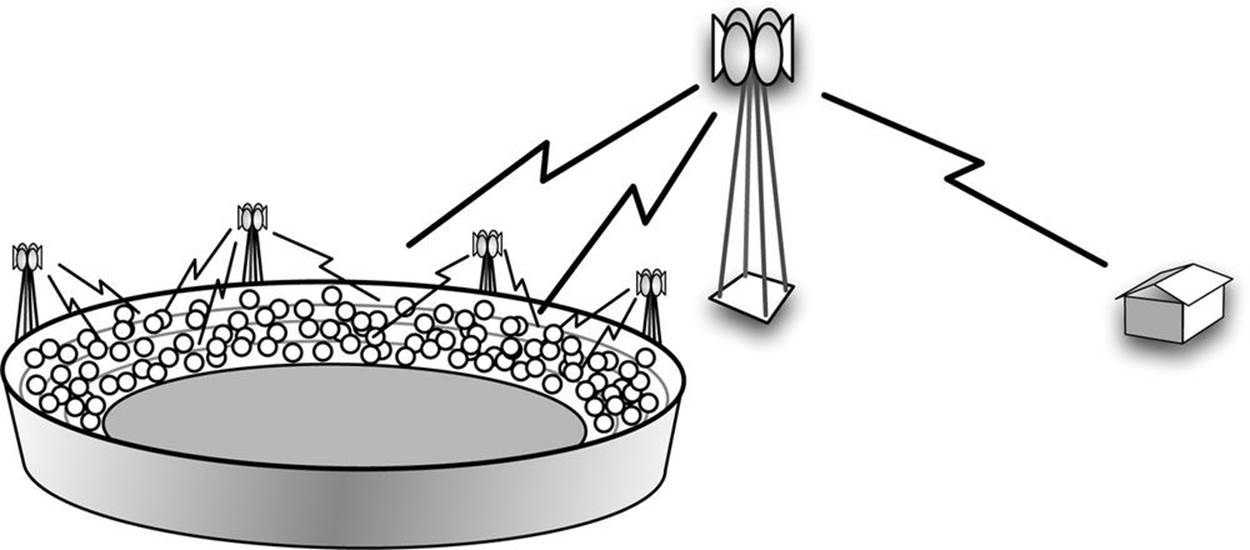
Figure 2-3. Time series databases provide an important tool in managing cell tower resources to provide consistent service for mobile phone customers despite shifting loads, such as those caused by a stadium full of people excitedly tweeting in response to a key play. Service to other customers in the area could be impaired if the large tower in this illustration is overwhelmed. When needed, auxiliary towers can be activated to accommodate the extra traffic.
Similarly, public utilities now use smart meters to report frequent measurements of energy usage at specific locations. These time series datasets can help the utility companies not only with billing, such as monitoring peak time of day usage levels, but also to redirect energy delivery relative to fluctuations in need or in response to energy generation by private solar arrays at residences or businesses. Water supply companies can also use detailed measurements of flow and pressure as a function of time to better manage their resources and customer experience.
Data Center Monitoring
Modern data centers are complex systems with a variety of operations and analytics taking place around the clock. Multiple teams need access at the same time, which requires coordination. In order to optimize resource use and manage workloads, system administrators monitor a huge number of parameters with frequent measurements for a fine-grained view. For example, data on CPU usage, memory residency, IO activity, levels of disk storage, and many other parameters are all useful to collect as time series.
Once these datasets are recorded as time series, data center operations teams can reconstruct the circumstances that lead to outages, plan upgrades by looking at trends, or even detect many kinds of security intrusion by noticing changes in the volume and patterns of data transfer between servers and the outside world.
Environmental Monitoring: Satellites, Robots, and More
The historic time series dataset for measurements of atmospheric CO2 concentrations described in Chapter 1 is just one part of the very large field of environmental monitoring that makes use of time series data. Not only do the CO2 studies continue, but similar types of long-term observations are used in various studies of meteorology and atmospheric conditions, in oceanography, and in monitoring seismic changes on land and under the ocean. Remote sensors from satellites collect huge amounts of data globally related to atmospheric humidity, wind direction, ocean currents, and temperatures, ozone concentrations in the atmosphere, and more. Satellite sensors can help scientists determine the amounts of photosynthesis taking place in the upper waters of the oceans by measuring concentrations of the light-collecting pigments such as chlorophyll.
For ocean conditions, additional readings are made from ships and from new technologies such as ocean-going robots. For example, the company Liquid Robotics headquartered in Sunnyvale, California, makes ocean-going robots known as wave gliders. There are several models, but the wave glider is basically an unmanned platform that carries a wide variety of equipment for measuring various ocean conditions. The ocean data collectors are powered by solar panels on the wave gliders, but the wave gliders themselves are propelled by wave energy. These self-propelled robotic sensors are not much bigger than a surfboard, and yet they have been able to travel from San Francisco to Hawaii and on to Japan and Australia, making measurements all along the way. They have even survived tropical storms and shark attacks. The amount of data they collect is staggering, and more and more of them are being launched.
Another new company involved in environmental monitoring also headquartered in Sunnyvale is Planet OS. They are a data aggregation company that uses data from satellites, in-situ instruments, HF radar, sonar, and more. Their sophisticated data handling includes very complicated time series databases related to a wide range of sensor data. These examples are just a few among the many projects involved in collecting environmental data to build highly detailed, global, long-term views of our planet.
The Questions to Be Asked
The time series data use cases described in this chapter just touch on a few key areas in which time series databases are important solutions. The best description of where time series data is of use is practically everywhere measurements are made. Thanks to new technologies to store and access large-scale time series data in a cost-effective way, time series data is becoming ubiquitous. The volume of data from use cases in which time series data has traditionally been important is expanding, and as people learn about the new tools available to handle data at scale, they are also considering the value of collecting data as a function of time in new situations as well.
With these changes in mind, it’s helpful to step back and look in a more general way at some of the types of questions being addressed effectively by time series data. Here’s a short list of some of the categories:
1. What are the short- and long-term trends for some measurement or ensemble of measurements? (prognostication)
2. How do several measurements correlate over a period of time? (introspection)
3. How do I build a machine-learning model based on the temporal behavior of many measurements correlated to externally known facts? (prediction)
4. Have similar patterns of measurements preceded similar events? (introspection)
5. What measurements might indicate the cause of some event, such as a failure? (diagnosis)
Now that you have an idea of some of the ways in which people are using large-scale time series data, we will turn to the details of how best to store and access it.
All materials on the site are licensed Creative Commons Attribution-Sharealike 3.0 Unported CC BY-SA 3.0 & GNU Free Documentation License (GFDL)
If you are the copyright holder of any material contained on our site and intend to remove it, please contact our site administrator for approval.
© 2016-2026 All site design rights belong to S.Y.A.