Android Programming: Pushing the Limits (2014)
Part I. Building a Better Foundation
Chapter 1. Fine-Tuning Your Development Environment
Depending on what you’re developing, you have different choices when it comes to the tools you can use.
Your requirements on the development environment differs if you’re writing an HTML5 application or if you’re
developing a server-side application in Java. Some platforms offer more choice than others, and as I describe
next, developing Android applications gives you a lot of choice for your development environment.
I begin this chapter with some more advanced internals of the Android SDK and how you can use them in
your daily development and how they can assist you in improving the quality of your application. I continue
by describing how to structure your code projects in an optimal way for reuse by using library projects. You
also learn how to take version control to a new level by integrating Git with a code-review tool called Gerrit.
As a developer, you will spend most of your time using the IDE tool. While the Eclipse IDE is still supported by
Google, they are now pushing developers to use their new Android Studio IDE for all Android projects. So, I give
an introduction to Android Studio as well as to the new build system called Gradle. Finally, I go through the
developer settings that are available on Android devices.
Operating Systems for Android Development
This is probably the one topic you don’t have to worry about. Either you can pick the operating system on
your computer used for development, or it is limited by the IT-policies of your employer. For most Android
developers, any of the officially supported operating systems works fine. However, there are situations where
the choice will matter.
Google supports Windows, Linux, and OS X for developing Android applications. Although Windows is officially
supported by the Android SDK, you’ll have problems if you decide to do advanced development, especially
when it comes to writing native applications or building your own custom ROM. The best choice is either Linux
or OS X. If possible, try to have one of these as your primary operating system, and you’ll run into far fewer
problems. Another reason for avoiding Windows on your Android development environment is that you won’t
need to install new USB drivers for every Android device you work on.
Advanced Android SDK Tools
After you have your operating system and the required (and recommended) tools installed on your computer,
you can focus on the Android SDK. You will find the download for your operating system and the latest
installation instructions at http://developer.android.com/sdk. Android Studio comes with an SDK
bundle that is completely managed from within the IDE, but if you prefer to have a standalone version you can
download that as well.
Make sure that you always keep the SDK up to date and that you download the APIs for all the Android versions
that you’re developing for. The easiest way to update your standalone Android SDK is to run the update tool
from the command prompt:
$ android update sdk --no-ui
Inside the Android SDK folder, you will find a number of subfolders. From a tools perspective, only the
platform-tools and tools folders are of interest for now. I will introduce some of these tools and explain
how to use them, starting with the adb (Android Debug Bridge) tool. If you are frequently using the command
line tools in the Android SDK I recommend that you add the path to these folders in your local PATH variable.
You can find the official documentation for most of the tools in the Android SDK at http://
developer.android.com/tools/help/index.html.
The adb Tool
In the platform-tools folder, you will find the adb tool that is used to communicate with your device to
install and start apps during development. In earlier versions of the Android SDK, this tool was found in the
tools directory, but it has since been moved. Besides being used for installing, starting, and debugging
applications from your IDE, the adb tool enables you to manually call many of the low-level operations on your
Android device for debugging purposes. To list all the commands available, simply type adb help all in
your terminal (Linux or Mac OS X) or command prompt (Windows).
Some common adb commands are
■ adb devices—List all connected Android devices and Emulators.
■ adb push <local> <remote>—Copy a file from your computer to a device (usually on the SD card).
■ adb pull <remote> <local>—Copy a file from the device to your computer.
adb and Multiple Devices
If you ever need to develop and debug an application for two or more devices simultaneously, such as for a
multiplayer game or an instant-message application, adb needs an additional argument to know which device
you want to address. You do so by adding –s <serial number> as the first parameter to adb. You can see
the serial number for your connected devices by executing the adb devices command. To run the logcat
command on a specific device, run the following:
$ adb devices
List of devices attached
0070015947d30e4b device
015d2856b8300a10 device
$ adb –s 015d2856b8300a10 logcat
When you have multiple devices connected or emulators started a dialog box will appear when you
launch your application in your IDE.
Mastering Logcat Filtering
Logging is an important part of Android application development. Although using breakpoints and a debugger
from your IDE is extremely powerful when you want to follow the execution flow and inspect the values and
state of different variables, simply reading the output from logcat can sometimes be more efficient. Android
logging is handled by the logcat function, which is usually integrated in your IDE but can also be called via
the adb command.
Because Android outputs all system and application log messages to the same stream, it can become quite
complicated to find the messages that relate to your application. Luckily, there are some easy ways to filter the
logs, as I show in the following code.
Android log messages are prepended with a tag and a priority. Usually, you declare a separate log tag for each
class in your application like this:
private static final String TAG = “MyActivity”;
You can then use this tag when printing a log message somewhere in the code for that class:
Log.d(TAG, “Current value of moderation: “ + moderation);
To filter out all log messages except those that have MyActivity as the value for the tag, you can execute
logcat as follows.
$ adb logcat MyActivity:* *:S
The parameters after logcat are the filters you want to apply. They are formatted as <tag>:<priority>
where an asterisk (*) indicates all possible values. One important thing that can easily be missed is that you
must include the special filter *:S, which tells logcat to silence all messages. In combination with your own
filters, you can easily control logcat to print only the messages you want to see.
If you use filters when viewing the logcat output, I also recommend adding AndroidRuntime:*. This will
show you relevant information from the Android system as well as exceptions that are generated by your
application but caught by the platform.
Connecting adb over Wi-Fi
Usually, you connect to your Android device using a USB cable plugged into your computer. However, you can
also connect to an Android device over Wi-Fi using a standard TCP/IP connection. This can be very useful when
developing applications that are listening for events related to USB (since then the normal connection to your
computer will interfere), like connected/disconnected or when you simply don’t want to bother with USB cables
during development.
In order to enable adb connection over Wi-Fi, you first need to plug your device into your computer using USB as
you normally do. Also, make sure your computer and your Android device are connected to the same Wi-Fi. You also
need to know the IP address of your Android device, which you can find on your device by choosing Settings➪
Wi-Fi➪Advanced. In the bottom of the list that appears you will find your device IP address for the current Wi-Fi.
After you have this set up correctly, run the following commands from your terminal:
$ adb devices
List of devices attached
0070015947d30e4b device
$ adb tcpip 5555
$ adb connect 192.168.1.104
$ adb devices
List of devices attached
192.168.1.104:5555 device
The first command is just to verify that your device is connected in debugging mode. The second command tells
the device to restart the adb daemon on the device in TCP/IP mode and listen on port 5555 (the default port for
adb). The third command tells the adb Service on your computer to connect to the IP address (using default
port 5555) of the device. Finally, the fourth command verifies that the computer is connected to the device over
TCP/IP. You can now unplug the USB cable from your device and start developing with your IDE as usual.
The device will keep the adb daemon in TCP/IP mode until it is restarted or until you run the command adb
usb, which restarts the adb daemon in USB mode.
Connecting adb over WiFi is not guaranteed to work on all devices. Also, the communication
performance with the device is much worse, which can be annoying when you need to deploy a large
application.
Executing Commands on an Android Device
Because an Android system is basically a custom Linux distribution, you can interact with it in much the same
way as you can with Linux on your PC. By running a special adb command, you can start a standard Linux-shell
on your Android device that lets you perform command-line operations in the same way as you do on your
other Linux installations as shown here.
$ adb shell
When running a shell on your Android device, two useful commands are am and pm. These commands aren’t
related to the time of day; instead, they enable you to interact with the Application and Package Managers,
respectively, which can be useful during early development and testing. For instance, if you’re implementing a
Service that will be started by some externally triggered Intent, you can manually send this Intent using
the am command.
To start a Service using an Intent action, simply type the following on the command line:
$ adb shell am startservice –a <intent action>
You can add parameters for extras and even specify a certain component name. In addition to startservice,
you can launch an Activity or send a broadcast Intent. Calling adb shell am without additional
parameters will display a full list of possible commands. You will find that this command is especially
useful when you start developing an Android application and need to test a Service before you create
the Activity that will launch it. Also, it’s useful for simulating Intents that will be launched by other
applications, such as ACTION_VIEW or ACTION_SEND.
The Package Manager is a central Android component that manages the installed applications on a device.
You can control use of the pm command in a similar way to how you work with the Application Manager.
The Package Manager lets you interact with the installed applications (packages), allowing you to list, install,
uninstall, and inspect the features and permissions on the device. Although the pm command isn’t as useful
during development as the am command, it can sometimes be helpful if you want to find out details about the
device that are otherwise a bit complicated to discover. For instance, if you want to list all the installed packages
(that is, installed apps), you can type the following:
$ adb shell pm list packages
In addition to the adb commands just covered, there are many others you need to be familiar with. If you
haven’t done so already, take some time to experiment with the adb commands.
You can find a list of adb commands and their uses at http://developer.android.com/
tools/help/adb.html.
Stress-Testing an Application’s UI with Monkey
Most developers often consider testing a tedious and boring task, and Android developers are probably no
exception. A good developer handles testing by writing automated tests that verify parts of the code in the
application when running on the device. You can also find code inspection tools that search for common
coding mistakes (you’ll look at one of these in the section “Static Code Analysis with Lint,” later in this chapter).
However, as much as you might wish, writing automated tests and performing static code analysis is never
100% foolproof. A user doesn’t behave according to a certain pattern all the time. Users can click a button at
an unexpected moment or accidentally click the wrong button, which can cause your application to crash. You
basically need something that behaves like a user would, or better yet, like a monkey would!
The Android SDK comes with a powerful tool called the Application Exerciser Monkey, or simply, Monkey . This
is a command-line tool that allows you to generate pseudo-random user events like touches or system events
on a device. The purpose is to stress test your application by simulating what a user could do. Although Monkey
doesn’t simulate a typical use-case scenario for your application, it provides valuable feedback on how your
application will work if the user interacts with your user interface in an unpredictable way.
The following command executes the Monkey tool on an application with the specific <package name> and
injects as many random events as specified by <event count>.
$ adb shell monkey –p < package name> < event count>
The default behavior for Monkey is to stop when an unhandled exception occurs and to report the error. This
behavior is useful for finding things like unexpected NullPointerExceptions or similar issues in your
code. You can fine-tune the behavior through various parameters and tell Monkey to halt only if, for instance, a
security exception occurs.
Scripting Monkey with Monkeyrunner
A more advanced way of executing Monkey on your application is by writing a Python script that uses the
Monkeyrunner API. This can be very useful in a continuous development environment where you want to run
the Monkey tool and perform other actions as well. It also allows you to provide input values for keystrokes and
capture screen shots programmatically that can be compared (also using the Monkeyrunner API) to a set of
screen shots known to be correct.
For a team of Android developers, this can prove to be a huge advantage because it provides a robust
regression-testing solution with very little effort. Even small changes to your code can sometimes provide
unexpected results that can be very difficult to detect when you’re the only person testing the application
before release. Using the Monkey tool, and preferably building Monkeyrunner scripts for regression testing, is
highly recommended before publishing your application.
You can find the API for the Monkeyrunner at http://developer.android.com/tools/help/
monkeyrunner_concepts.html#APIClasses
The Gradle Build System for Android
With the release of Android Studio, Google also introduced a new modular build system that replaces the old
Ant scripts that were generated by the older versions of the SDK. When you create a new project in Android
Studio, it will also create all the Gradle scripts for your project.
Gradle is a modular build system similar to Ivy and Maven. It combines the flexibility of Ant with the
dependency management from Maven. Instead of writing build-scripts in complex XML-files, Gradle has its own
Groovy DSL (Domain-Specific Language) that allows you to express more clearly your build configuration.
The following code is the default build.gradle file that is generated for new projects. The first block tells
gradle which repository to download plug-ins and dependencies for the build. (This is not the same as the
dependencies for your project, which is defined in a later block.) The next part tells Gradle to apply a plug-
in, in this case the Android plug-in, which enables the specifics for Android development. Next come the
dependencies for your project, in this case only the support library that is located in the libs directory of your
project. The final block, starting with android, specifies the configuration for your project.
buildscript {
repositories {
maven { url ‘http://repo1.maven.org/maven2’ }
}
dependencies {
classpath ‘com.android.tools.build:gradle:0.5+’
}
}
apply plugin: ‘android’
dependencies {
compile files(‘libs/android-support-v4.jar’)
}
android {
compileSdkVersion 18
buildToolsVersion “18.0.0”
defaultConfig {
minSdkVersion 18
targetSdkVersion 18
}
}
The user guide for the new Gradle build system can be found at http://tools.android.com/
tech-docs/new-build-system/user-guide.
The default directory structure for an Android project using the new build system is slightly different from what
you may be used to. Instead of having a flat structure, there are two main source sets: source code and test
sources. They are in the following directories:
src/main/
src/instrumentTest/
Under the main directory the Java source code is placed in the java and resources are placed in the res
directory. The AndroidManifest.xml file is located directly in the main directory (see Figure 1-1).
The other directories for project files are assets (for binary assets), aidl (for Android IDLs), rs (RenderScript
sources) and jni (native C/C++ code).
While building and running your project is supported directly in the Android Studio IDE, you can interact with
the build system through the command line as well. Gradle defines a number of tasks and to list all available
tasks, simply type the following from the root of your Android project.
$ ./gradlew tasks
If you, for instance, want to build the application from scratch you would run the following.
$ ./gradlew clean build
This will execute first the clean task, followed by the build task.
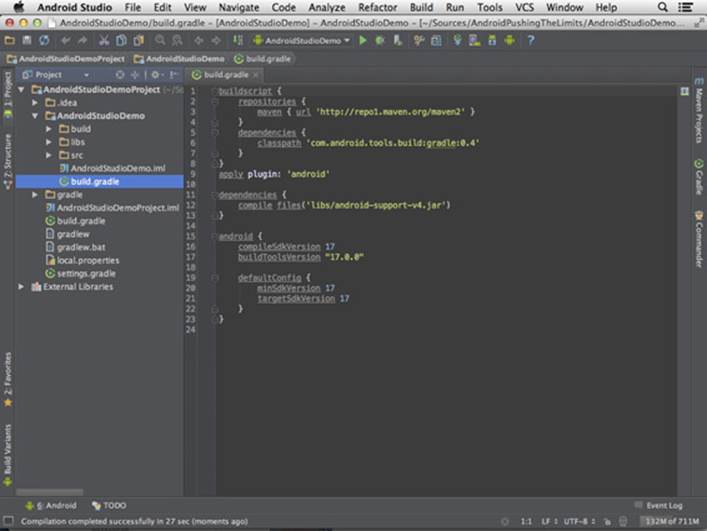
Figure 1-1: The directory structure and Gradle build file shown in the Android Studio IDE
Migrating Existing Projects to Gradle
Since most existing Android projects are not using the Gradle build system, a migration guide might be in
order. The easiest way to migrate is to create a new Android project using Android Studio. Then, copy your own
project to a sub-folder in the new project.
Next, take the build.gradle file for the application created by Android studio and copy it to the root of your
own application.
android {
sourceSets {
main {
manifest.srcFile ‘AndroidManifest.xml’
java.srcDirs = [‘src’]
resources.srcDirs = [‘src’]
aidl.srcDirs = [‘src’]
renderscript.srcDirs = [‘src’]
res.srcDirs = [‘res’]
assets.srcDirs = [‘assets’]
}
}
}
Edit the android section of the file so that it looks like the previous example. This should work well for
all existing Android projects that follow the old standard directory structure. If your project has a different
structure, simply change the paths from the previous example. (Note that all paths are relative.)
Optimize and Obfuscate with ProGuard
An Android application is the compiled result from your Java, XML, and other resource files. The Java code is
compiled into a binary format called dex, which is what the Dalvik virtual machine on Android reads when
executing your code. This format is not designed to be human-readable, tools are available for decompiling a
dex file back to a human-readable format.
In some cases, decompiling the code can be a security issue—for instance, when your code contains keys or
other values that should not be easily accessible (such as integration with Licensing Server). Although it isn’t
possible to completely prevent decompilation of your code, you can make it much more difficult by obfuscating
it before you publish it. This method will make reverse engineering much more time-consuming and hopefully
discourage hacking attempts on your application.
You obfuscate your code for Android by using the ProGuard tool that’s integrated in the Android SDK. The tool
is supported by the Gradle build system, and all you need to do is to add the following to the android section in
build.gradle.
buildTypes {
release {
runProguard true
proguardFile getDefaultProguardFile(‘proguard-android.txt’)
}
}
This will enable ProGuard to be applied to the release-build of your application. During normal development
this step is excluded.
Another reason to obfuscate your code is that doing so performs some additional optimizations, as well as
shrinking the resulting dex binary by removing unused code. This is especially useful when you’ve included a
large third-party library, because it can significantly reduce the final file size and memory usage during runtime.
Android Library Projects and Third-Party Libraries
Developers tend to write the same code over and over for new applications, which is why we create code
libraries that can be reused in the next project. The result is a faster development cycle because there’s less code
to write and test.
Android offers you two ways to reuse code among your application projects: by using either a precompiled
JAR file or a library project. The first method is preferable when you’re dealing with third-party code that you
don’t control or when you have a stable and complete set of library functions that won’t change during the
current project. The second method, using a library project, is useful if you’re developing multiple applications
in the same project that will share some code—for example, when you’ve decided to create one application
for smartphones and one for tablets, or when you have two different applications that will communicate (for
example, client and server).
Precompiled JAR Libraries
Using a precompiled JAR file in your Android project is very simple. Simply copy the file to the libs directory in
your project folder and then add it as a library within your IDE. The code in the JAR file will be available directly,
and when you build the application, the Android tool chain will automatically include and package the included
classes. If you’re obfuscating your application code with ProGuard, all included JAR files will be processed as
well. This is especially useful when you’re including large third-party libraries where you use only part of the
classes it provides. To include a local JAR file as a dependency to your project, simply add it to the dependency
section in build.gradle like this:
dependencies {
compile files(‘libs/android-support-v4.jar’)
}
Another way of doing this is by using a remote dependency repository, such as the central Maven repository.
To enable this and include a third-party library found in that repository, you update your build.gradle as
follows:
repositories {
mavenCentral()
}
dependencies {
compile ‘com.google.code.gson:gson:2.2.4’
}
The string in the dependencies section is an identifier for a specific version of a library. The call to
mavenCentral() will configure your build environment with the correct Maven settings.
To search for third-party libraries you can use the Maven search site at http://search.maven.
org/. Once you’ve found the right library, simply click on the version and copy the identifier
string from the Grails section. Note that not all libraries found on the central Maven repository are
supported on Android. Refer to the documentation first.
Setting Up a Library Project
An Android library project is basically a standard Android project that doesn’t declare any components that can
be started (Activities, Services, BroadcastReceivers, or ContentProviders) and that won’t
generate an APK when compiled or exported. The library’s sole purpose is to be shared by multiple application
projects so that you don’t have to copy the same code between them, which is very useful for sharing constants,
utility functions, common custom views, and other components. Because you’re dealing with the actual code and
not a precompiled JAR file, the code can be changed, which will affect all the applications that include this library.
Because Android development uses the Java programming language, using a library project to share code
between an Android application and a server-side component written in Java (for instance, a Java Enterprise
application) can be especially useful. Common code to share in such a setup is the class representation of the
shared data and how to serialize and deserialize objects of these classes.
The Android SDK comes with a number of ready-to-use library projects that can be found under extras/
google in the SDK folder. More specifically, you can find library projects for the Play Services, APK extensions,
In-app Billing and Licensing features. To use these, you simply have to import them into your IDE and add a
dependency to your own project. Note: You can refer to multiple library projects in one application project.
You can set up a library project from the Android Studio IDE. Simply create a new module and choose Android
Library as the module type. A gradle.build will be generated for the new library project as shown next.
buildscript {
repositories {
maven { url ‘http://repo1.maven.org/maven2’ }
}
dependencies {
classpath ‘com.android.tools.build:gradle:0.4’
}
}
apply plugin: ‘android-library’
dependencies {
compile files(‘libs/android-support-v4.jar’)
}
android {
compileSdkVersion 17
buildToolsVersion “17.0.0”
defaultConfig {
minSdkVersion 7
targetSdkVersion 16
}
}
Note that the only difference from the default build file for Android project is the use of the plug-in android-
library instead of android.
To include a library project in your application’s build configuration, you simply refer to it as a dependency as
shown in the following.
dependencies {
compile project(‘:libraries:MyLibrary’)
}
Version Control and Source Code Management
Chances are that most development projects you’ll work on will involve other developers. A development
team usually comprises four to eight people, all working on the same code in parallel. Although the team could
decide who will make the changes for every file, it’s much more practical to apply a version control system to the
project files that supports a parallel method for development. Another benefit of a version control system is
that you can track changes back in time (who made what changes and when in a specific part of a file) and then
merge changes from different developers into the same file.
One of the most common version control systems used today is Git, and it’s also the system used to manage the
source code of both the Android Open Source Project and the Linux kernel. Git is a distributed version control
system that allows a developer to work independently from other developers. After the developer completes
the changes to the source code for a certain feature, he can push the changes to a server where the other
developers can retrieve it.
You can read more about Git and download it for various platforms at http://git-scm.com. For
a deeper introduction to Git and version control, I recommend the book, Version Control with Git (see
the “Further Resources” section at the end of this chapter).
A great feature with Git is that you don’t need a server in order to use it, which makes it suitable for all types of
projects, from projects where you’re the only developer to projects consisting of multiple teams. I recommend
that you always initiate a new Git repository for every new Android application you start developing. Although
you can perform all Git operations from your IDE, it’s always good to be able to use the command-line tool as
well. The example that follows shows how to initialize a new Git repository:
$ git init <path to project directory>
Initialized empty Git repository in <path to project directory> ./git
After you set up a Git repository for your project, you can start to add and commit changes. Usually, you
perform these operations through your IDE, but if you want, you can also perform the add and commit
commands from the command line. If you’re new to Git, I recommend that you take a tutorial before you start
using it.
Git becomes really powerful when a team of developers needs to work together on the same source code. The
team should set up a remote Git repository to which all the team members can synchronize their changes. The
easiest way to do so is either to set up a gitolite server, which is dedicated server software that provides remote
access to Git repositories, or to use a ready-made hosting solution like GitHub for remote Git repositories.
Gitolite allows you to set up your own server for hosting Git repositories, as well as define fine-grained access
control. If you need full control of your source code management or aren’t able to store your source code
outside the company network, gitolite is your best choice.
You can find the documentation and download for gitolite at http://gitolite.com/gitolite.
An excellent quick installation guide can be found at http://gitolite.com/gitolite/
qi.html.
GitHub is a web-based hosting service for development projects that use Git. This online service provides both
a free and a paid service for individuals and businesses. The great thing about GitHub is that it provides an easy
way to share code with anyone on the Internet. If you want to be able to access your central repository when
outside the office or share your code as open source, then GitHub is a good choice.
Read more about GitHub at http://github.com.
Regardless of the size of your project, version control is very important. Even if you’re making only a small
prototype or test app, it’s good practice to always set up a Git repository. When you can track the history of your
code, you not only have the ability to track your changes efficiently but also the ability to understand why a
change occurred, because each commit will contain a message describing it. Take the little extra time required
to set up version control every time you start a project. Doing so will pay off.
Many developers working with software code will find one more very useful “tool” related to version control:
namely, two pairs of eyes inspecting the work, rather than just one, because developers working alone can
easily miss their own mistakes. This is why code reviewing is such a powerful technique when it comes to
improving the quality of your code. The problem with code reviewing is that it has often taken a lot of effort.
Fortunately, there are now excellent tools to support code review, and one of the best is Gerrit.
Gerrit’s two main advantages are that it integrates with Git perfectly and it’s completely web-based. Gerrit is
also the same code-review tool used for the Android Open Source Project. The basic idea with Gerrit is that a
developer pushes a change up the main repository. Before the change gets merged to the main branch, Gerrit
sends a notification to all project members that have “subscribed” for these changes, letting them know that there
is something new to review. Each reviewer can then compare the change with the previous commit and give the
change a ranking and a comment, indicating if something should be fixed or if it looks okay. If something needs
to be fixed, the original developer can push up another update that gets tracked by Gerrit. When everything looks
okay and is verified, the change can be pushed to the main branch and be available to all developers.
You can find out more about Gerrit and download the server at https://code.google.com/p/
gerrit.
When you’re working on a team with many developers, code reviewing with Gerrit is a great tool because
it supports a distributed review method. The reviewer doesn’t need to be located near the developer to ask
questions or give feedback but can do so directly in the tool. It might seem at first that this extra tool will add
unnecessary overhead to a project, but anyone who has been doing code reviewing on a regular basis knows
how much it improves the quality of the code. For an example of what the Gerrit tool looks like, see Figure 1-2.
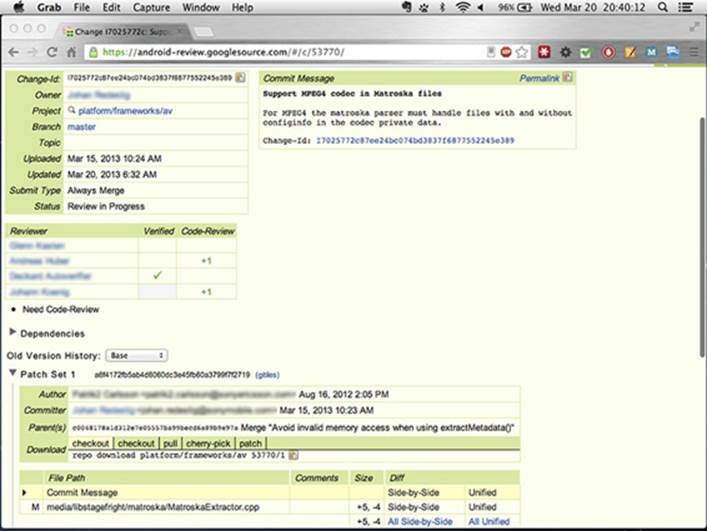
Figure 1-2 The web interface for the Gerrit code-review tool
Mastering Your IDE
In May 2013 at the Google IO conference, Google announced a new IDE for Android named Android Studio.
This IDE is based on the open-source version of IntelliJ IDEA (Community Edition). The reason for switching
from Eclipse, which was the previously supported IDE, to IntelliJ IDEA was due to the complexity involved in
developing the Android plug-in for Eclipse. IntelliJ IDEA provided a far more superior platform for development
and allowed the Android tools team at Google to take the development experience to a new level as they could
integrate the Android tools into the IDE instead of simply providing a plug-in.
In this section, I cover three useful features that are supported by Android Studio: debugging, static code
analysis, and refactoring. Although these features have been available from both IntelliJ IDEA and Eclipse for
some time, I keep seeing many developers, both beginners and experienced developers, not using them to
their full extent. A developer who fully masters these features in his IDE will notice that he becomes much more
efficient in producing high-quality code.
Debugging Android Applications
Debugging capabilities give you fine-grained control over the execution of an application. You can set
breakpoints where execution will pause and inspect every aspect of the application state. This feature becomes
most useful when it comes to discovering the source of a bug or when you need to carefully inspect exactly
what happens during execution. The capability to debug Android applications is built into the IDEs, providing a
simple user interface for stepping through the code, inspecting variables, and even changing their values.
You can debug Android applications on your device through the Android SDK. Your IDE will connect to the
debugging Service (adb) running on your device, which in turn connects to the Dalvik virtual machine
(VM) that your application is running. The procedure is basically the same one you follow when you run an
application from your IDE.
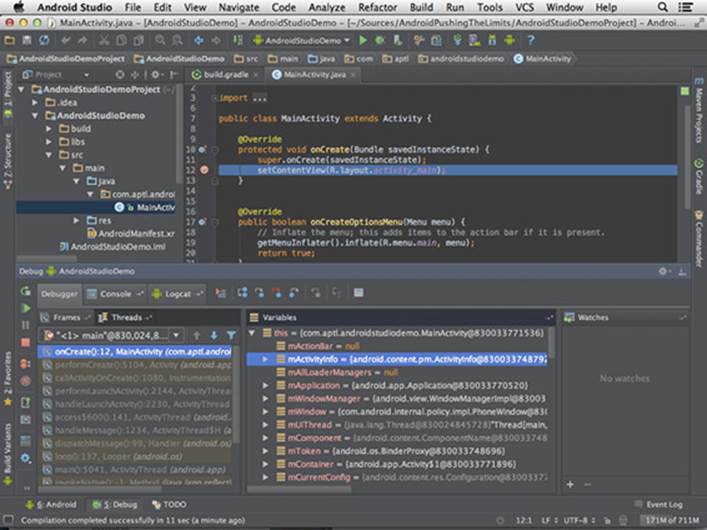
Figure 1-3 shows one of the sample applications from the Android SDK opened in Android Studio. As you can
see, I set a break point in the code and started the debugging from my IDE. The figure shows how the IDE looks
once the execution hits the breakpoint.
Figure 1-3 Breakpoint reached when debugging sample application in Android Studio
When a breakpoint is reached, you can inspect the state of the application at that specific point. All variables
accessible in that scope are listed in the debugger UI in the IDE. While debugging applications, you can change
the value of a variable in the current scope without having to restart the application and change the assignment
in the code, which is useful for testing how an application works depending on different input values. For
instance, if your application reads input from a sensor and you are unable to control the values from this sensor,
setting a breakpoint after data from the sensor has been read can be a powerful tool during development.
Android Studio contains a very powerful debugger tool that not only allows you to change the value of
variables but also to execute arbitrary code at the current scope, as shown in Figure 1-4. This capability is
especially helpful when you’re performing more advanced inspections that require the temporary injection of
several lines of code at the breakpoint.
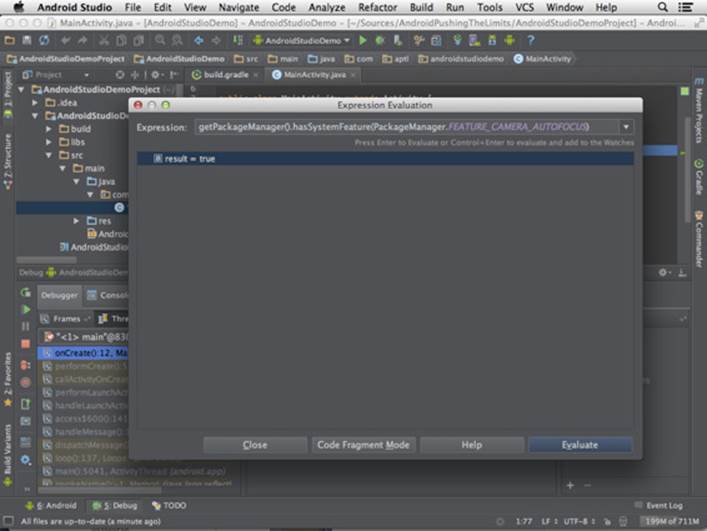
Figure 1-4 Executing the code evaluation tool in Android Studio
Remember that using the debugger is not a substitute for writing tests for your application.
Static Code Analysis with lint
Even the best developers make mistakes in their code, and over the years different ways of dealing with this fact
have been developed. Writing unit tests has proven to be very effective and is something I highly recommend
to all developers. However, even with carefully written unit tests, it’s hard to cover all possible situations that
might occur in the code, which is why it’s important to complement unit testing with other methods@mdfor
instance, static code analysis. Fortunately, Google has added such a tool, called lint, to the Android SDK.
The lint tool performs checks on your project’s source files, both XML and Java, and searches for missing
elements, poorly structured code, unused variables, and more. In your IDE, the results appear as highlighted areas
(see Figure 1-5) indicating that something needs to be fixed. Hovering the cursor over these highlights shows you
more details and in some cases allows you to perform the “quick fix” command in order to correct the problem.
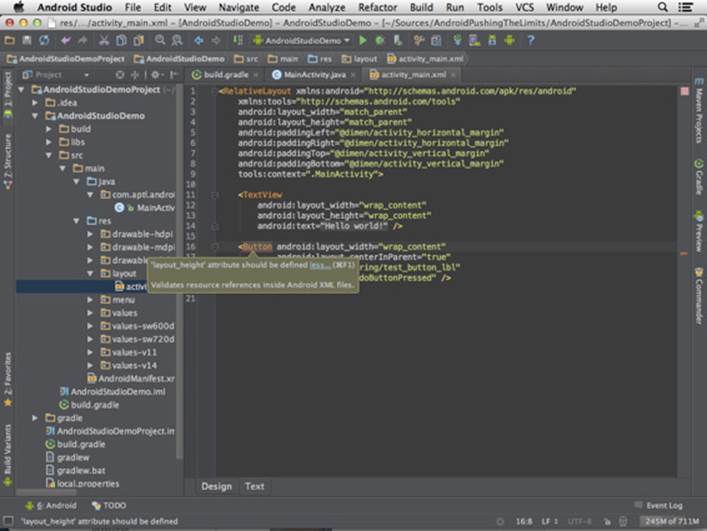
Figure 1-5 Android Studio showing missing attributes highlighted in a XML layout file
Although it’s a very powerful tool, sometimes lint can indicate a warning in code that may be correct. A warning
could be about an unused method declaration or a missing recommended attribute in the manifest. In these
cases, the lint warnings may become irritating, especially if several developers are involved in a project. In that
case, it may be a good idea to actively suppress a warning for a specific part of the code to indicate that things
are okay, despite what lint thinks.
Suppressing lint warnings can be done for both Java and XML source files. For Java, you use the annotation @
SuppressLint with the warning you want to suppress as an argument, as shown in Figure 1-6.
In XML files, you include the lint namespace and add tools:ignore=”WarningName” (where
WarningName is the warning you want to suppress; see Figure 1-7) to the part where you want to suppress the
warning.
Remember that lint warnings are there for a purpose. They indicate areas that are potential bugs, so always
carefully consider whether you really want to suppress the warning. It’s often better to leave the warning in
place rather than remove it, as a reminder that it should be dealt with later.
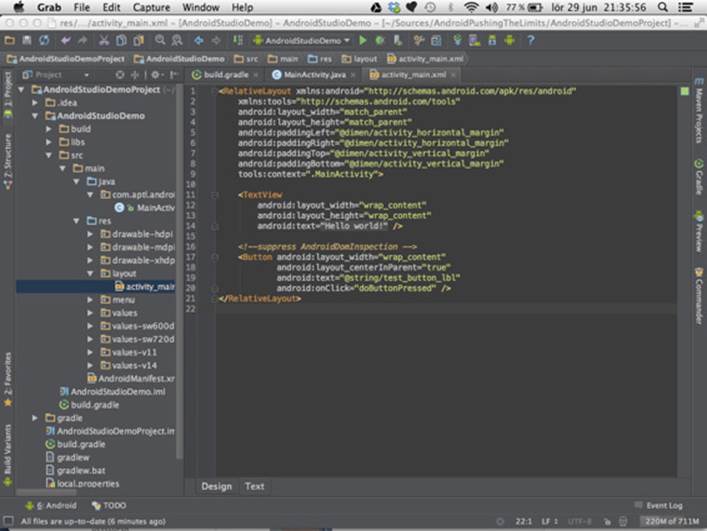
Figure 1-6 Warning suppressed in Java source
Figure 1-7 Warning suppressed in XML source
Refactoring Your Code
When you write code, you rarely get it perfect on the first try. You tend to change the structure and names of
methods, variables, and classes. When the number of classes grows in a project, you might move them into a
separate package. As you write more and more code, you suddenly realize that you have code that does the
same thing written in several different places with just minor differences.
Making changes in existing code can become a complicated process when that code is referenced in many
places. If you want to add another parameter to a method, you need to find all the places where the method
is used and update those. This can become a very complicated and error-prone process if done manually.
Fortunately, your IDE has a built-in function called Refactoring that makes this task simple and eliminates
the risk of introducing any bugs.
Many refactoring tasks are available in your IDEs. Refactoring involves simple things like renaming and moving
variables, methods, classes, and packages, as well as more complex operations such as changing the signature
of methods, encapsulating fields, replacing code duplicates, and replacing inheritance with delegation. I cover
some of the most common tasks in the following sections.
To use refactoring in Android Studio, place the cursor at the position in the code where you want to change
something and then select the refactoring task from the Refactor menu.
Extracting Constants
When you write code it is easy to ignore some best practices that we all know would benefit us in the long
run. A common example is when writing constant values in the code (that is, using the actual value instead
of a variable) instead of declaring a constant variable (a variable declared as public static final). The
problem is that once you decide to change the value, you need to find all the occurrences of that value and
replace it with the constant’s name. This is where the Extract Constant refactoring task comes in. As shown
in Figure 1-8, this task allows you to quickly and correctly replace all occurrences of that value with a newly
declared constant.
Changing the Method Signature
The method signature defines the access modifier (private, protected, package local or public),
return type, name, and parameters for a method. If you have a commonly used method where you want to
add an extra parameter, making the correct change in all places where the method is used in your project can
become complicated. Figure 1-9 shows how you can change all the parts of a method signature as well as all the
places where it’s used in your code.
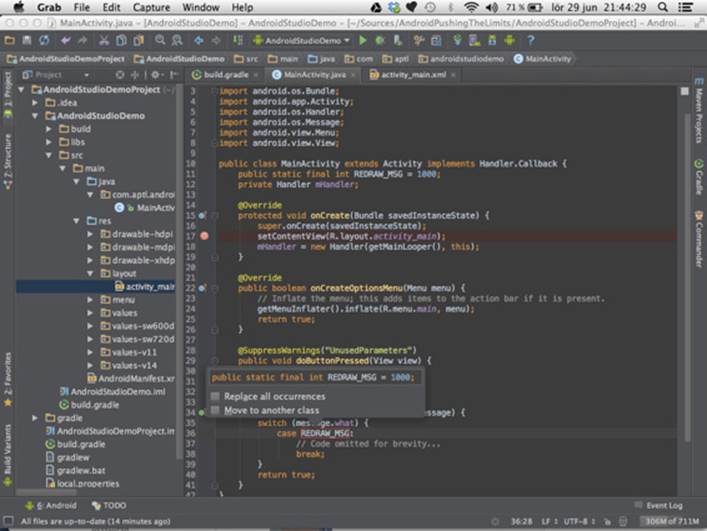
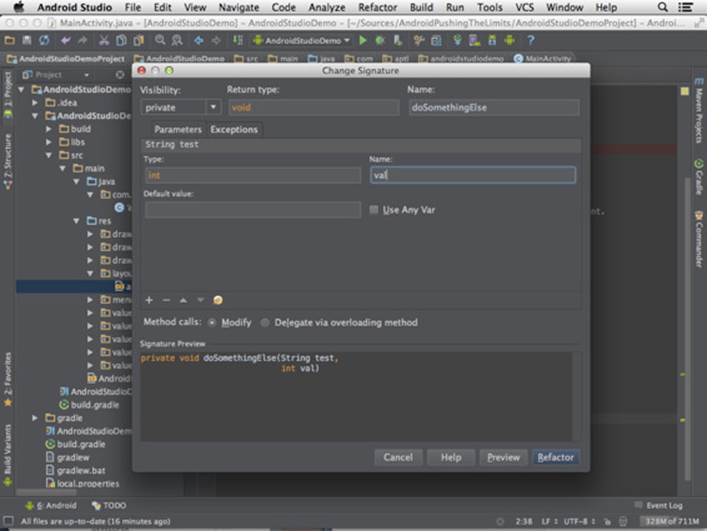
Figure 1-8 Extracting a repeated value to a constant in Android Studio
Figure 1-9 Changing a method signature in Android Studio
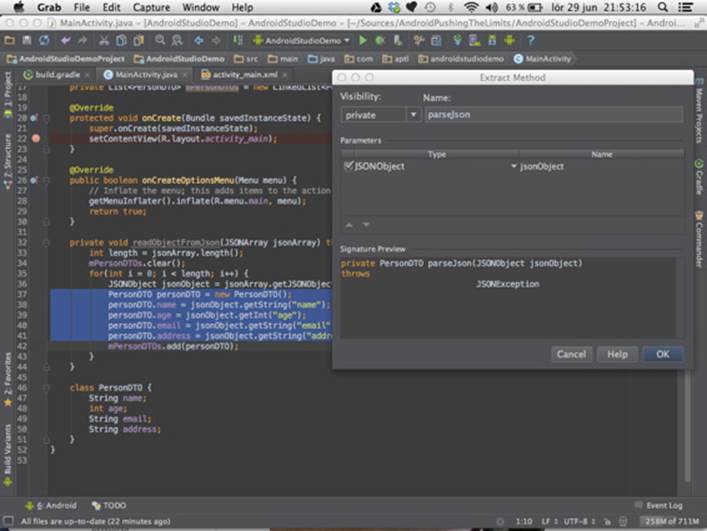
Extracting the Method from Code Block
It’s good practice to keep methods small to make code more readable and allow for more efficient reuse of
the code. When you see that a method is growing out of proportion, you can mark off a block in the code and
perform an Extract Method task as shown in Figure 1-10. After that, you can also perform the Change Method
Signature task to make the method more generic and reusable if needed.
Figure 1-10 Extracting a block of code to a separate method in Android Studio
There are many more refactoring options available in the IDE. I recommend that you become familiar with all of
these as they will make you a more productive developer. For more refactoring options in Android Studio, which
is based on IntelliJ IDEA, users can find a comprehensive guide to most of the refactoring tools at http://
www.jetbrains.com/idea/features/refactoring.html.
Developer Options on Android Devices
In the Settings application on your Android device, you can find the Developer Menu. Depending on which
version of Android you’re running, this can present different options. Also, some device manufacturers may add
their own settings in the Developer menu. In this section, I cover the most important details of the Developer
menu in Android 4.2 on a Nexus device.
Starting with Android 4.2, Google hides the Developer menu by default, purely for security reasons: Showing
the Developer menu could create some serious security issues if it’s enabled by mistake. Here’s how you enable
the Developer options on an Android device with version 4.2 or later:
1. Go to the Settings application.
2. Scroll down the list of options and tap the About Phone option, located at the bottom of the list.
3. Locate the row with the label Build Number and tap the Build Number option seven times.
A notification saying “You’re Now a Developer” appears, and the Developer Options menu now appears in
the Settings list.
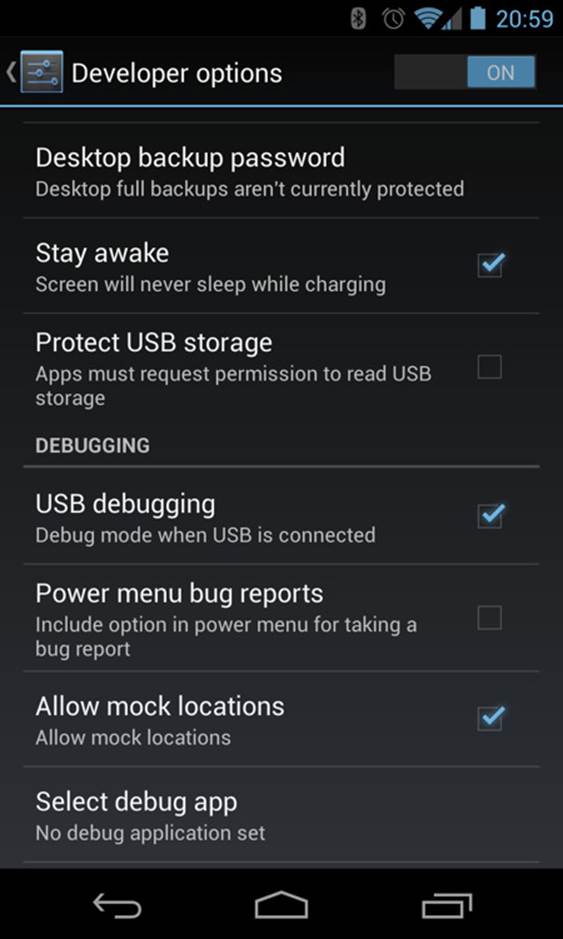
Understanding Developer Settings
In the Developer Options menu (see Figure 1-11), you will find many choices that may be confusing at first.
Although they’re all useful in certain situations, I cover those that I believe are most useful for application
developers.
Figure 1-11 The Developer Options menu on a Nexus 4
device running Android 4 .2
The first option you want to enable is Stay Awake, which causes your device to keep the screen on while it’s
charging—of course, the USB cable needs to be connected to your laptop. This way, you don’t have to unlock
your device whenever you want to deploy and run the application you’re developing, which saves a lot of
frustration.
A bit further down the list is the Debugging option, which contains a number of useful options that you need
to understand. The first option you want to enable is USB Debugging. Without this option, you won’t be able
to connect the device to your development environment using the adb tool. If you’ll be working with Google
Maps or the Location API, enable Allow Mock Locations too, so that you can test different location parameters
without having to travel all over the world.
Under Input are two settings (Show Touches and Pointer Location) that you’ll find useful when writing
applications that rely on advanced touch input, such as gestures and multi-touch interfaces.
The Drawing option contains several settings options that allow you to get visual feedback on how the user
interface is laid out and how fast and often a redraw occurs. You can also set scaling parameters for animations
and transitions as well as disable them completely for debugging purposes. One setting that is new with
Android 4.2 is the possibility to simulate a secondary screen. With the introduction of multiple displays in
Android 4.2, this feature makes it easy to develop multi-screen applications without having to connect your
device to a real secondary screen. Instead, the Android system will draw an overlay on top of the standard user
interface that simulates this second display.
Under Monitoring, you find some options that can prove invaluable for ensuring that your device runs
smoothly. Most developers are usually equipped with the latest version of high-end smartphones. Normal
users, however, may use older devices with less powerful CPUs and memory. An application that runs fine on
your high-end device can become sluggish and even encounter the dreaded Application Not Responding (ANR)
message if you’re not careful. The options under Monitoring in the Development Options menu can help you
spot these problems early on. By checking Strict Mode Enabled, the screen on your device will flash when you’re
performing a long operation on the main thread. Show CPU Usage is useful for tracking how much more the
CPU is working when your application is running, which you can use for comparison with other applications
on the same device to see if you’re doing better or worse than they are. Comparing the performance of your
application with other similar and popular apps is a good practice.
In the final section, named Apps, there are three options that are also useful for simulating the behavior
of devices with less CPU and memory. The Don’t Keep Activities option makes sure that your Activities are
restarted from scratch every time they’re launched. Normal behavior for Android is to keep Activities alive for
as long as possible so that they can be launched faster. The system will completely remove (that is, destroy)
Activities only when the device runs low on memory. By checking this option, you can simulate how your app
will behave on a device with much less available memory. You can further simulate this kind of behavior by
changing the Background Process Limit option, which forces background operations to stop much earlier.
Finally, checking Show All ANRs is recommended for all developers, because it will become much more obvious
when an application crashes in the background. Normally, ANRs aren’t shown unless the current foreground
application causes it to show.
Summary
In this chapter, I covered the details of the Android SDK, some of the hidden features of the adb tool, how to
stress test your application with the Monkey tool, how to use the ProGuard tool for obfuscating your code, and
how the new build system based on Gradle works. I continued with more details on how to setup an Android
Library Project or how to integrate a third-party library for your Android application.
Because the use of Git as a Source Code Management system for software development is quite widespread
today, I also described how you can combine Git with various Services in order to make it easier for a team to
work together.
The new IDE for developing Android applications, called Android Studio, contains a number of advanced
features that many developers have rarely used. By understanding and mastering the refactoring features in this
IDE, you can simplify complex tasks when you need to re-structure your code. It also helps to simplify existing
code without the risk of introducing new bugs.
Finally, I outlined some of the more important details about the developer options settings in Android. It’s
important to have a full understanding of how these work and how they can assist in development, debugging,
and testing. Just remember to switch them all off and test your application without them to ensure that
everything works as intended on a normal user’s device.
Developing software is more than simply writing code, regardless what kind of application or service you’re
developing. For Android, mastering the tools is as important as the quality of your code, because when the tools
are used to their fullest extent, the writing of the code becomes much easier and less error prone.
Further Resources
Books
Loeliger, Jon, and Matthew McCullough. Version Control with Git. O’Reilly Media, Inc., 2012.
Websites
Android development resources from the official Android Developer site: http://developer.
android.com
The Gradle build system: http://www.gradle.org
All materials on the site are licensed Creative Commons Attribution-Sharealike 3.0 Unported CC BY-SA 3.0 & GNU Free Documentation License (GFDL)
If you are the copyright holder of any material contained on our site and intend to remove it, please contact our site administrator for approval.
© 2016-2026 All site design rights belong to S.Y.A.