PIC32 Microcontrollers and the Digilent chipKIT: Introductory to Advanced Projects (2015)
Chapter 6. Microcontroller Program Development
Abstract
This chapter provides an introduction to various microcontroller program development tools. The highly popular program description language (PDL) is described with many examples. In addition, the less commonly used flow chart technique is described, again with several examples. Examples are given to show the advantages and disadvantages of both the PDL and the flow chart methods.
Keywords
Microcontroller program development tools
Program description language (PDL)
Flow charts
Representing various program control structures using the PDL language and flow charts
Before writing a program, it is always helpful first to derive the program’s algorithm. Although simple programs can easily be developed by writing the code without any prior preparation, the development of complex programs almost always becomes easier if the algorithm is first derived. Once the algorithm is ready, writing of the actual program code is not a difficult task.
A program’s algorithm can be described in a variety of graphic and text-based methods, such as flow chart, structure chart, data flow diagram, program description language (PDL), UML activity diagrams, and so on. The problem with graphical techniques is that it can be very time-consuming to draw shapes with text inside them. Also, it is a tedious task to modify an algorithm described using graphical techniques.
Flow charts can be very useful to describe the flow of control and data in small programs where there are only a handful of diagrams, usually not extending beyond a page or two. Flow charts are the earliest software development tools, introduced in 1920s. There are now commercially available flow chart design programs (e.g., SmartDraw, RFFlow, Edraw) that help the user to create and manage large and complex flow charts. One of the problems with flow charts is that the code based on a flow chart tends to be rather unstructured with lots of branches all over the place, and it is difficult to maintain such code. Flow charts are not used nowadays during the development of large programs. Interested readers can find many example flow charts on the Internet.
The PDL (sometimes called program design language) can be useful to describe the flow of control and data in small- to medium-size programs. The main advantage of the PDL description is that it is very easy to modify a given PDL since it consists of only text. In addition, the code generated from a PDL-based program is normally structured and easy to maintain.
In this book, we will mainly be using the PDL, but the flow charts will also be given where it is felt to be useful. The next sections briefly describe the basic building blocks of the PDL and flow charts. It is left to the readers to decide which methods to use during the development of their programs.
6.1. Using the Program Description Language and Flow Charts
PDL is free-format English-like text that describes the flow of control and data in a program. It is important to realise that PDL is not a programming language, but a collection of some keywords that enable a programmer to describe the operation of a program in a stepwise and logical manner. In this section, we will look at the basic PDL statements and their flow chart equivalents. The superiority of the PDL over flow charts will become obvious when we have to develop medium-size to large programs.
6.1.1. BEGIN–END
Every PDL program description should start with a BEGIN statement and end with an END statement. The keywords in a PDL description should be highlighted (e.g., bold) to make the reading easier. The program statements should be indented and described between the PDL keywords. An example is shown in Figure 6.1 together with the equivalent flow diagram. Notice that the flow chart also uses BEGIN and END keywords.
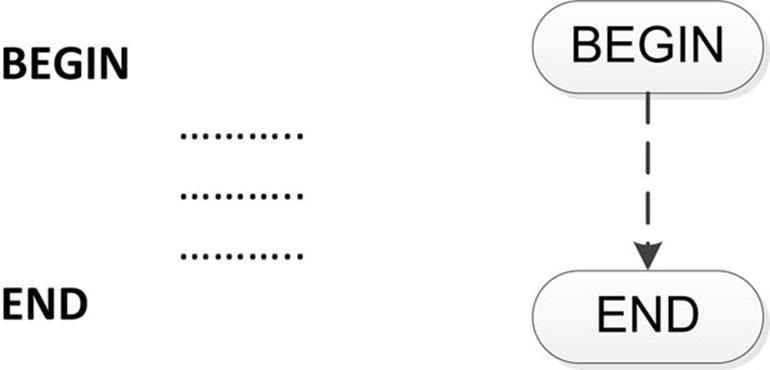
FIGURE 6.1 BEGIN–END Statement and Equivalent Flow Chart
6.1.2. Sequencing
For normal sequencing, the program statements should be written in English text and describe the operations performed one after the other. An example is shown in Figure 6.2 together with the equivalent flow chart. It is clear from this example how much easier it is to describe the sequence using PDL.
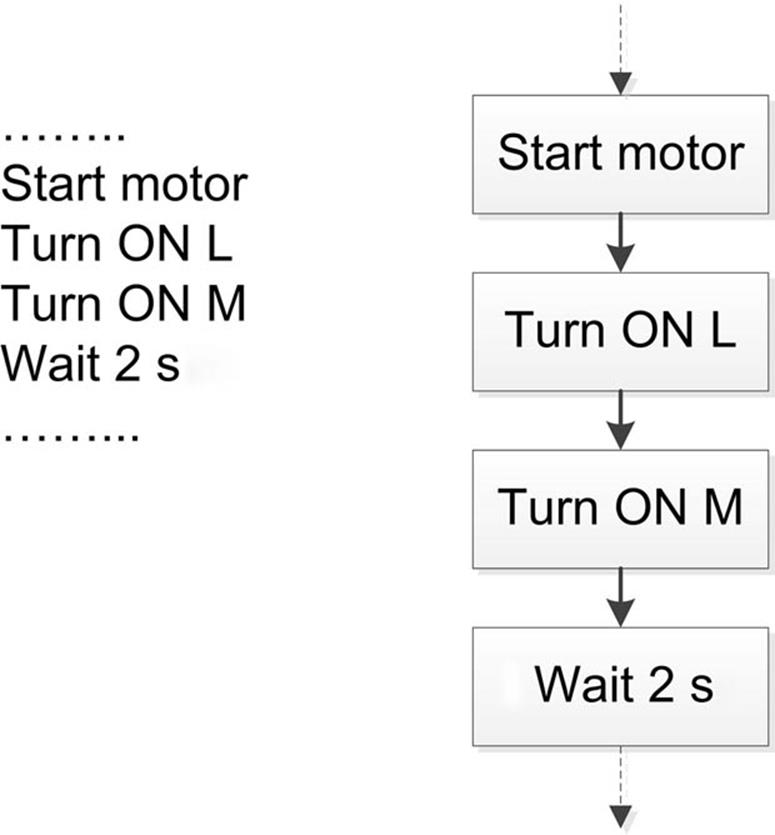
FIGURE 6.2 Sequencing and Equivalent Flow Chart
6.1.3. IF–THEN–ELSE–ENDIF
The IF, THEN, ELSE, and ENDIF should be used to conditionally change the flow of control in a program. Every IF line should be terminated with THEN, and every IF block should be terminated with ENDIF statements. Use of the ELSE statement is optional and depends on the application. Figure 6.3 shows an example of using IF–THEN–ENDIF statements, while Figure 6.4 shows the use of IF–THEN–ELSE–ENDIF statements in a program and their equivalent flow charts. Again, the simplicity of using PDL is apparent from this example.
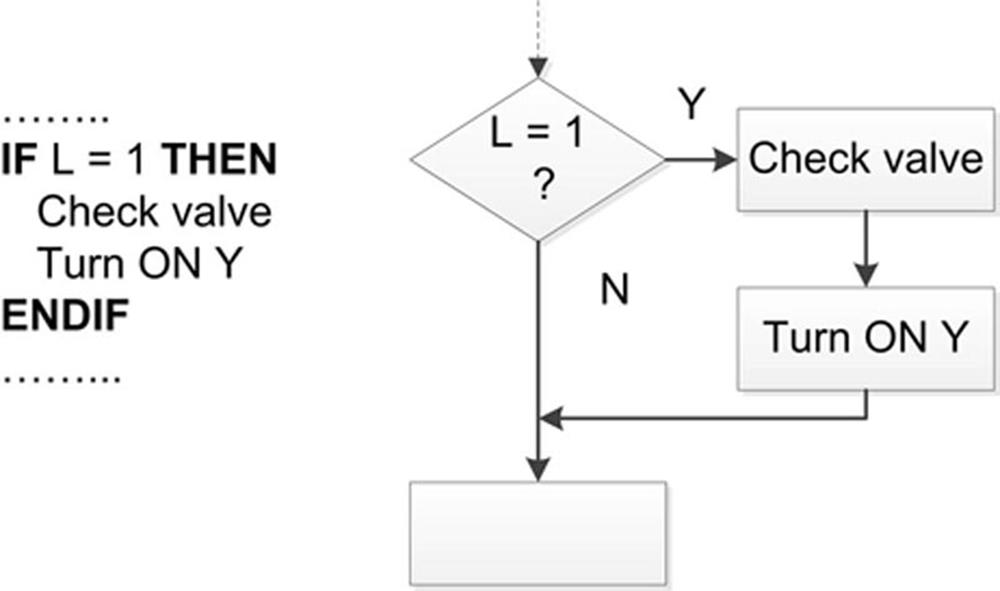
FIGURE 6.3 Using IF–THEN–ENDIF Statements
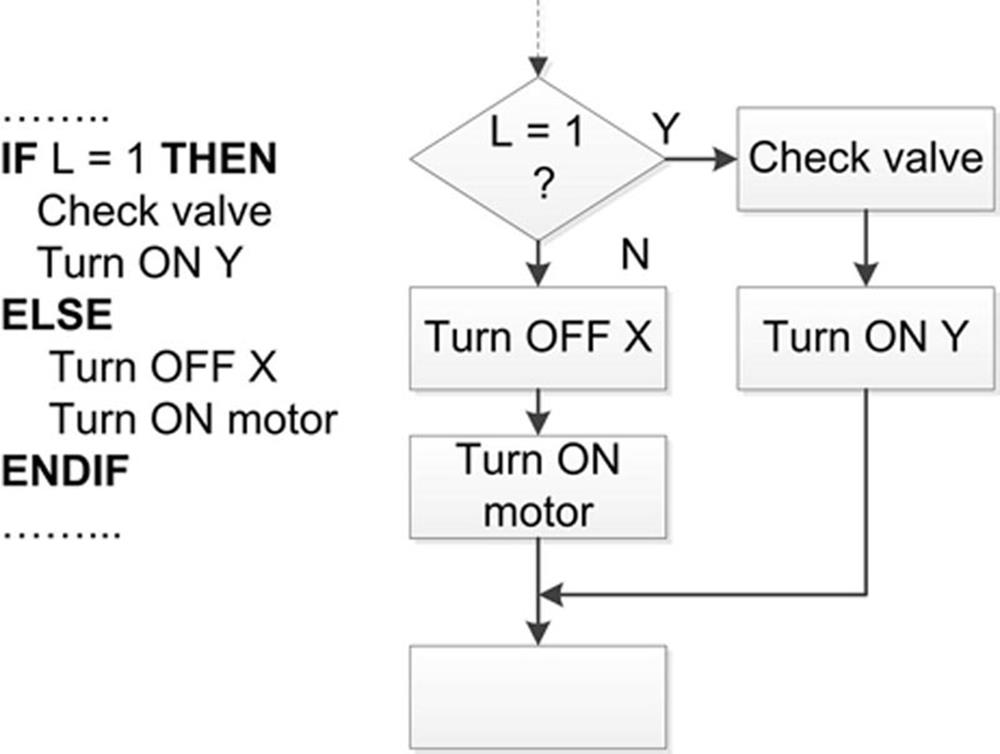
FIGURE 6.4 Using IF–THEN–ELSE–ENDIF Statements
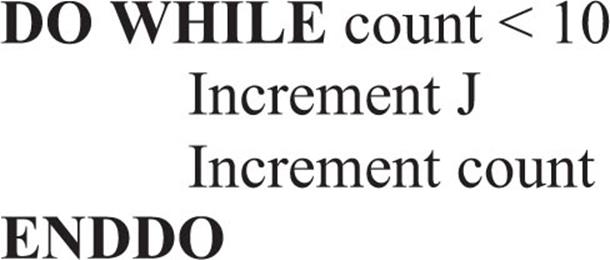
6.1.4. DO–ENDDO
The DO–ENDDO statements should be used when it is required to create iterations, or conditional or unconditional loops in programs. Every DO statement should be terminated with an ENDDO. Other keywords, such as FOREVER or WHILE, can be used after the DO statement to indicate an endless loop or a conditional loop, respectively. Figure 6.5 shows an example of a DO–ENDDO loop executed 10 times. Figure 6.6 shows an endless loop created using the FOREVER statement. The flow chart equivalents are also shown in the figures.
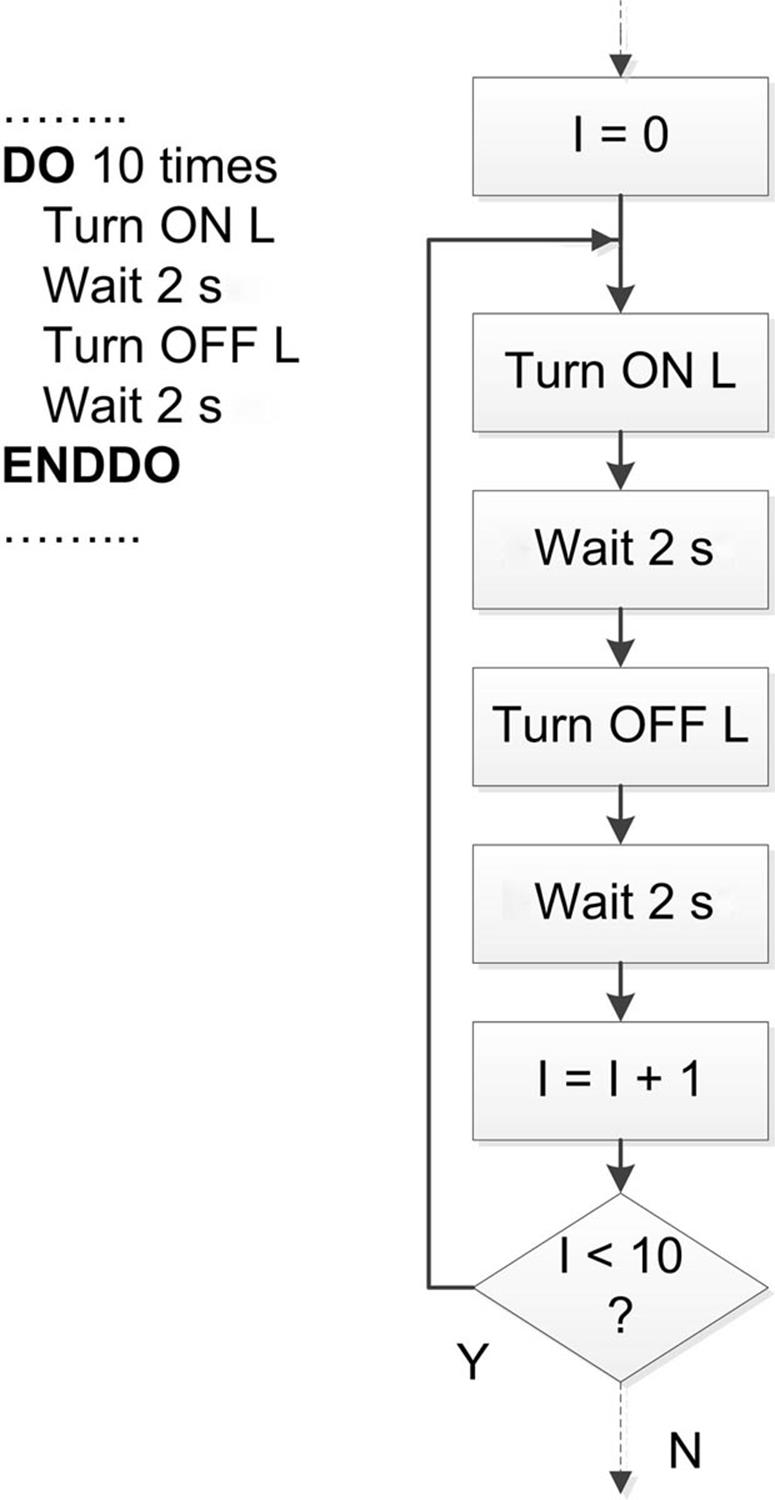
FIGURE 6.5 Using DO–ENDDO Statements
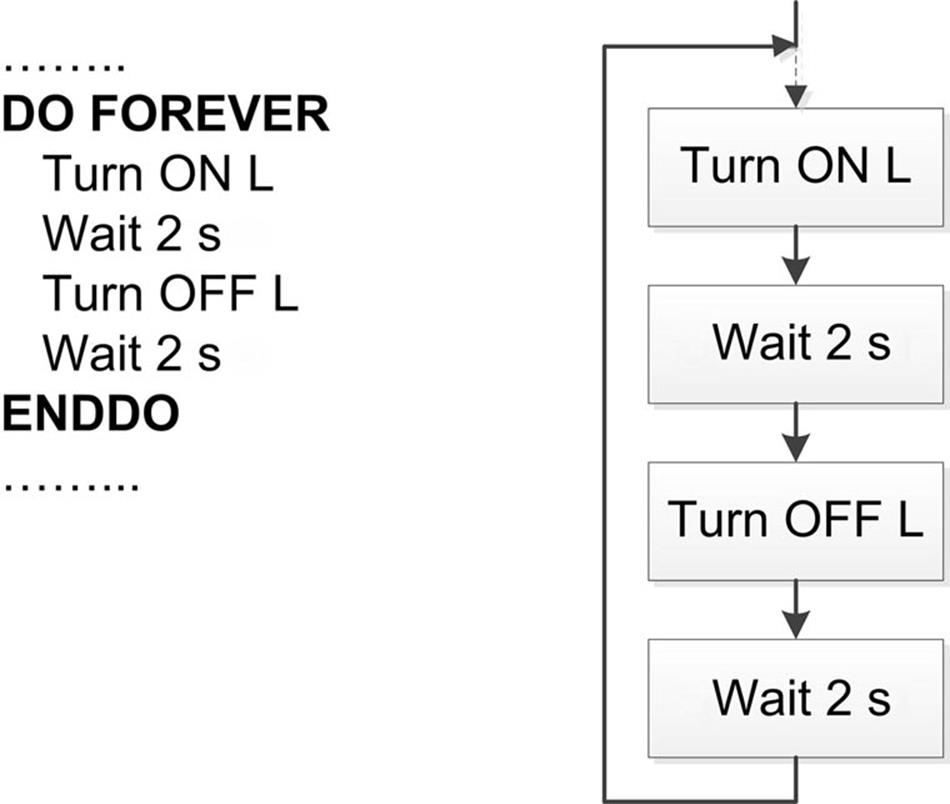
FIGURE 6.6 Using DO–FOREVER Statements
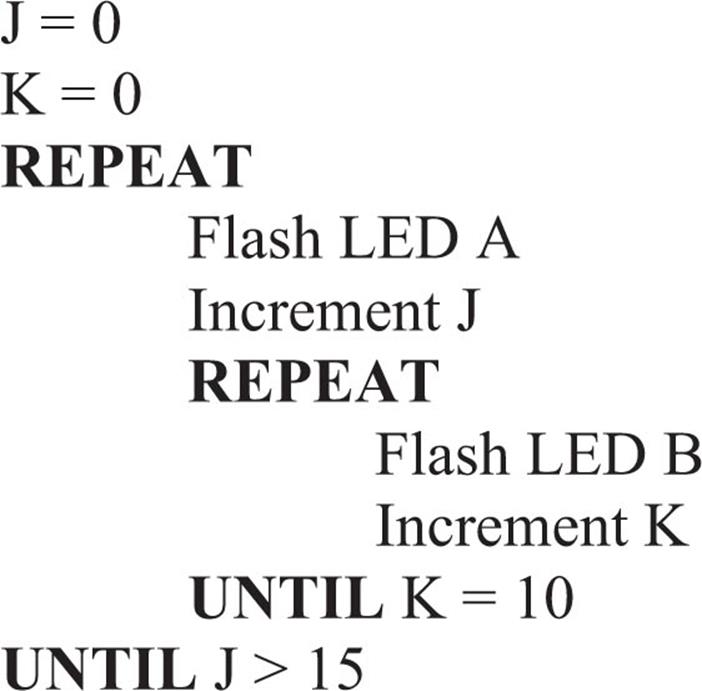
6.1.5. REPEAT–UNTIL
REPEAT–UNTIL is similar to DO–WHILE; the difference is that the statements enclosed by the REPEAT–UNTIL block are executed at least once, while the statements enclosed by the DO–WHILE block may not execute at all if the condition is not satisfied just before entering the DO statement. An example is shown in Figure 6.7, with the equivalent flow chart.
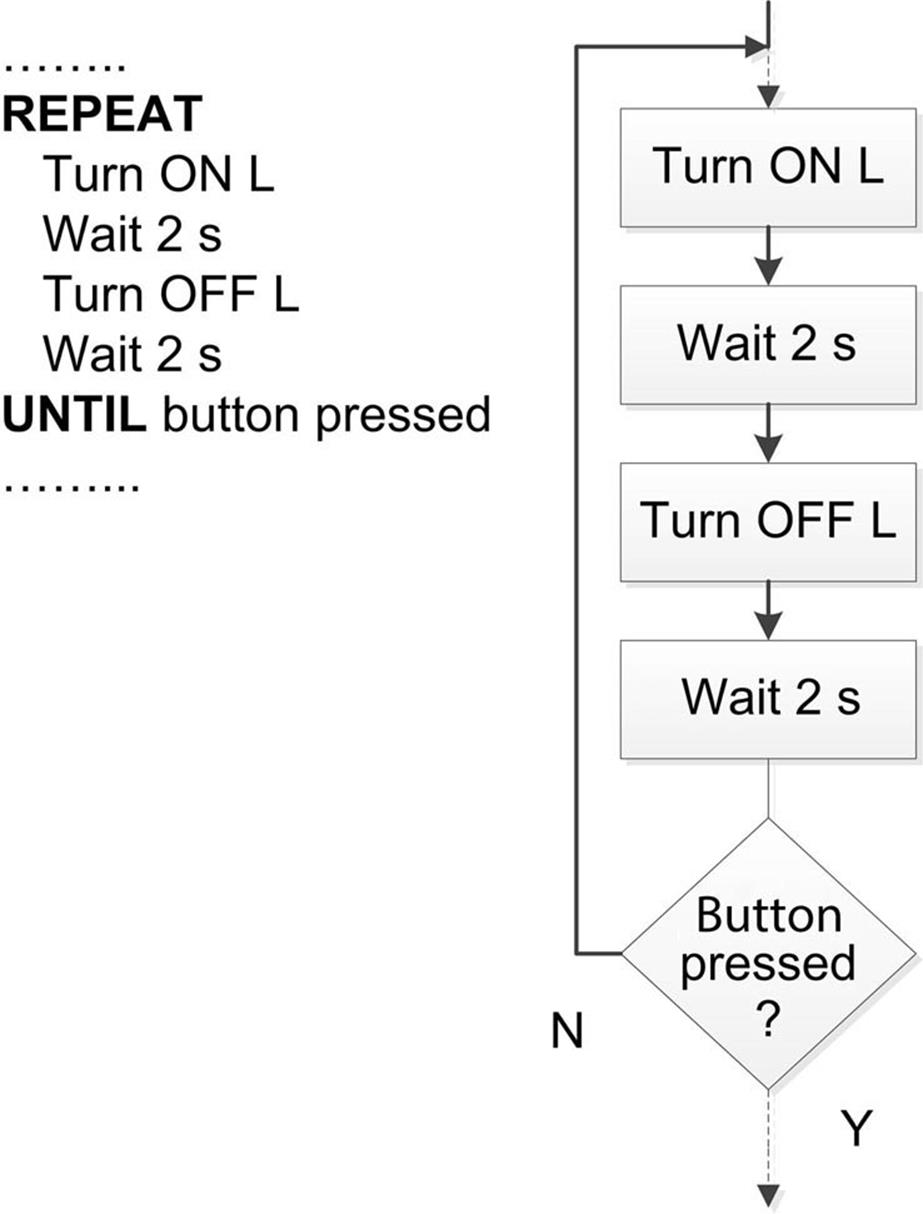
FIGURE 6.7 Using REPEAT–UNTIL Statements
6.1.6. Calling Subprograms
In some applications, a program consists of a main program and a number of subprograms (or functions). A subprogram activation in PDL should be shown by adding the CALL statement before the name of the subprogram. In flow charts, a rectangle with vertical lines at each side should be used to indicate the invocation of a subprogram. An example call to a subprogram is shown in Figure 6.8 for both a PDL description and a flow chart.
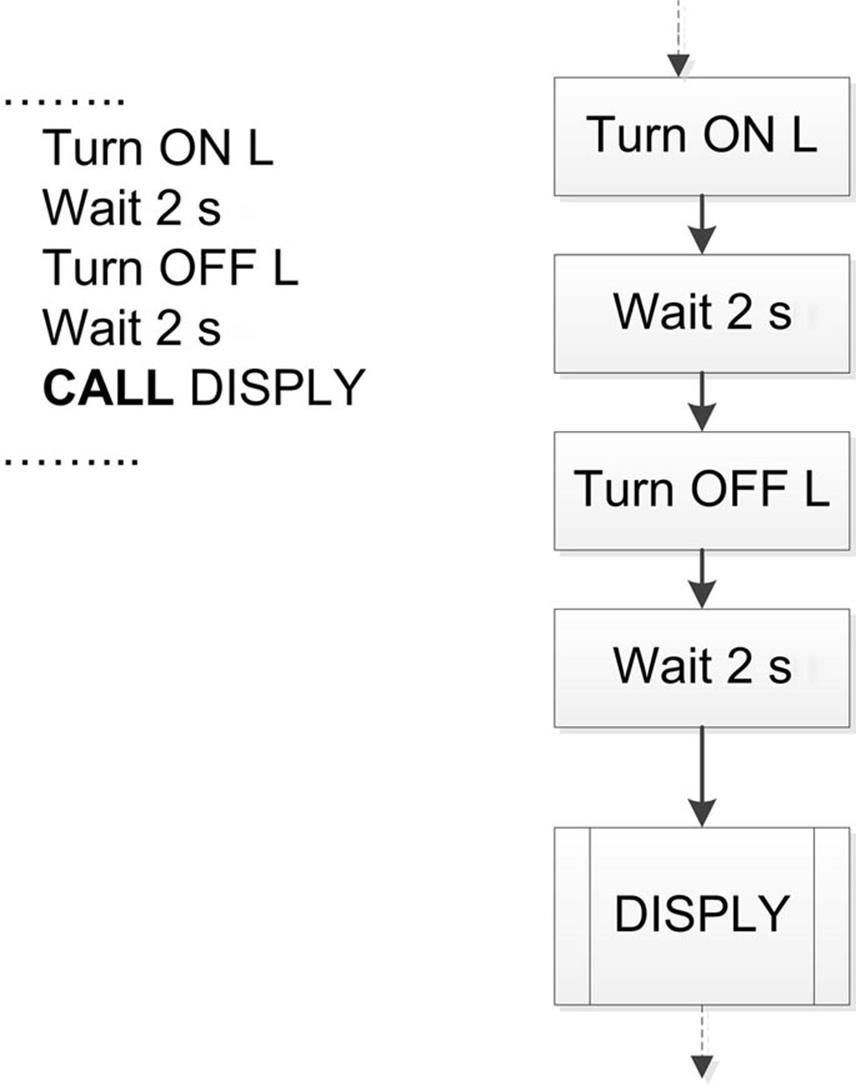
FIGURE 6.8 Calling a Subprogram
6.1.7. Subprogram Structure
A subprogram should begin and end with the keywords BEGIN/name and END/name, respectively, where name is the name of the subprogram. In flow chart representation, a horizontal line should be drawn inside the BEGIN box and the name of the subprogram should be written in the lower half of the box. An example subprogram structure is shown in Figure 6.9 for both a PDL description and a flow chart.
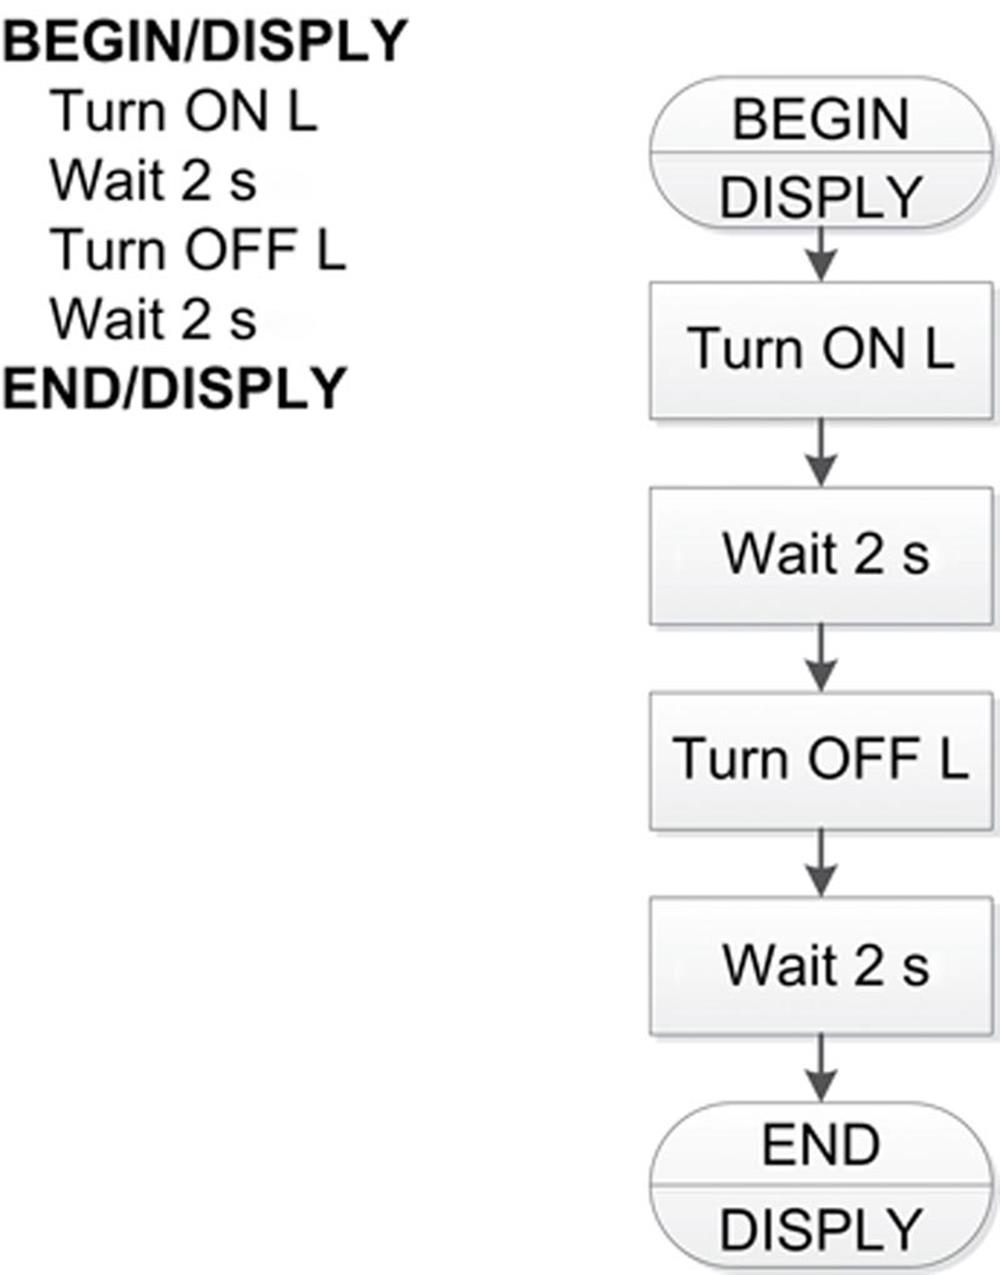
FIGURE 6.9 Subprogram Structure
6.2. Examples
Some examples are given in this section to show how the PDL and flow charts can be used in program development.
Example 6.1
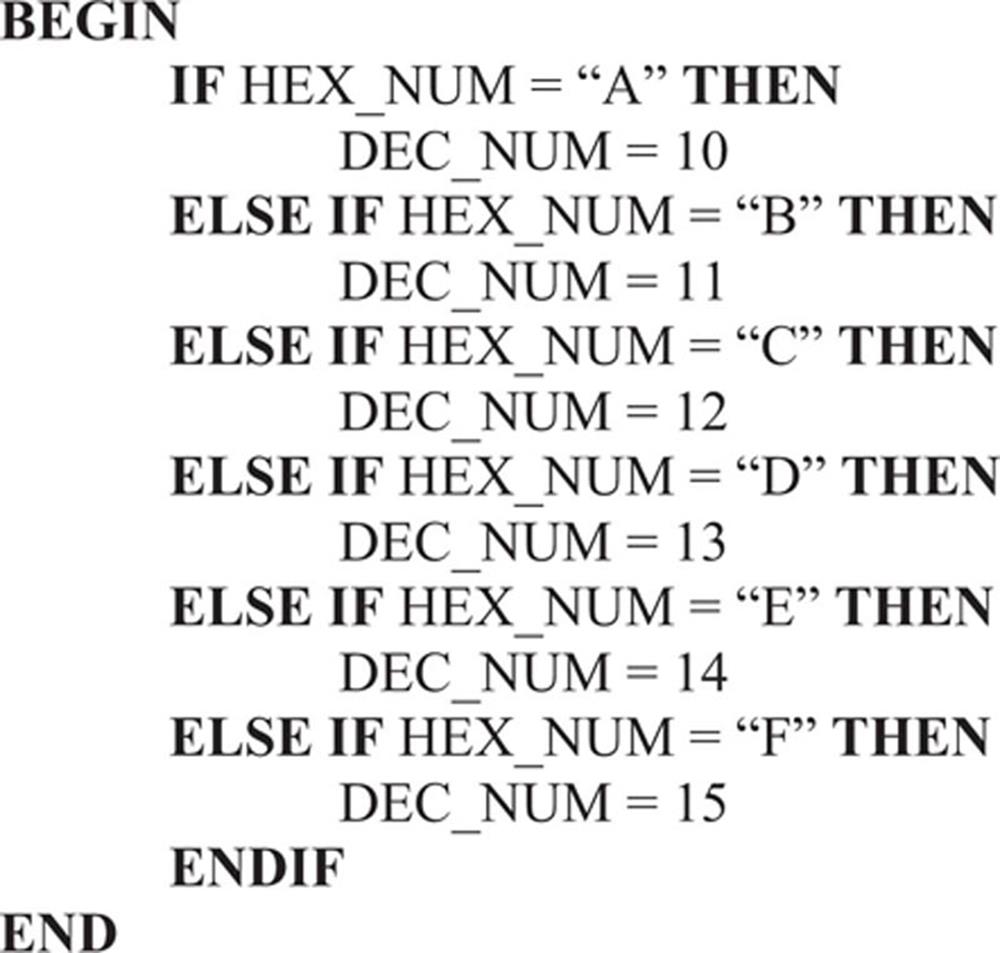
It is required to a write a program to convert hexadecimal numbers “A” to “F” into decimal. Show the algorithm using a PDL and also draw the flow chart. Assume that the number to be converted is called HEX_NUM and the output number is called DEC_NUM.
Solution 6.1
The required PDL is:
The required flow chart is shown in Figure 6.10. Notice that it is much easier to write the PDL statements than drawing the flow chart shapes and writing text inside them.
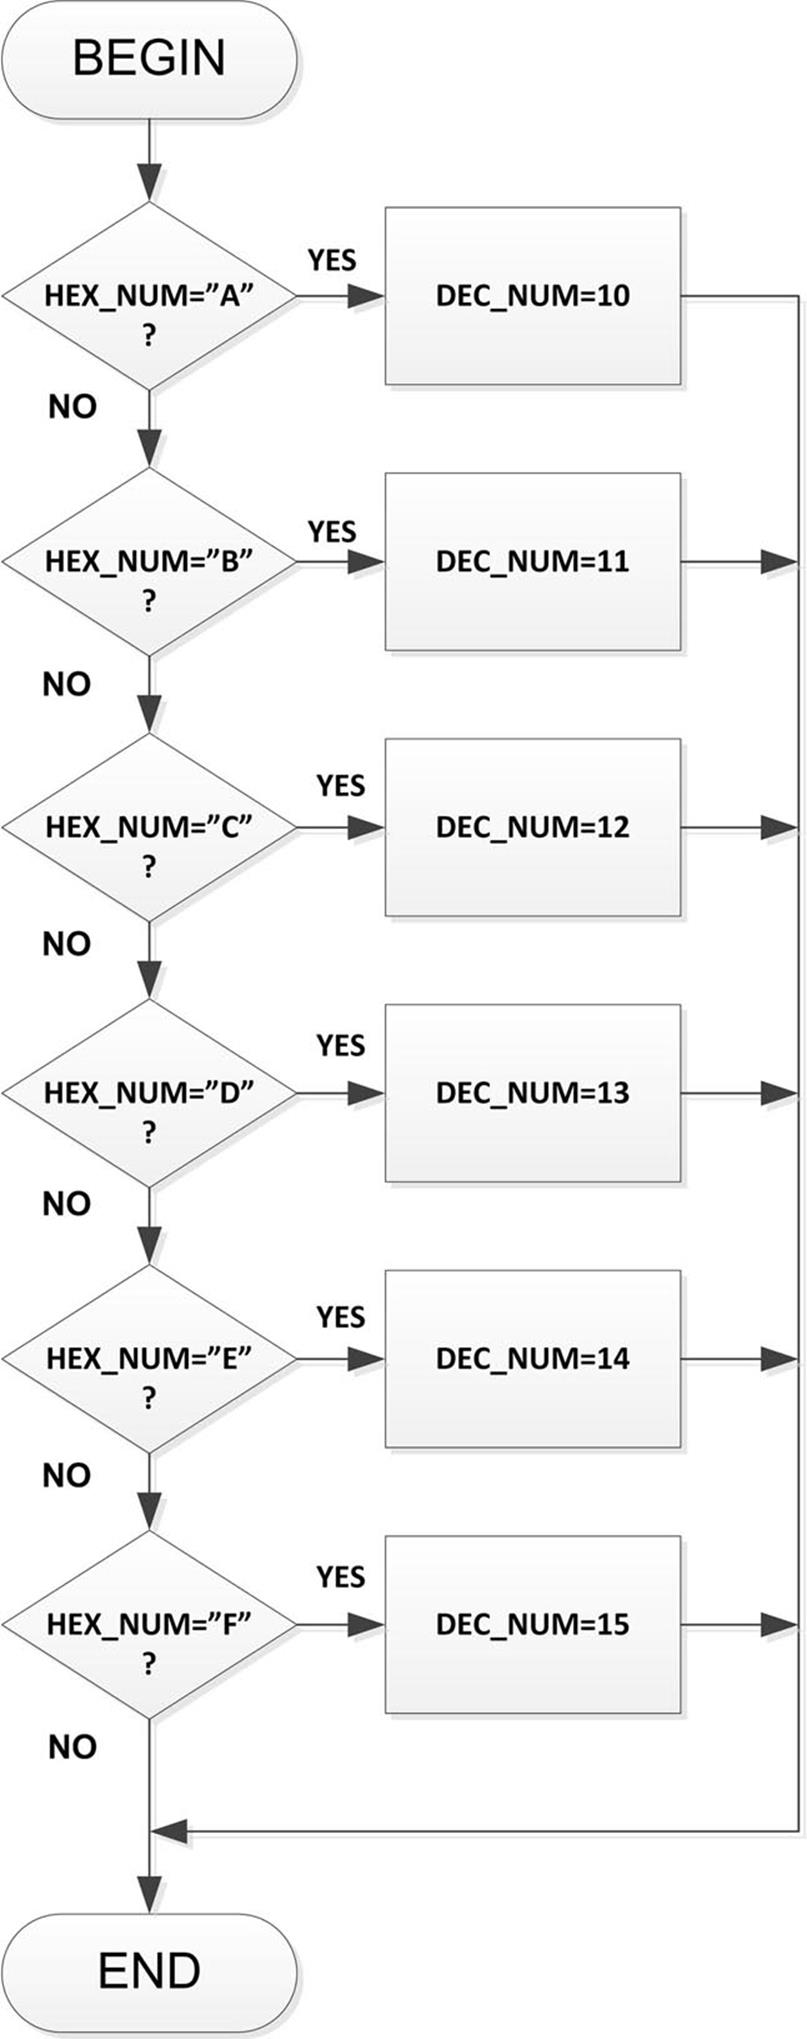
FIGURE 6.10 Flow Chart Solution of Example 6.1
Example 6.2
The PDL of part of a program is given as follows:
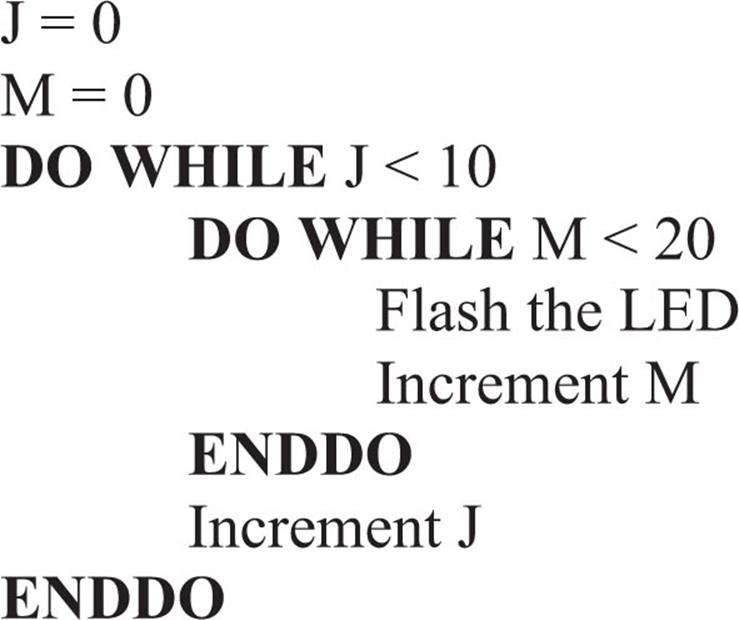
Show how this PDL can be implemented by drawing a flow chart.
Solution 6.2
The required flow chart is shown in Figure 6.11. Here again notice how complicated the flow chart can be even for a simple nested DO–WHILE loop.
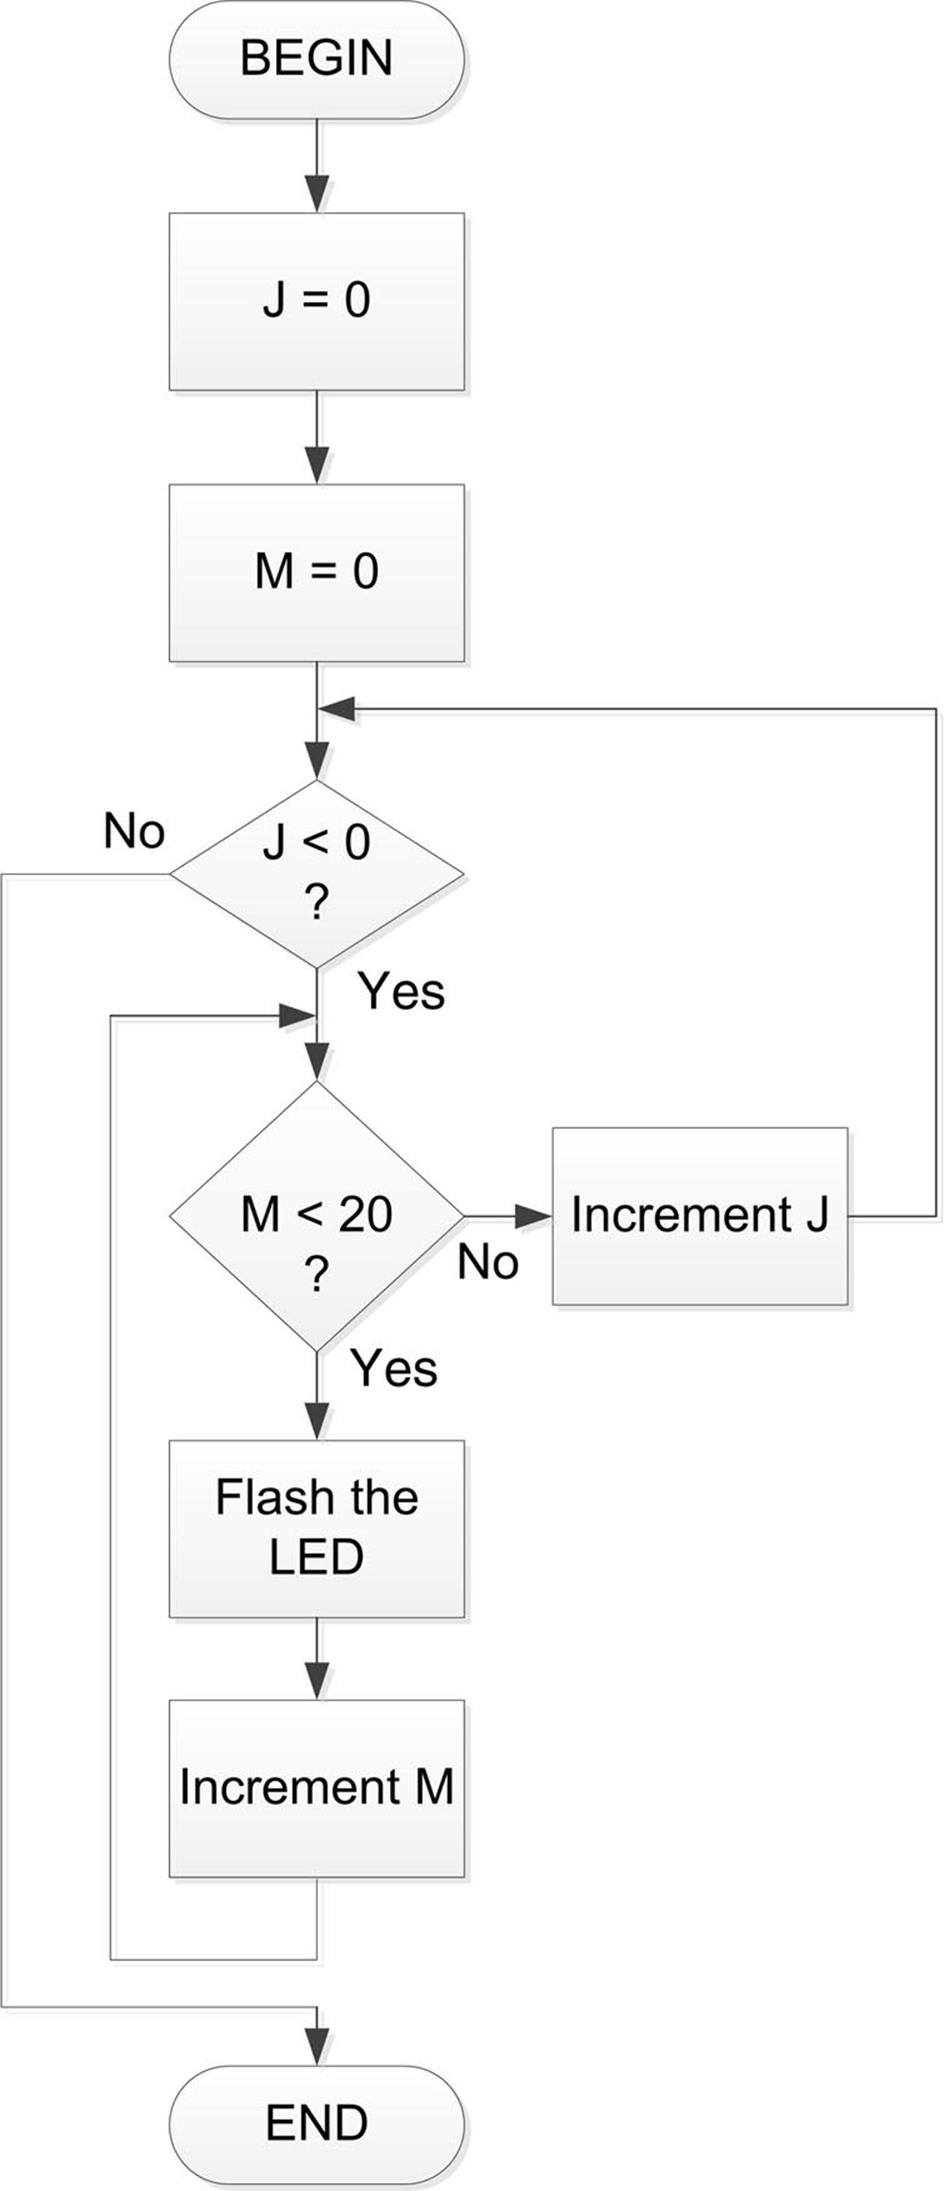
FIGURE 6.11 Flow Chart Solution of Example 6.2
Example 6.3
It is required to write a program to calculate the sum of integer numbers between 1 and 100. Show the algorithm using a PDL and also draw the flow chart. Assume that the sum will be stored in a variable called SUM.
Solution 6.3
The required PDL is:
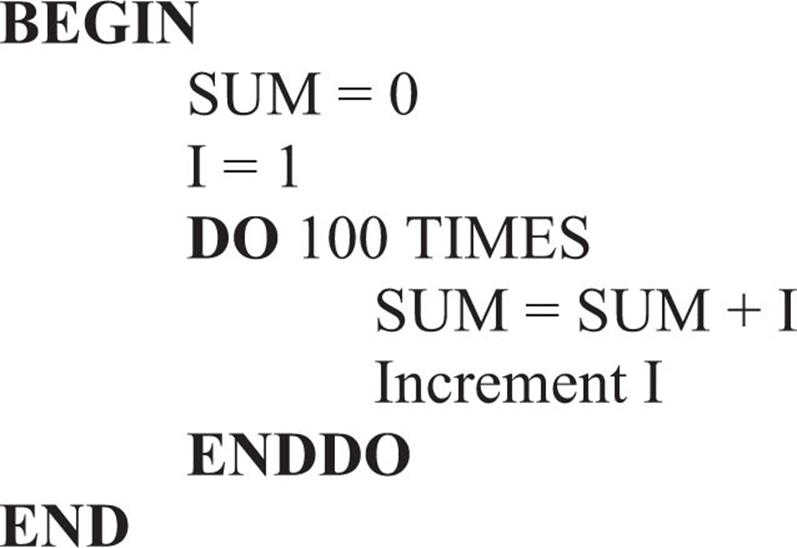
The required flow chart is shown in Figure 6.12.
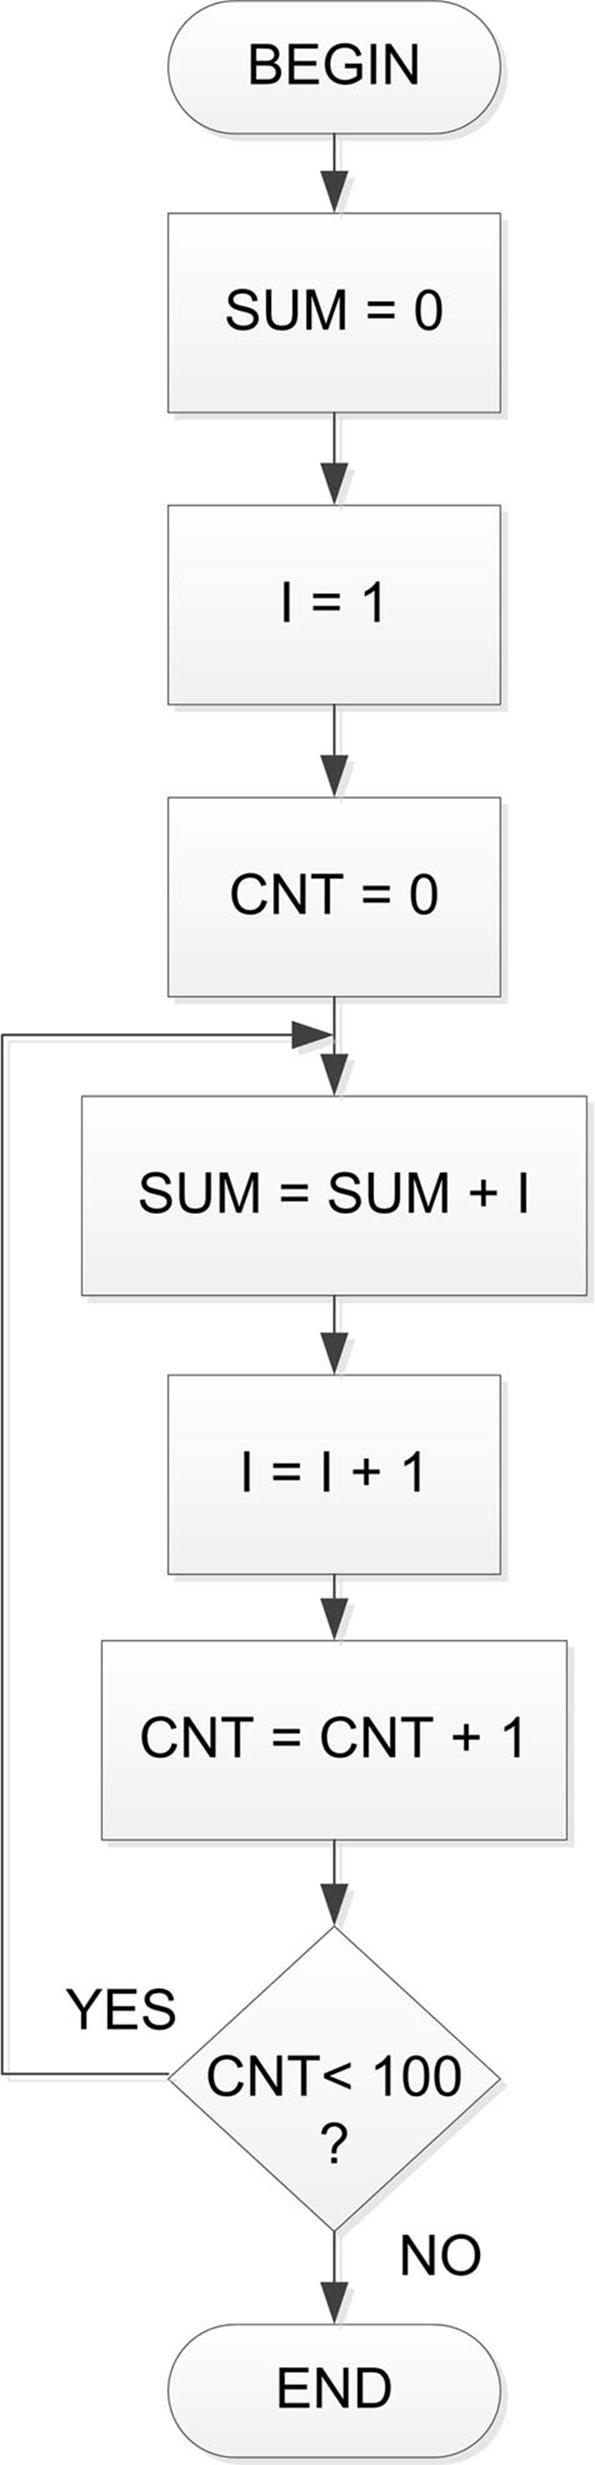
FIGURE 6.12 Flow Chart Solution of Example 6.3
Example 6.4
It is required to write a program to calculate the sum of all the even numbers between 1 and 10 inclusive. Show the algorithm using a PDL and also draw the flow chart. Assume that the sum will be stored in a variable called SUM.
Solution 6.4
The required PDL is:
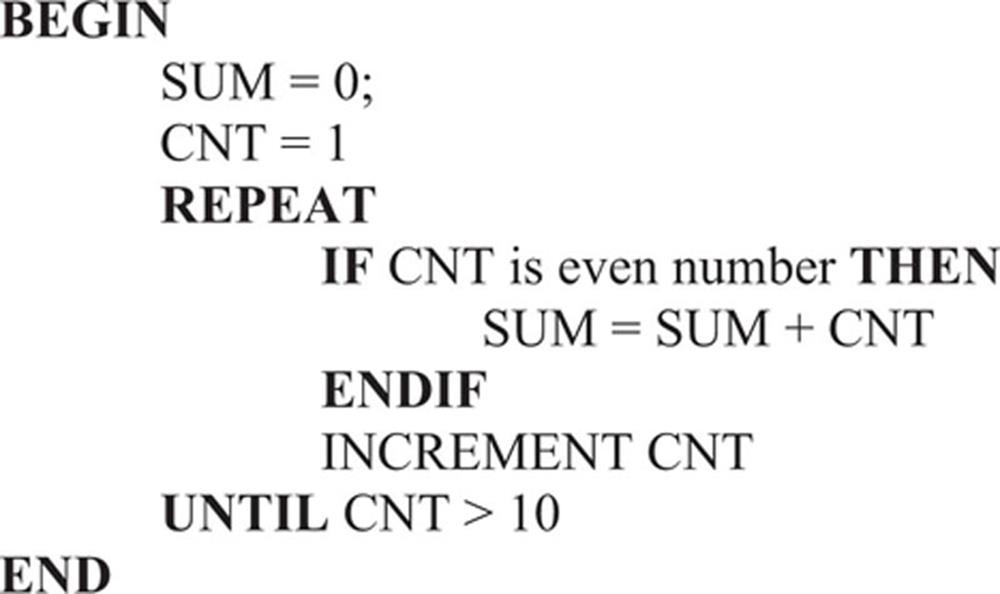
The required flow chart is shown in Figure 6.13. Notice how complicated the flow chart can be for a very simple problem such as this.
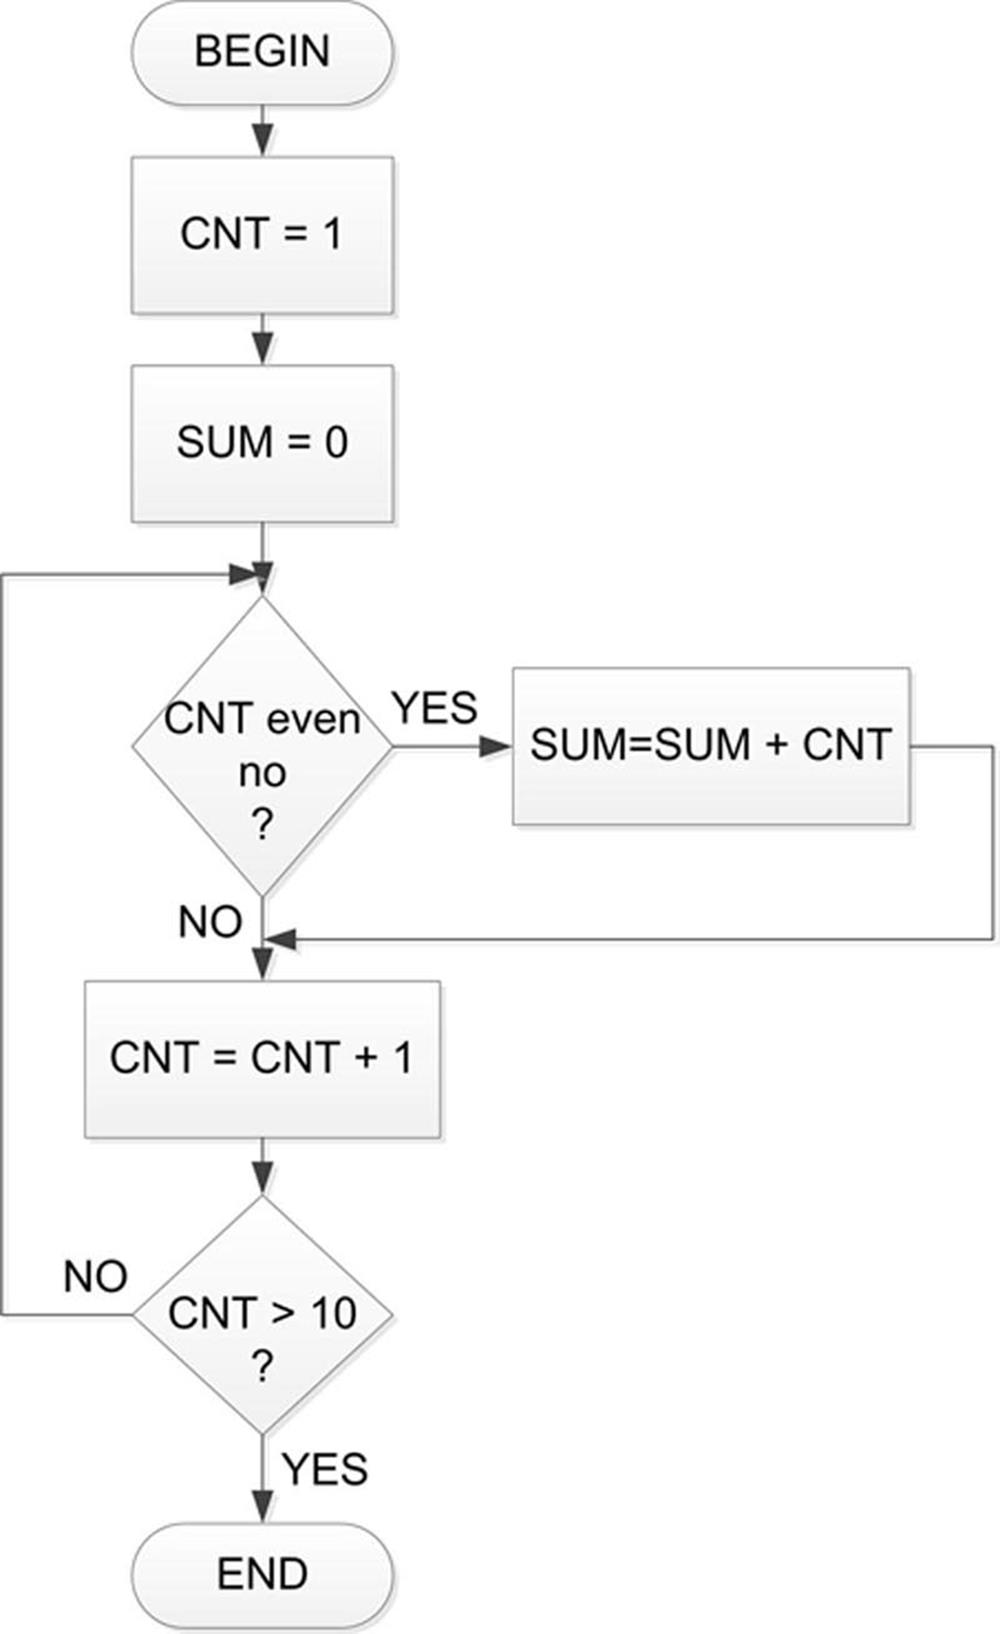
FIGURE 6.13 Flow Chart Solution of Example 6.4
6.3. Representing for Loops in Flow Charts
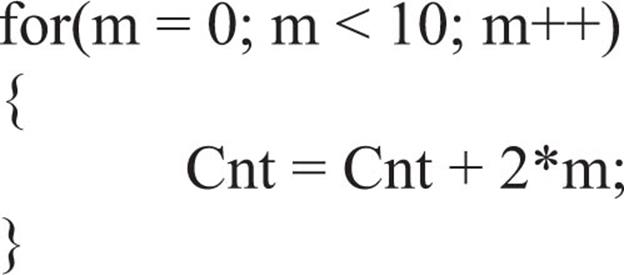
Most programs include some form of iteration or looping. One of the easiest ways to create a loop in a C program is by using the for statement. This section shows how a for loop can be represented in a flow chart. As shown below, there are several methods of representing a for loop in a flow chart.
Suppose that we have a for loop as below and we wish to draw an equivalent flow chart:
6.3.1. Method 1
Figure 6.14 shows one of the methods for representing the above for loop as with a flow chart. Here, the flow chart is drawn using the basic primitive components.
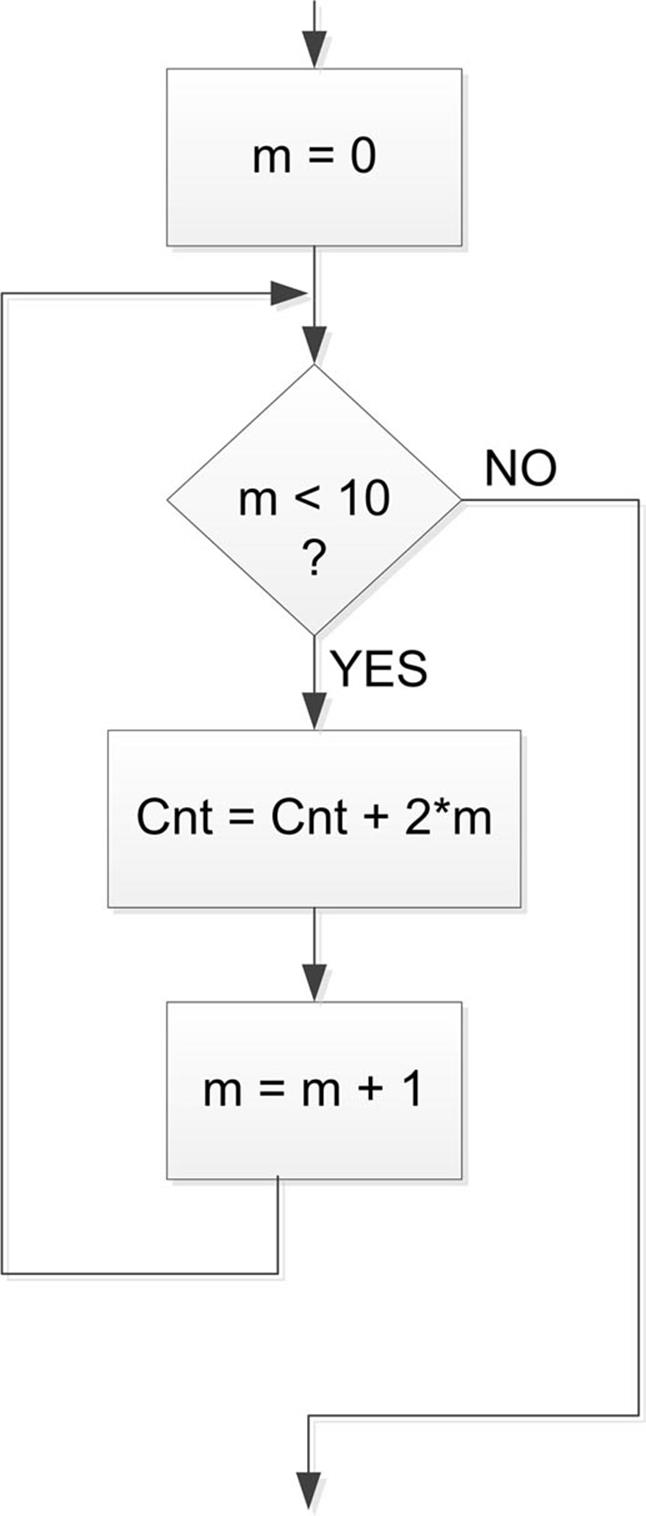
FIGURE 6.14 Method 1 for Representing a for Loop
6.3.2. Method 2
Figure 6.15 shows the second method for representing the for loop with a flow chart. Here, a hexagon-shaped flow chart symbol is used to represent the for loop and the complete for loop statement is written inside this symbol.
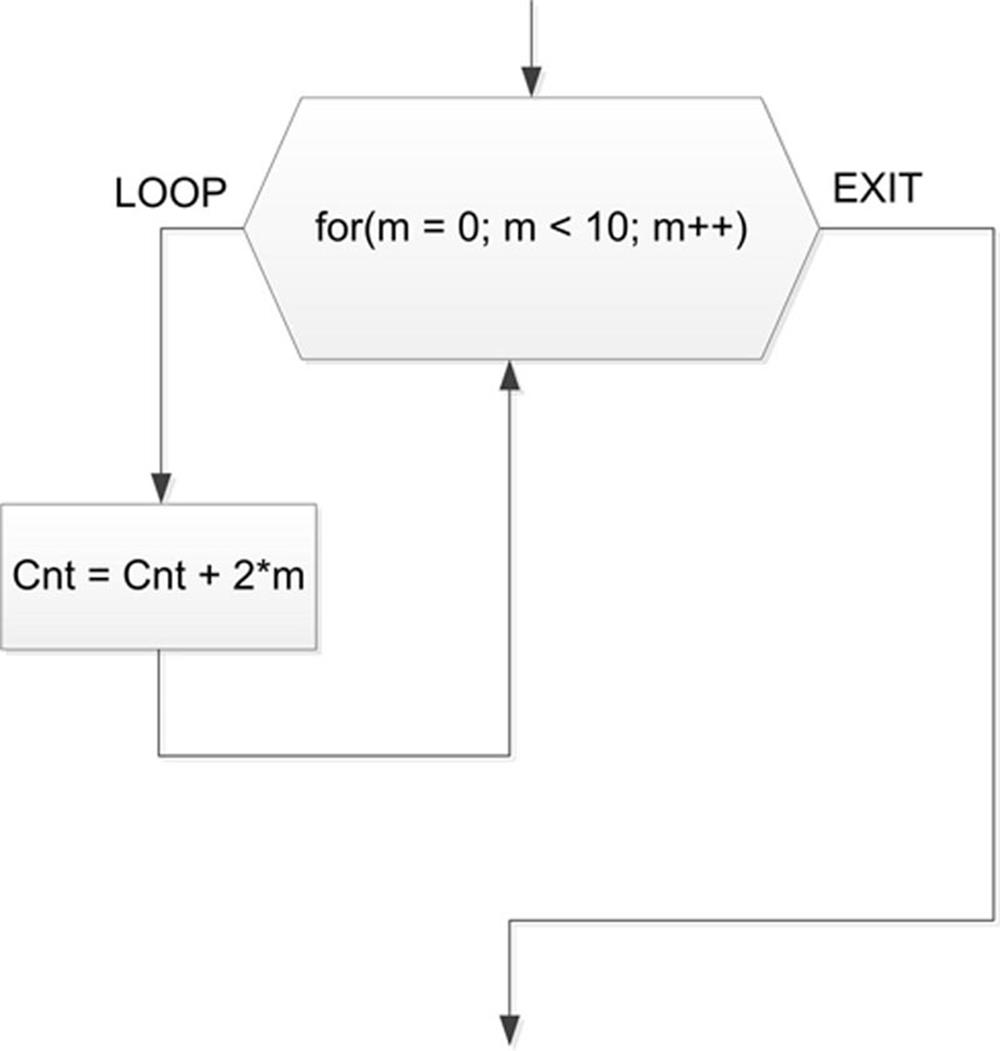
FIGURE 6.15 Method 2 for Representing a for Loop
6.3.3. Method 3
Figure 6.16 shows the third method for representing the for loop with a flow chart. Here again a hexagon-shaped flow chart symbol is used to represent the for loop and the symbol is divided into three to represent the initial condition, the increment, and the terminating condition.
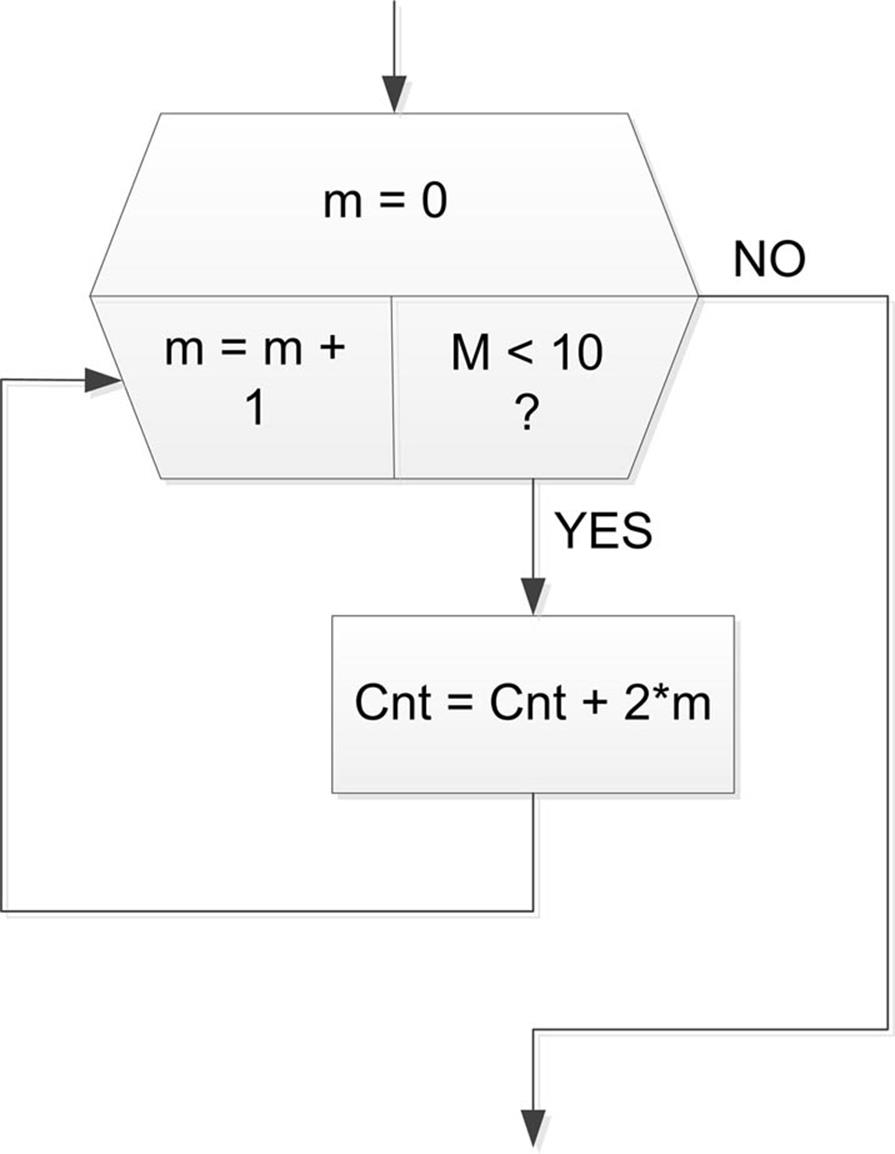
FIGURE 6.16 Method 3 for Representing a for Loop
6.4. Summary
This chapter has described the program development process using the Program description language (PDL) and flow charts as tools. The PDL is commonly used as it is a simple and convenient method of describing the operation of a program. It consists of several English-like keywords. Although the flow chart is also a useful tool, it can be very tedious in large programs to draw and modify shapes and write text inside them.
6.5. Exercises
1. Describe the various shapes used in drawing flow charts.
2. Describe how the various keywords used in PDL can be used to describe the operation of a program.
3. What are the advantages and disadvantages of flow charts?
4. It is required to write a program to calculate the sum of numbers from 1 to 10. Draw a flow chart to show the algorithm for this program.
5. Write the PDL statements for question (4).
6. It is required to write a program to calculate the roots of a quadratic equation, given the coefficients. Draw a flow chart to show the algorithm for this program.
7. Write the PDL statements for question (6).
8. Draw the equivalent flow chart for the following PDL statements:
9. It is required to write a function to calculate the sum of numbers from 1 to 10. Draw a flow chart to show how the function subprogram and the main program can be implemented.
10. Write the PDL statements for question (9).
11. It is required to write a function to calculate the cube of a given integer number and then call this function from a main program. Draw a flow chart to show how the function subprogram and the main program can be implemented.
12. Write the PDL statements for question (8).
13. Draw the equivalent flow chart for the following PDL statements: