Building Web Apps with Ember.js (2014)
Chapter 9. Ember Components
No matter what environment you find yourself working in, creating componentization and reuse of functionality is a common goal for development teams. Historically, achieving reuse has been difficult. First of all, building a piece of code generic enough to meet unknown requirements is rarely a complete success and takes years of experience, not to mention a wide view of the goals (past and future) of the product you are building. Also, until recently, there has not been a standard. So the technical options have been to make use of UI toolkits, iframes, or proprietary widget/gadget specifications.
The Web Components specification breathes new life into this challenge area by providing numerous related “subspecifications” (Custom Elements, Shadow DOM, HTML Imports) that can be used together to create standardized encapsulation of UI widgets.
Ember components follow the Web Components specifications closely, providing the essentials, or polyfilling, the necessary functionality in less capable browsers. The idea is that as browsers continue to adopt these specifications, Ember is smart enough to use the native functionality when it is available. So, developers can begin to write Web Components now, as “future-friendly” Ember components.
In this chapter, we will first build a simple component to demonstrate the basics. Then we will move into a more complex component that integrates a third-party library (in this case, D3.js) into the Ember application. To do so, we will continue working with our Yeoman managed application.
First, let’s take care of a bit of housekeeping. We are going to need to create a directory to include our components. So, let’s add app/scripts/components.
Then, we will need to add a require call to app/scripts/app.js to make sure Grunt’s build task picks up the new file and includes it in app/scripts/combined-scripts.js:
/* Order and include as you please. */
require('scripts/controllers/*');
require('scripts/components/*');
require('scripts/store');
require('scripts/models/*');
require('scripts/routes/*');
require('scripts/views/*');
require('scripts/router');
See the change in this commit.
NOTE
If you are using a later version of the Yeoman Ember generator, this may have already been done for you.
The Anatomy of an Ember Component
There are a few pieces to the component puzzle, but overall component creation is a really straightforward process. In this section, we will walk through the steps of turning an Activity content into a reusable component.
Create a Template
The first step is to decide on a name for your component, create the app/scripts/components directory, and add a new file named activity_log_component.js:
RocknrollcallYeoman.ActivityLogComponent = Ember.Component.extend({});
It is necessary to include a dash in the name per the proposed specification. This is intended to help prevent clashes with other native elements.
For our simple example, we can use this in templates/activity.hbs:
{{activity-log}}
In our example applications, we are using build tools, so we can create a new directory at templates/components, and populate it with a new Handlebars template named activity-log.hbs:
I am an Activity Log.
<hr>
In activity.hbs, we can loop through this template, based on the current model provided by the ActivityRoute’s model() hook:
{{#each}}
{{activity-log}}
{{/each}}
The log should now look like Figure 9-1.
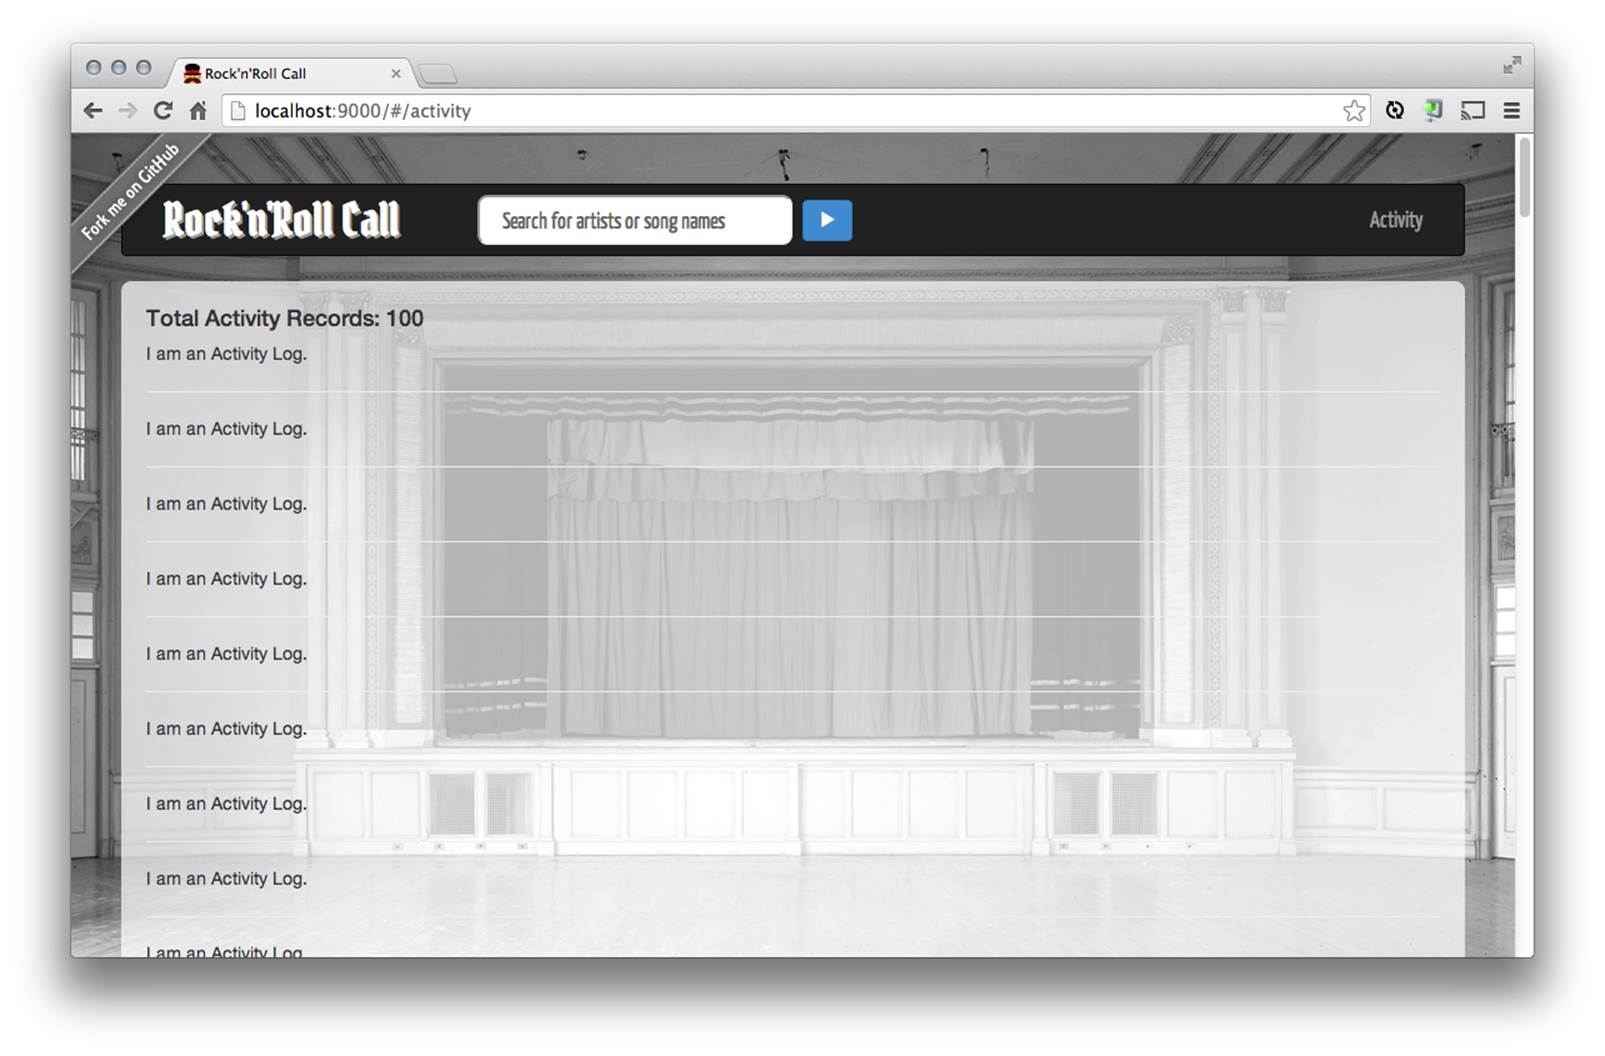
Figure 9-1. ActivityLog Ember component: simple text
See the change in this commit.
And, make the activity-log.hbs a little more complex by adding in the model’s properties:
<p> display_id: {{display_id}}</p>
<p> type: {{type}}</p>
<p> display_name: {{display_name}}</p>
<p> hotttnesss: {{hotttnesss}}</p>
<p> timestamp: {{timestamp}}</p>
<hr>
See the change in this commit.
In order to pull this off, we have to update the Handlebars as well by passing each property from the current template’s scope to the component.
We can change the property names here or just keep the same. For simplicity, we will just keep them all the same. In activity.hbs, add the following:
{{#each}}
{{activity-log display_id=display_id type=type display_name=display_name
hotttnesss=hotttnesss timestamp=timestamp }}
{{/each}}
See the change in this commit.
Now we should see the properties rendered, as in Figure 9-2.
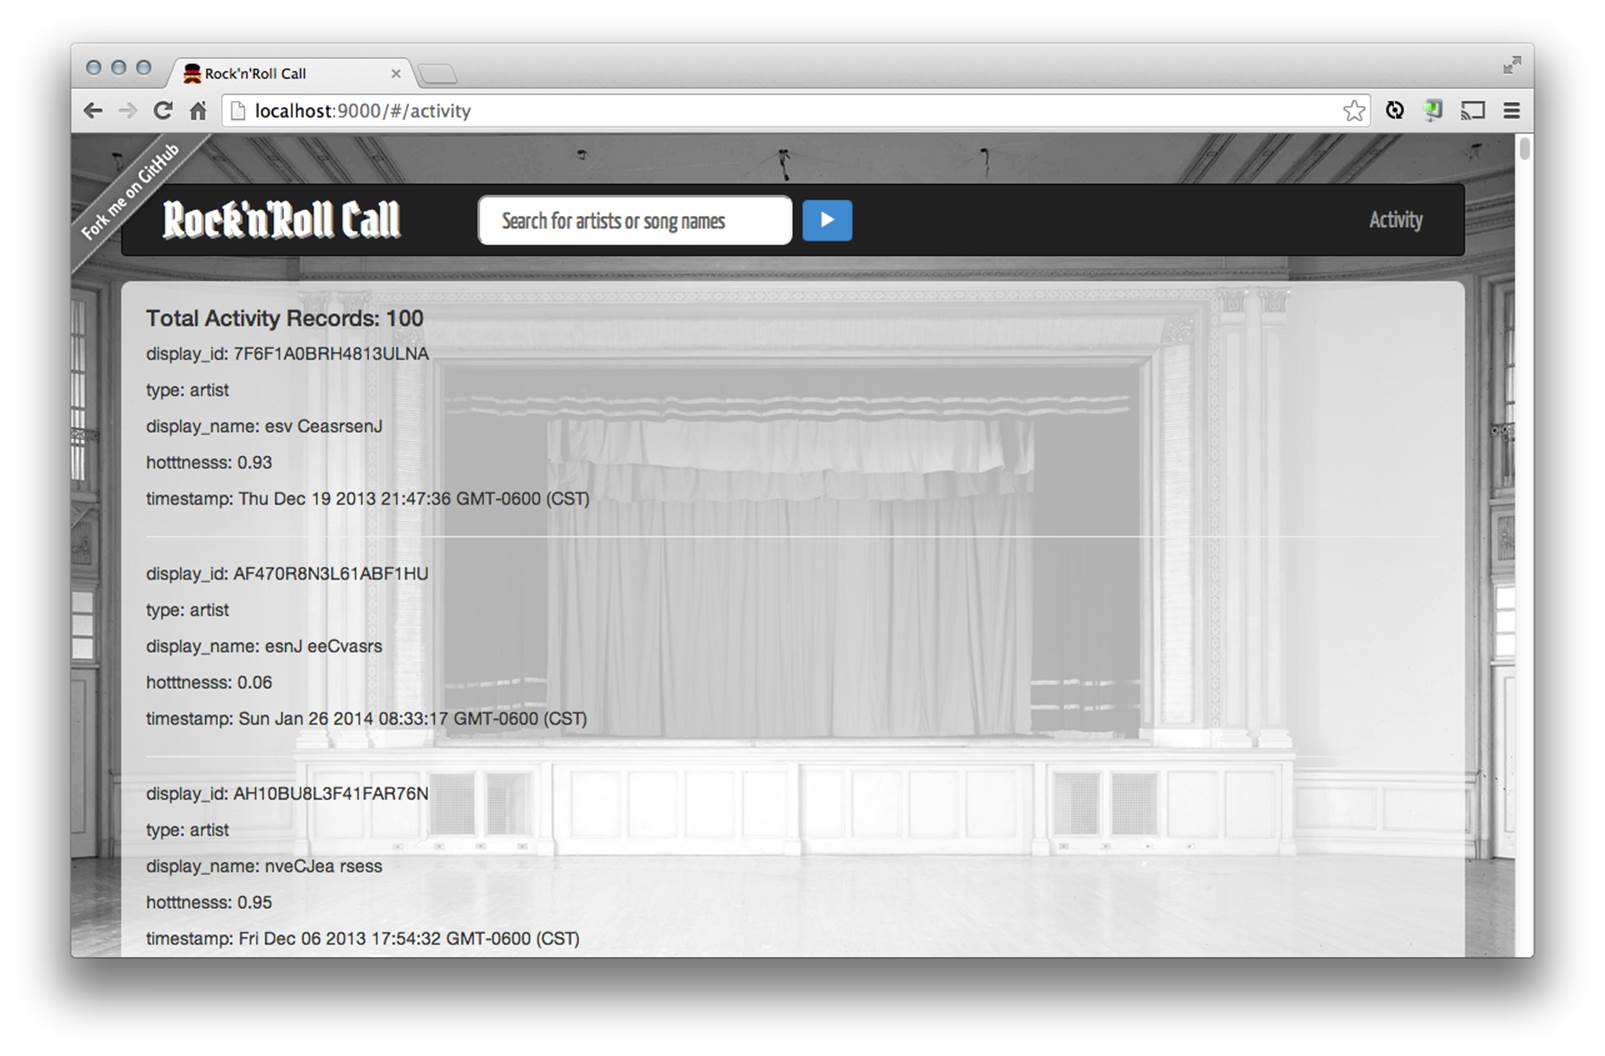
Figure 9-2. ActivityLog Ember component: model properties
Extending Ember.Component
Now, if we just wanted to wrap up static HTML into reusable, or even pass minimal properties through to our component’s scope, we can manage our Ember component all within our templates.
But, if we need to do a little more, such as changing the wrapping element, integrating with a third-party JavaScript library such as jQuery or D3, or handle actions similar to those presented earlier in this book, then we need to make use of extending the Ember.Component class.
Fortunately, naming conventions allow us to create a new subclass by removing the hyphen, camel-casing the class name, and adding Component on the end. Ember automagically knows which component it is referencing. For example, our previous example activity log would be subclassed as so:
RocknrollcallYeoman.ActivityLogComponent = Ember.Component.extend({});
Building a Heat Map Visualization with D3
Now that we know how to subclass, let’s take the same data we used for the ActivityLogComponent and create a custom heat-map animation using the D3.js visualization library. D3.js is a JavaScript library for manipulating HTML, SVG, and CSS based on data. For more on D3.js, check out the documentation.
First, we need to get the D3 library onto our page. So, we will make an update to our bower.json file, adding the latest from D3:
{
"name": "rocknrollcall-yeoman",
"version": "0.0.0",
"dependencies": {
"ember": "1.3.2",
"handlebars": "1.2.1",
"ember-data": "1.0.0-beta.5",
"ember-localstorage-adapter": "latest",
"bootstrap-sass": "~3.0.0",
"d3": "latest"
},
See the change in this commit.
Now, run:
$ bower install
And, finally add a script tag to the app/index.html file:
<script src="bower_components/d3/d3.js"></script>
See the change in this commit.
Now, we are interested in using the hotttnesss property and the timestamp property to build a heat-map grid that includes “Days of the Week” on the y-axis, and “Times of the Day” on the x-axis. Each square in the grid reprensents an hour of a specific day. The color of the square depicts the hotttnesss of your last search within the hour, dark being lower on the hotttnesss scale and lighter being higher on the scale. A color legend is also included to aid the viewer.
We are not going to discuss the internals of D3 here, as it is out of scope for this book. The intention of this example is to show how to integrate a third-party library like D3 into your component.
So let’s get started with the basic structure of our Component subclass. The top of our class declaration will be used to manage specific properties that we can reference from within the two methods: draw() and didInsertElement().
didInsertElement() is called when the outer element of the component has been inserted into the DOM. So we can override this function to do any set up that requires accessing an element in the document body. Here, we will get the data from the controller and pass it to draw.
draw() contains the majority of the D3-specific logic. If you’re following along, you’ll begin to see that this pattern could be used for many different types of visualizations that take data as an input and pass that data to render() or draw() logic:
RocknrollcallYeoman.HeatMapComponent = Ember.Component.extend({
width: 900,
height: 280,
draw: function(myData){
// draw the heat map
},
didInsertElement: function(){
var data = this.get('controller.data.content');
this.draw(data);
}
});
Before we pass the data to draw(), we can “prep” it a bit to translate it into an array. This is a common thing to do, and didInsertElement() is an acceptable place to perform this logic:
RocknrollcallYeoman.HeatMapComponent = Ember.Component.extend({
width: 900,
height: 280,
draw: function(myData){
// draw the heat map
},
didInsertElement: function(){
var data = this.get('controller.data.content');
var hotnessArray = [];
for (var i=0;i<data.length;i++) {
var date = new Date(data[i].get('timestamp'));
var row = {};
row.day = date.getDay() + 1;
row.hour = date.getHours() + 1;
row.value = data[i].get('hotttnesss');
hotnessArray.push(row);
}
this.draw(hotnessArray);
}
});
So, as we did in our simple ActivityLogComponent, we can create a Handlebars template at templates/components/heat-map.hbs.
Within this template, all we will need is a div element with an id:
<div id="chart"></div>
Now we can add the helper to templates/activity.hbs:
{{heat-map data=model}}
Here is the finished HeatMapComponent. As you can see, our D3 logic is encapsulated nicely inside of the draw() method. Now, add this to app/scripts/components/heat_map_component.js:
RocknrollcallYeoman.HeatMapComponent = Ember.Component.extend({
margin: { top: 50, right: 0, bottom: 100, left: 30 },
width: 900,
height: 280,
gridSize: 37,
legendElementWidth: 100,
buckets: 9,
colors: ["#2F0000","#661201","#911900","#B22604","#CB3804","#F25B02",
"#F2720D","#FFA321","#FAC40A"], // alternatively colorbrewer.YlGnBu[9]
days: ["Mo", "Tu", "We", "Th", "Fr", "Sa", "Su"],
times: ["1a", "2a", "3a", "4a", "5a", "6a", "7a", "8a", "9a", "10a", "11a", "12a", "1p",
"2p", "3p", "4p", "5p", "6p", "7p", "8p", "9p", "10p", "11p", "12p"],
draw: function(myData){
var self = this;
this.set('data',myData);
var svg = d3.select('#'+self.get('elementId'));
var colorScale = d3.scale.quantile()
.domain([10, 100])
.range(self.colors);
var svg = d3.select("#chart").append("svg")
.attr("width", self.width + self.margin.left + self.margin.right)
.attr("height", self.height + self.margin.top + self.margin.bottom)
.append("g")
.attr("transform", "translate(" + self.margin.left + "," + self.margin.top + ")");
var dayLabels = svg.selectAll(".dayLabel")
.data(self.days)
.enter().append("text")
.text(function (d) { return d; })
.attr("x", 0)
.attr("y", function (d, i) { return i * self.gridSize; })
.style("text-anchor", "end")
.attr("transform", "translate(-6," + self.gridSize / 1.5 + ")")
.attr("class", function (d, i) { return ((i >= 0 && i <= 4) ?
"dayLabel mono axis axis-workweek" : "dayLabel mono axis"); });
var timeLabels = svg.selectAll(".timeLabel")
.data(self.times)
.enter().append("text")
.text(function(d) { return d; })
.attr("x", function(d, i) { return i * self.gridSize; })
.attr("y", 0)
.style("text-anchor", "middle")
.attr("transform", "translate(" + self.gridSize / 2 + ", -6)")
.attr("class", function(d, i) { return ((i >= 7 && i <= 16) ?
"timeLabel mono axis axis-worktime" : "timeLabel mono axis"); });
var heatMap = svg.selectAll(".hour")
.data(self.data)
.enter().append("rect")
.attr("x", function(d) { return (d.hour - 1) * self.gridSize; })
.attr("y", function(d) { return (d.day - 1) * self.gridSize; })
.attr("rx", 4)
.attr("ry", 4)
.attr("class", "hour bordered")
.attr("width", self.gridSize)
.attr("height", self.gridSize)
.style("fill", self.colors[0]);
heatMap.transition().duration(1000)
.style("fill", function(d) { return colorScale(d.value); });
heatMap.append("title").text(function(d) { return d.value; });
var legend = svg.selectAll(".legend")
.data([0].concat(colorScale.quantiles()), function(d) { return d; })
.enter().append("g")
.attr("class", "legend");
legend.append("rect")
.attr("x", function(d, i) { return self.legendElementWidth * i; })
.attr("y", self.height)
.attr("width", self.legendElementWidth)
.attr("height", self.gridSize / 2)
.style("fill", function(d, i) { return self.colors[i]; });
legend.append("text")
.attr("class", "mono")
.text(function(d) { return "≥ " + Math.round(d*10)/10; })
.attr("x", function(d, i) { return self.legendElementWidth * i; })
.attr("y", self.height + self.gridSize);
},
didInsertElement: function(){
var data = this.get('controller.data.content');
var hotnessArray = [];
for (var i=0;i<data.length;i++) {
var date = new Date(data[i].get('timestamp'));
var row = {};
row.day = date.getDay() + 1;
row.hour = date.getHours() + 1;
row.value = data[i].get('hotttnesss');
hotnessArray.push(row);
}
this.draw(hotnessArray);
}
});
See the change in this commit.
And now our HeatMapComponent shows the Activity model data we created in Chapter 8, as shown in Figure 9-3.
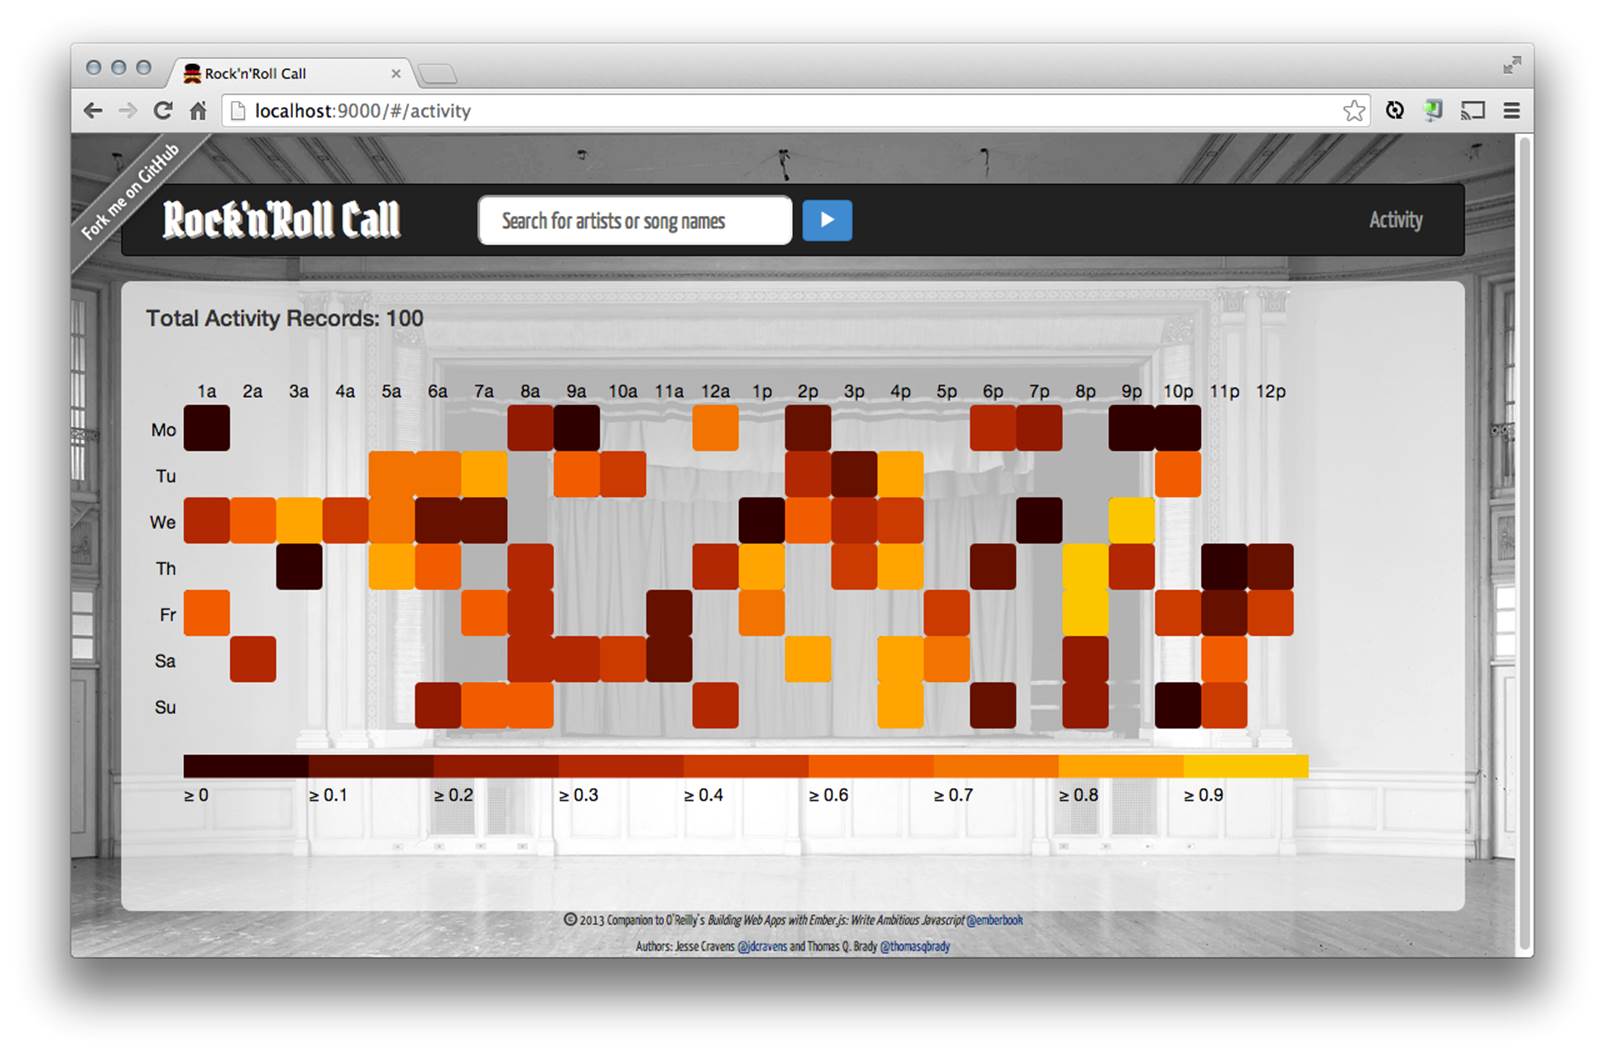
Figure 9-3. D3 Ember HeatMapComponent
Wrapping Things Up
As you can see, by following web standards, the Ember team has given us an elegant way to write reusable, encapsualted widgets that can make our applications more maitainable and easier to extend moving forward. If you have tried to write maintainable, production code, you know this is typically a high priority for most technical teams and rarely easy to do.
In the next and final chapter, we will address another important concept for production-ready applications: testing.
All materials on the site are licensed Creative Commons Attribution-Sharealike 3.0 Unported CC BY-SA 3.0 & GNU Free Documentation License (GFDL)
If you are the copyright holder of any material contained on our site and intend to remove it, please contact our site administrator for approval.
© 2016-2026 All site design rights belong to S.Y.A.