RaphaelJS: Graphics and Visualization on the Web (2014)
Chapter 6. Maps, Illustrations, and Other Artifacts
I keep promising that Raphael is about more than revisiting memories of high school geometry (something that is always best accomplished with a therapist’s supervision). Right now seems like a fine time to make good on that since we’ve covered all of the core skills for image manipulation.
Let’s dive right in to what is, in my experience, the most common data visualization on the web: a map that can be recolored on demand to represent a geographical dataset. We’ll start with a map of the United States, and then run over how this can be easily extended to any country you’re interested in.
Maps
Geographic entities are represented in the browser just like any other shape, as a series of points connected by lines. Colorado, for example—to choose a rather easy one—looks like this:
var CO = paper.path("m 380,320.9l4.9,-86.3l-113.4,-12.6l-12.2,
87.9l 120.7,11.0z");
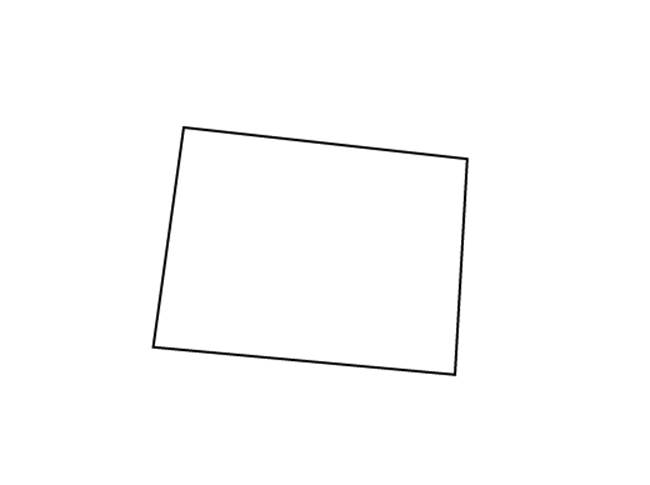
(We think of Colorado as a straight rectangle, but here it comes from a map that mimcs the curvature of the earth, hence the tilt.)
So did I memorize the coordinates for all 50 states and then type them in here by hand? Of course not! Like most good things, this comes from Wikipedia. But we don’t want a map on Wikipedia. We want one on our own website. Let’s talk about how to import that information into Raphael.
Importing SVGs Found in Nature
When it comes to finding structural data for visualizations on the Web, one can generally rely on these laws:
1. There is roughly a 100% chance the information exists for free.
2. There is roughly a 0% chance it’s in the format you need it to be in.
Case in point. Wikipedia has a very fine "Blank Map of US States" SVG file that contains all the coordinates we need:
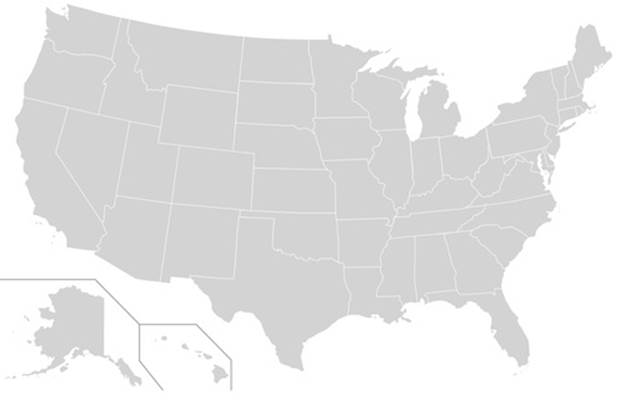
We must reverse-engineer that SVG back into JavaScript code so that we can render it dynamically and then mess with it.
This is not, unfortunately, a feature that Raphael natively offers. If you’re a JavaScript jock who enjoys parsing DOM structures—those people do exist—you could fairly easily write some code to load the SVG file dynamically on the page and extract the coordinates. If you’re not, you’re in luck: many fine tools, most of them open-source, exist to help us extract the coordinates from SVG files (my favorite is ReadySetRaphael). Let’s try it.
After downloading the SVG file from Wikipedia to my desktop, I went to ReadySetRaphael and uploaded it. A second later, I get 50-some lines of beautiful JavaScript that look like this:
var rsr = Raphael('rsr', '959', '593');
var HI = rsr.path("m 233.08751,519.30948 1.93993,-3.55655 2.26326,-0.32332 0.32332,0.8083 ...
HI.attr({id: 'HI',class: 'state','stroke-width': '0','stroke-opacity': '1',
'fill': '#000000'}).data('id', 'HI');
var AK = rsr.path("m 158.07671,453.67502 -0.32332,85.35713
1.6166,0.96996 3.07157,0.16166 1.45494,...
AK.attr({id: 'AK',class: 'state','stroke-width': '0','stroke-opacity':
'1','fill': '#000000'}).data('id', 'AK');
//and so forth
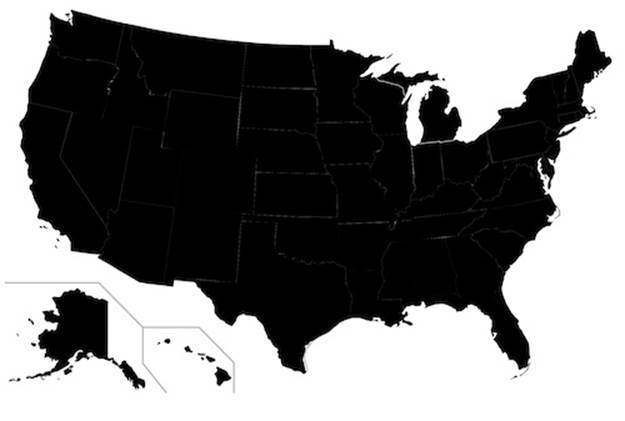
I’ve obviously truncated the lines here, but this is looking good. ReadySetRaphael is even smart enough to figure out what to name the variables based on the ids of the SVG elements. You can paste all of this code into a page with the Raphael library loaded, add a <div id=rsr></div> to contain the objects, and you will get this:
See this code live on jsFiddle.
If your goal was to make a JavaScript commentary on the dire state of America by coloring it all black, congratulations—you’re done! If not, read on.
I sized this screenshot down to fit on the page, but in reality it’s about 950 pixels wide, just like the original. As you can see, ReadySetRaphael is imperfect, since it didn’t preserve the gray coloring of the original. But it’s still a phenomenally useful tool. The first $10 in profits for RaphaelJS, if there are any, are going straight to this site’s donation page.
Imperfect though it may be, we can work with this. We can even load it in Internet Explorer 8 and see the SVG we downloaded render in VML. Now that it’s rendered on the page, it has entered our sphere of influence.
Manipulating SVGs Found in Nature
There are a few things I don’t love about the raw JavaScript we get from ReadySetRaphael. It takes the liberty of making a new master Raphael object, rsr, but in reality we probably already made one. It also declares a new variable for every state. Generally speaking, you don’t want to pollute the page with lots of variable names, particularly if there are other JavaScript libraries outside of your control firing off left and right. (For all you know, the web analytics script has a PA variable for “page analysis”, or whatever, that will get overwritten by Pennsylvania.) But I also don’t want to do a lot of work editing the raw output of ReadySetRaphael, since I’d like to be able to use it often and with minimal tedium. So I’m going to do something a little clever: delete the first line, which declares rsr, then wrap the entire thing in a function, which consigns all the variables to the function’s scope, and pass that function an object called rsr:
function drawUS(rsr) {
var HI = rsr.path("m 233.08751,519.30948 1.93993,-3.55655 2.26326,-0.32332 0.32332,0.8083 ...
HI.attr({id: 'HI',class: 'state','stroke-width': '0','stroke-opacity': '1','fill': '#000000'}).data('id', 'HI');
var AK = rsr.path("m 158.07671,453.67502 -0.32332,85.35713 1.6166,0.96996 3.07157,0.16166 1.45494,...
AK.attr({id: 'AK',class: 'state','stroke-width': '0','stroke-opacity': '1','fill': '#000000'}).data('id', 'AK');
// etc etc
}
This allows me to do this:
var paper = Raphael(0, 0, 1000, 600);
drawUS(paper);
If you don’t like all those coordinates in the body of your program—I sure don’t—you can just stick it in a file like usmap.js and call it after you summon Raphael.
This leaves us with a bit of a problem, however, because we don’t really have a way to get the states back in order to resize and recolor them. We could crawl the DOM to relocate them, but that would completely defeat the purpose of Raphael. What we need is to add them all to a set.
I suppose we could take all that JavaScript from ReadySetRaphael and perform an elaborate find-and-replace command. As a rule, I like to avoid this sort of thing because it’s tedius and it’s hard to remember how to do the next time. Once again, there’s a Raphael command to help out. It’s called .setStart(), and until this very moment I never thought I’d see the day it was useful.
When you call paper.setStart(), it begins “recording” and adds every new element defined after that point to a set up until you call .setFinish(). The assignment for the set occurs at the end, like so:
var paper = Raphael(0, 0, 1000, 600);
paper.setStart();
drawUS(paper);
var mymap = paper.setFinish();
I don’t like this syntax much. In fact, I suspect it exists to make people coming from Flash and ActionScript feel more at home. But it’s really our easiest option at this point.
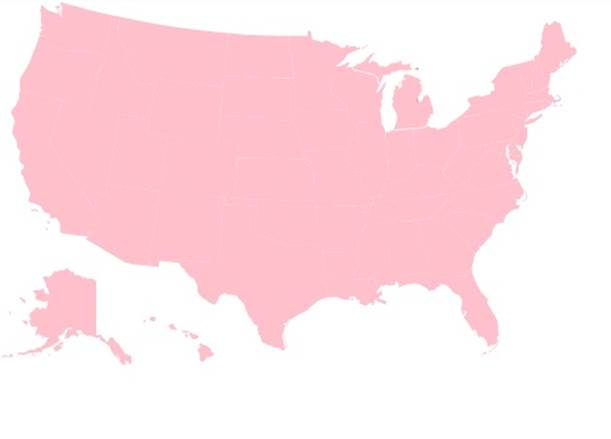
Now that we have all the states in one set, we can manipulate them. Let’s try and recolor the map and resize it down by half, with brazen disregard for whether it will work:
mymap.attr({
fill: "pink",
transform: "S0.5,0.5"
});
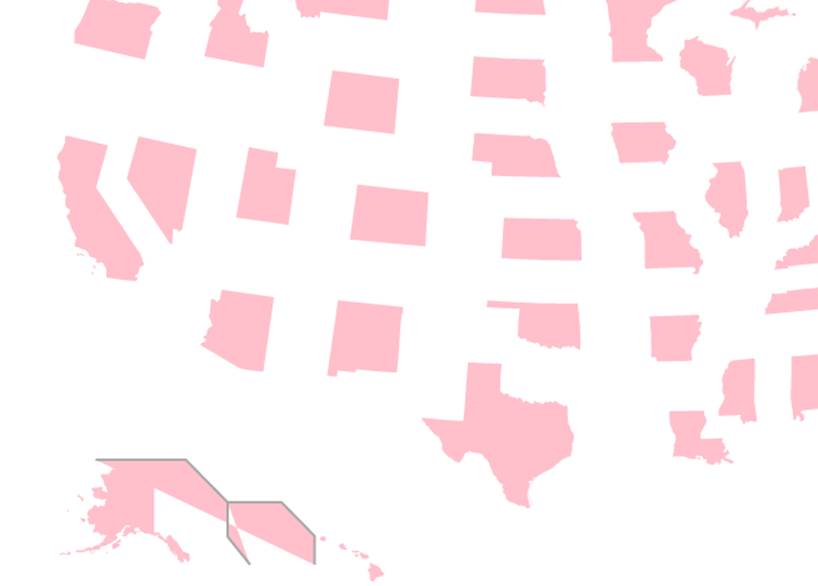
I see two problems. There are some strange triangles getting filled in around Hawaii and Alaska. Also, all of the states are in the wrong place. These are both problems we can handle.
Those rogue lines are pretty easy to find in the source from ReadySetRaphael since they don’t have a proper name:
var path57 = rsr.path("m 211,493 v 55 l 36,45 M 0,425 h 144 l 67,68 h 86 l 53,54 v 46"); path57.attr({id: 'path57',fill: 'none',stroke: '#a9a9a9',"stroke-width": '2','stroke-opacity': '1'}).data('id','path57');
Let’s delete them.
The other problem stems from the fact that we did not provide an anchor for the scaling, forcing Raphael to choose one for us. Raphael chose the center of each state. As you may recall, that’s best remedied by adding two more coordinates to the transformation string:
mymap.attr({
fill: "pink",
transform: "S0.5,0.5,0,0"
});
Much better:
See this code live on jsFiddle
Now to add some data.
Adding Information
I would like to visualize the unemployment rate for each state, according to the Bureau of Labor Statistics—a problem you’ll never have to deal with after becoming a Raphael master. You can visualize anything you want, but it’s your job to organize that data so that every number is associated with a two-letter state abbreviation. Believe it or not, the United States government doesn’t offer the information in a neat JSON format, so I copied the information from BLS by hand and delimited it with a | character. There are better ways to do it, but this is fine:
var rates = {};
// split the data into tab-delimited pairs of abbreviations and numbers
var data = "ND 3|SD 3.9|NE 4.2|HI 4.5|UT 4.6|VT 4.6|WY 4.6|IA 4.8|NH 5.1|MN 5.2|MT 5.3|OK 5.3|VA 5.7|KS 5.9|WV 6.2|AL 6.3|AK 6.3|TX 6.5|ID 6.6|WI 6.8|ME 6.9|NM 6.9|WA 6.9|LA 7|CO 7.1|FL 7.1|MD 7.1|MO 7.1|MA 7.2|OH 7.2|AR 7.4|DE 7.4|NY 7.5|PA 7.5|AZ 8|OR 8|CT 8.1|SC 8.1|IN 8.4|KY 8.5|MS 8.5|TN 8.5|DC 8.6|NJ 8.6|CA 8.7|GA 8.8|MI 8.8|NC 8.9|RI 8.9|IL 9.2|NV 9.5".split("|");
// stick each value into an object with the state as the key
for (var c = 0; c < data.length; c += 1) {
rates[data[c].split("\t")[0]] = parseFloat(data[c].split("\t")[1]);
}
We’re almost done. The last thing we need is a color scheme (for which I always go to ColorBrewer2) plus a calculation to translate the number into a shade. Then we’ll simply loop through the states, find the right data point, and color it accordingly. ReadySetRaphael has helpfully assigned the id value of each original SVG object to the .data() property we previously covered, so it’s easy to get back.
var colors =
["#f7fcf0","#e0f3db","#ccebc5","#a8ddb5","#7bccc4","#4eb3d3",
"#2b8cbe","#08589e"];
// iterate through the states
for (var i = 0; i < mymap.length; i += 1) {
// retrieve the state abbreviation from the object
var abbr = mymap[i].data('id');
var unemp_rate = rates[abbr];
// transform the rate (which varies from 3 to 9.5)
// into a 0-7 index for the color array
var index = Math.round(unemp_rate) - 3;
var color = colors[index];
mymap[i].attr("fill", color);
}
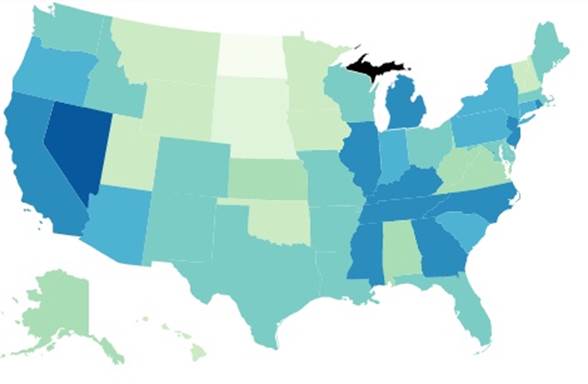
The only thing I see wrong here is that Michigan’s Upper Peninsula has seceded from the United States. ReadySetRaphael got a little confused here and gave it the id SP, for what, I have no idea. Change that data value to MI and you’ll be just fine. I’ll spare you yet another screenshot.
See this code live on jsFiddle.
Interlude: Raphael vs. D3
What we’ve done here is informally bind a dataset to collection of visual objects—the basic, holy work of data visualization. This is not necessarily the core purpose of Raphael, but it is, in my experience, its most utilitarian use.
It is the core purpose of D3, which, after all, stands for “data-driven documents.” If your ambition is to do lots of sophisticated data projects, you may eventually discover that D3 is worth the extra effort and steeper learning curve (I use it all the time for more stats-heavy projects). If you do, you’ll heartily thank me for starting you off this way, because the concept is nearly identical: you’re taking data and using it to guide the color, shape, or location of an object on the screen.
The vast majority of mapping projects, however, do not require industrial-level JavaScript. For those, the approach outlined in this chapter works beautifully in all browsers.
Case Study: Paint by Numbers
Many sites allow you to customize a little cartoon avatar to represent yourself in your transactions, and we’re nearly at the point where that’s possible purely with Raphael. This demo is going to allow you to recolor any SVG you like right in the browser.
The first thing we’ll need is a color palette. There are many sophisticated plug-ins you can download and use, often in conjunction with jQuery, but for our purposes I think we should build our own.
For that, I’d like to introduce a handy Raphael function called .hsl(), which stands for “hue, saturation, lightness.” It’s an alternative to the more common RGB system of representing colors in the browser, and accepts three values from zero to one.
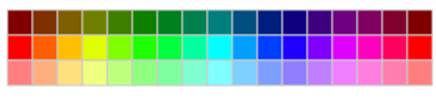
It’s convenient for us here because we can create a range of colors for our selector in a loop. This is best explained with an example:
var paper = Raphael(0, 0, 500, 500);
var colors = paper.set();
for (var c = 0; c < 16; c += 1) {
for (var i = 0; i < 3; i += 1) {
colors.push(
paper.rect(10 + c * 20, 10 + i * 20, 20, 20)
.attr({
fill: Raphael.hsl(c / 16, 1, (i+1)/4),
stroke: "#CCC"
})
);
}
}
This pair of nested loops creates 48 (16 × 3) colors of a range of shades and lightnesses, all with full saturation:
To complete my color pickers, I’m going to make a big box to represent the currently selected color and add an event listener to the smaller ones to update the selected value when clicked:
var selected_color = "red";
var selected_color_box = paper.rect(10 + 17 * 20, 10, 60, 60).attr({
fill: "red",
stroke: "#CCC"
});
colors.click(function() {
selected_color = this.attr("fill");
//reset all borders to gray
colors.attr("stroke", "#CCC").attr("stroke-width", 1);
//set selected color's border to heavier black.
//bring to front so wider stroke width isn't clipped by neighbors
this.attr("stroke", "#000").attr("stroke-width", 2).toFront();
//update the big box
selected_color_box.attr("fill", selected_color);
});
See this code live on jsFiddle.
This modest tool leaves something to be desired (like black, white and gray), but it’s not bad for a minute’s work.
Now we’re going to add an SVG from the Internet. I’m choosing a picture of a scientist from Clker, my favorite royalty-free clip art site, but you can choose absolutely any SVG you want.
After running the SVG through ReadySetRaphael, we need to once again wrap it in a function, set the .setStart() and .setFinish() functions to the beginning and end, and return that set, exactly as we did for the map.
function person(rsr) {
rsr.setStart();
// all the output from ReadySetRaphael
return rsr.setFinish();
}
var scientist = person(paper);
Then, all we need to finish is a single event handler:
scientist.click(function() {
// remember, "this" refers to the individual element clicked, not the whole scientist
this.attr("fill", selected_color);
});
Just like that, we can allow any visitor to our site to live-edit the colors of any SVG we provide. I’ll leave you with the results of my own handiwork, which looks to me like nothing so much as a rejected idea for a Scooby Doo villain.

See this code live on jsFiddle.
All materials on the site are licensed Creative Commons Attribution-Sharealike 3.0 Unported CC BY-SA 3.0 & GNU Free Documentation License (GFDL)
If you are the copyright holder of any material contained on our site and intend to remove it, please contact our site administrator for approval.
© 2016-2026 All site design rights belong to S.Y.A.