JavaScript and jQuery for Data Analysis and Visualization (2015)
PART II Working with JavaScript for Analysis
Chapter 7 Examining and Sorting Data Tables
What's in This Chapter
· Learning the Anatomy of an HTML table
· Styling an HTML table with CSS
· Learning about semantic markup
· Using JavaScript and jQuery to dynamically style and edit tables
· Using the DataTables jQuery plug-in to make dynamic tables easy
CODE DOWNLOAD The wrox.com code downloads for this chapter are found at www.wrox.com/go/javascriptandjqueryanalysis on the Download Code tab. The code is in the chapter 07 download and individually named according to the names throughout the chapter.
Although charts, maps, and other graphically rich representations might be the first things that come to mind when you consider the term data visualization, a primary workhorse for displaying and analyzing data has always been the data table. Furthermore, a well-designed chart might represent a concise way to tell a story about your data to most users, but it can present a difficult obstacle to the visually impaired. Thankfully, a properly marked-up data table can carry enough unambiguous meaning that a specially designed piece of software known as a screen reader can convert the visual matrix of data into easy-to-digest text-to-speech or Braille content.
Data tables represent an interesting lowest common denominator in terms of in-browser data visualization. Not only can you mark them up for maximum readability and accessibility but every commonly used browser has at least a basic ability to display data tables, even if you intentionally disable extraneous features. Given this, you can apply a design strategy to begin with this base level of support and then to progressively enable more advanced features if the current user agent supports them. In this way, all users have some access to your content, but the users with more capable browsers receive an enhanced view. This strategy is usually referred to as progressive enhancement.
Outputting Basic Table Data
In Chapter 4, you saw several techniques for using JavaScript to load data asynchronously downloaded from web servers and build HTML tables dynamically on the client. These strategies are useful and powerful, but they have the distinct problem that if the user's browser does not support JavaScript, or if the user has intentionally configured the browser to not execute JavaScript, then you are not able to present them with any data. Meanwhile, if the data table is a static part of the page or is injected into the page by logic on the server side, then it is observable even by base-level user agents or user agents with deliberately constrained capabilities.
Building a Table
In HTML, you use the <table> element to render data in tabular format. When you think of a table, visually, you assume that it contains both rows and columns that intersect in a grid, but when you describe a table in HTML markup, it is surprisingly row-oriented. You describe each row contained in the table and all the cells contained in each row, whereas information about the columns contained in the table is mostly inferred (that is, unless you decide to describe information about the columns more explicitly, as discussed later in this chapter). In fact, there is a great deal of inference going on in how browsers interpret a table element, so you must be careful if you want to build a maximally accessible table.
NOTE The <table> element can also be used for layout purposes; it was actually quite often used for this purpose in the early web. This practice has fallen out of favor, for most scenarios, since the introduction of Cascading Style Sheets (CSS). In general, you should check if there is a simpler and cleaner way to achieve your goals using CSS (there generally is) before resorting to using a table for layout purposes.
Each row of the <table> is expressed as a <tr> (table row) element, and each cell within the row is indicated by a <td> (table data) element.
Repurposing the sales data discussed in Chapter 2 and converting it into an HTML table, you get the markup shown in Listing 7-1.
Listing 7-1
<!DOCTYPE html>
<html>
<head>
<title>Simple Table</title>
</head>
<body>
<table>
<tr>
<td>Region</td>
<td>Sales</td>
<td>Mean</td>
</tr>
<tr>
<td>Northeast</td>
<td>$100,000</td>
<td>$142,857</td>
</tr>
<tr>
<td>Southeast</td>
<td>$75,000</td>
<td>$142,857</td>
</tr>
<tr>
<td>Midwest</td>
<td>$125,000</td>
<td>$142,857</td>
</tr>
<tr>
<td>Mid-Atlantic</td>
<td>$125,000</td>
<td>$142,857</td>
</tr>
<tr>
<td>Southwest</td>
<td>$75,000</td>
<td>$142,857</td>
</tr>
<tr>
<td>Northwest</td>
<td>$100,000</td>
<td>$142,857</td>
</tr>
<tr>
<td>California</td>
<td>$400,000</td>
<td>$142,857</td>
</tr>
</table>
</body>
</html>
The code in Listing 7-1 results in the table displayed in Figure 7.1. You can find the MostSimpleTable.html file on the companion website.
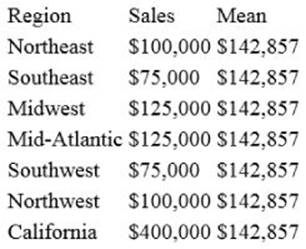
Figure 7.1 This table is very basic.
Notice that the table displayed in Figure 7.1 is not very attractive. This can actually be considered to be “by design.” Why? Modern HTML provides good separation of semantic markup from presentation, so, ideally, your markup should describe only the content of your page, and your CSS defines the presentation aspects. Because we have not added any CSS rules that target the elements of the data table in this example, you should not be especially surprised that its presentation is currently a bit lackluster.
NOTE Early versions of HTML muddied the waters when it came to separation of content and presentation. For example, the <font> tag enabled you to apply a font of your selection to a section of text. Now, however, you would use CSS to define this sort of presentation property. The <font> tag and a few other presentation-related element types were deprecated in HTML version 4.01 and removed, finally, in HTML5. This provides additional evidence that HTML should solely define content and semantics, whereas presentation should be delegated to CSS.
You see how to improve the styling of the table later in this chapter, but first, consider another issue with this table. The semantics of the table content are very unclear. There is an implication that the first (top) row contains cells that represent the headers for the columns below each of them. There is also an implication that the first cell in each row describes the subsequent row content. These are mere inferences, however, and although it may be easy for someone who's looking at this table to draw these inferences, it is not necessarily straightforward for a piece of software (a software agent) or a visually impaired person to do so. Furthermore, when using CSS selectors to style the content of this table, there is no simple way for the styling rules to distinguish between the different types of cells present.
Using Semantic Table Markup
You can solve the problems with the table shown in Figure 7.1 by better defining the semantics, or meaning, of each piece of markup in the table. If the cells in the first row are meant to be the headers of the columns that they top, then you can make this explicit by utilizing the <th> element rather than the <td> element.
<tr>
<th>Region</th>
<th>Sales</th>
<th>Mean</th>
</tr>
Now it is clear and unambiguous that you are providing table headers, and not simply another row of data. You can see in Figure 7.2 that changing these cells to be table headers has actually made a small visual difference in the output. Despite the content and presentation separation principles you want to strive for, the browsers do have some presentation defaults associated with some semantic markup elements. In the case of table headers, they default to being bold and centered in their cells, but you can, of course, redefine how table headers are presented using CSS.
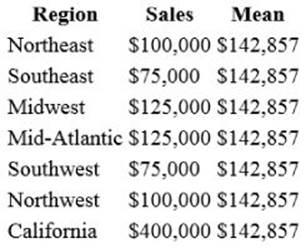
Figure 7.2 Semantic table header elements make a small difference in the output.
You can find the SimpleTable.html file on the companion website.
Surprisingly, table headers are valid when placed anywhere in the table, but it is important to use them only in places where they make sense contextually and to think about how a screen reader might process a table's content to read it aloud. For example, applying the <th> element simply because you want values to be bolded and centered is a poor use of the element.
In the regional sales table from the example, it would actually make sense to treat each region name as a header for the row, which is perfectly valid markup:
<tr>
<th>Northeast</th>
<td>$100,000</td>
<td>$142,857</td>
</tr>
But now you've constructed a scenario where you have two different sets of headers, and it isn't necessarily obvious which table cells are associated with which headers. It is recommended you resolve these ambiguities by adding scope attributes to the header elements. If you amend your header to read
<th scope="row">Northeast</th>
it will make no difference from the standpoint of default presentation, but you've now made it clear to screen readers (and your CSS selectors, as you see later) that every cell in the same row with that header is owned by that header. Similarly, you can amend the column headers to read
<th scope="col">Region</th>
<th scope="col">Sales</th>
<th scope="col">Mean</th>
which ensures that every cell in the same column with such a header is owned by that header. So, for example, when you come to the cell in the table that reads $400,000, a screen reader or other software agent would know, unambiguously, that this value is owned by the column header Sales and also the row header California.
NOTE It's worth noting that it is not only screen readers and CSS selectors that can benefit from enriching the semantic content of a table. A web crawler for a search engine might be able to use the extra meaning provided to improve the indexing of the content, or your browser might be able to more effectively break up a table between pages when printing when given a greater understanding of the table's anatomy.
There are other pieces of semantic markup that can be applied to parts of the table to clarify the intent of the table designer. Although replacing the <td> elements in the first row with <th> removed a lot of ambiguity from the table layout, you can be much more clear about the different sections of the table by splitting the content into three semantic sub elements—<thead>, <tbody>, and <tfoot>—as shown in Listing 7-2.
Listing 7-2
<!DOCTYPE html>
<html>
<head>
<title>Table With Semantic Markup</title>
</head>
<body>
<table>
<thead>
<tr>
<th scope="col">Region</th>
<th scope="col">Sales</th>
<th scope="col">Mean</th>
</tr>
</thead>
<tfoot>
<tr>
<th scope="row">Sum</th>
<td>$1,000,000</td>
<td></td>
</tr>
</tfoot>
<tbody>
<tr>
<th scope="row">Northeast</th>
<td>$100,000</td>
<td>$142,857</td>
</tr>
<tr>
<th scope="row">Southeast</th>
<td>$75,000</td>
<td>$142,857</td>
</tr>
<tr>
<th scope="row">Midwest</th>
<td>$125,000</td>
<td>$142,857</td>
</tr>
<tr>
<th scope="row">Mid-Atlantic</th>
<td>$125,000</td>
<td>$142,857</td>
</tr>
<tr>
<th scope="row">Southwest</th>
<td>$75,000</td>
<td>$142,857</td>
</tr>
<tr>
<th scope="row">Northwest</th>
<td>$100,000</td>
<td>$142,857</td>
</tr>
<tr>
<th scope="row">California</th>
<td>$400,000</td>
<td>$142,857</td>
</tr>
</tbody>
</table>
</body>
</html>
Now it is as clear as possible that the table is composed of a header section, a body section, and a footer section.
NOTE Although the footer appears last in presentation order on the page, by default, in the markup it must actually appear before the body of the table. This may have something to do with the fact that if you were spooling a very long table to a printer and want to print the footer at the base of every page, you wouldn't want to have to parse through all the table markup, in advance, to find the footer content.
When you view the results of our new table in Figure 7.3, you'll notice that the only difference from Figure 7.2 is that the cell contents of the first column, which you've marked as row headers, are now bold and centered. <thead>, <tbody>, and <tfoot> have acted as pure semantic markup, and have not caused any change in the presentation of the table.
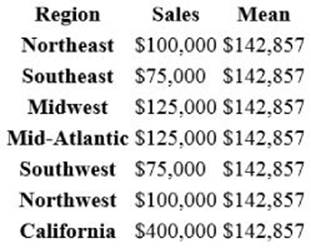
Figure 7.3 This table has both row and column headers.
You can find the TableWithSemanticMarkup.html file on the companion website.
Although there are no apparent built-in presentation differences, some browsers do utilize the extra context that you've provided in interesting ways. For example, some browsers, when printing, repeat the header section and/or the footer section on each page so that whoever reads the output does not have to refer to the first page to identify the columns. Later in the chapter you see how to apply some rather complex styling to these various sections of the table, but for now, apply some simple CSS rules, if only to clarify the table's anatomy. Add the following code to the <head> section of the page:
<style type="text/css">
thead { color: orange; }
tbody { color: gray; }
tfoot { color: red; }
</style>
As you can see in Figure 7.4, the table looks exactly the same as Figure 7.3 except for the fact that everything in the header area of the table uses an orange text color, everything in the footer area of the table uses a red text color, and all other text is gray.
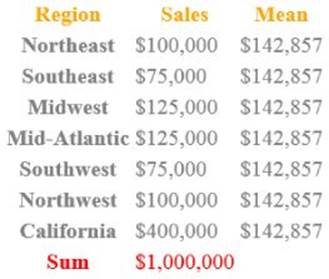
Figure 7.4 In this table, some CSS styling rules have been used to target the semantic markup of the table.
You can find the TableWithSemanticMarkupAndCSS.html file on the companion website.
Labeling Your Table
When providing a table of data to the user, it is important to provide a title or label so the user has sufficient context to understand the data and see how it's related to the rest of the content being provided. In an accessible table, a title is even more important as the user may not have sight cues to relate the table content with surrounding aspects of the page.
To add a title to your table, you can introduce the <caption> element to the table:
<table>
<caption>Sales By Region</caption>
<!-- ... -->
</table>
By default the title is presented at the top of the table, although you can configure the placement with CSS (see the caption-side property). A title does more than provide an explanation of your table content; most accessibility-oriented user agents specifically look for this caption to better explain the table's context.
If there is anything unusual about the structure of the table, it might be worth trying to provide some extra detail in the caption to attempt to make the content more digestible. However, it is preferable to simply reduce the complexity of the table. If the table is complex enough to need a paragraph describing its content, then it might not be the most effective way to visualize the data.
NOTE The table element used to have a summary attribute. This attribute had no visual presentation on the page, but it provided additional context that was consumable by screen readers. This attribute has been removed in HTML5, however. It's possible that the attribute has been removed because useful information about a table should be accessible to all users, and not just to screen readers.
You can see a table with a caption displayed in Figure 7.5.
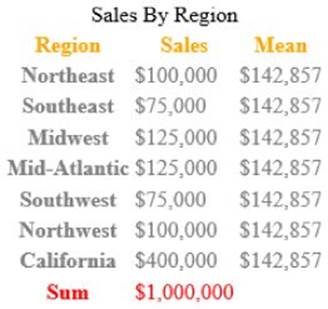
Figure 7.5 A descriptive caption has been added to the table.
Configuring the Columns
Thus far, you've created rows and headers, which have only implicitly defined the number of columns that the table contains. Is there anything that can be said more explicitly about the columns, though? The answer is yes, but don't get too excited, yet. There are limitations to the markup that can directly target a table column.
If you catalog the things you might want to do to a column of data in the table, some of the first actions that come to mind are
· Setting the font and color of all the cell content in the column
· Setting the text alignment of all the cell content in the column
· Setting the background color of the entire column
Fortunately there is an element called <col> that enables you to describe some styles that target an entire column. Unfortunately, only the third item in the preceding list is directly achievable using <col>. Listing 7-3 shows how you would use some <col> elements to style the contents of some of the columns in your table.
Listing 7-3
<!DOCTYPE html>
<html>
<head>
<title>Table With Caption and Column Settings</title>
<style type="text/css">
.col-header { background-color: gray; }
.col-amount { background-color: orange; }
</style>
</head>
<body>
<table>
<caption>Sales By Region</caption>
<colgroup>
<col class="col-header">
<col class="col-amount">
<col class="col-mean">
</colgroup>
<thead>
<tr>
<th scope="col">Region</th>
<th scope="col">Sales</th>
<th scope="col">Mean</th>
</tr>
</thead>
<tfoot>
<tr>
<th scope="row">Sum</th>
<td>$1,000,000</td>
<td></td>
</tr>
</tfoot>
<tbody>
<tr>
<th scope="row">Northeast</th>
<td>$100,000</td>
<td>$142,857</td>
</tr>
<tr>
<th scope="row">Southeast</th>
<td>$75,000</td>
<td>$142,857</td>
</tr>
<tr>
<th scope="row">Midwest</th>
<td>$125,000</td>
<td>$142,857</td>
</tr>
<tr>
<th scope="row">Mid-Atlantic</th>
<td>$125,000</td>
<td>$142,857</td>
</tr>
<tr>
<th scope="row">Southwest</th>
<td>$75,000</td>
<td>$142,857</td>
</tr>
<tr>
<th scope="row">Northwest</th>
<td>$100,000</td>
<td>$142,857</td>
</tr>
<tr>
<th scope="row">California</th>
<td>$400,000</td>
<td>$142,857</td>
</tr>
</tbody>
</table>
</body>
</html>
In Listing 7-3, you have two new additions to help configure your columns. The first is this:
<style type="text/css">
.col-header { background-color: gray; }
.col-amount { background-color: orange; }
</style>
In that code, there are two CSS classes defined that you assign to the column that contains the row headers and the column that contains the sales amounts, respectively. In both cases they are defining a background-color, which happens to be one of the few legal values that you can assign to a column. To assign these classes to their respective columns, the following configuration is used:
<colgroup>
<col class="col-header">
<col class="col-amount">
<col class="col-mean">
</colgroup>
Here, first, the <colgroup> element is used to indicate that you are defining some attributes for a group of columns in the table, and then each individual column's attributes are defined in the child <col> elements. In this case, a CSS class is being assigned to each column. The result is that the background of the header column is set to gray, and the background of the amount column is set to orange. You can see the result in Figure 7.6.
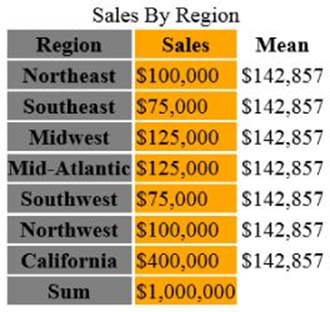
Figure 7.6 In this table, some of the settings of the columns have been explicitly configured.
You can find the CaptionAndColumnSettings.html file on the companion website.
Your natural inclination after getting the preceding example working would probably be to try to right-align the content of the cells in the number columns like this:
<style type="text/css">
.col-amount { text-align: right; }
.col-mean { text-align: right; }
</style>
However, you will find that this does not actually work. The table cells are not really seen as being Document Object Model (DOM) children of the column, so they don't actually inherit most CSS properties that would normally be inherited in this fashion. In the end, there are only a few valid properties for you to set this way. Nevertheless, right-aligning columns is something that you will want to do, so later in this chapter you see a strategy for this that does work.
NOTE If you look at an application programming interface (API) guide for <col>, you might see lots of interesting properties that can be set at the column level, such as align. However, some of these were never widely supported, and most of these attributes have been removed in HTML5. Later in the chapter, you find out about some of the recommended alternatives.
Assuring Maximum Readability
As mentioned in the introduction of this chapter, one of the nice things about data tables is that you can apply the strategy of progressive enhancement. In other words, you start with a table that almost all browsers, not to mention screen readers and other software agents, can present, and then you progressively layer on various enhancements that some user agents may support; browsers that don't support the enhancements gracefully react by omitting them. Not every user agent supports every enhancement that you might introduce, but, if you are careful, you should end up with a maximally enhanced table for every scenario.
Most of what you've done so far in this chapter should be presentable to user agents that support HTML4 and later. A few HTML5 attributes have been described that would work on non-HTML5 browsers as long as you provide a polyfill.
NOTE A polyfill is a piece of code that helps you emulate some functionality that's not natively supported in some of your target browsers. For HTML5, many new elements have been added that don't necessarily have specific presentation defaults, but they help to enhance the semantic content of the page. It's useful to be able to depend on these elements being available regardless of whether the target user agent supports HTML5, hence the prevalence of HTML5 polyfills that are available.
The current state of your data table as of Figure 7.5 is that it's serviceable but not very good-looking. It's a bit difficult to read, to boot. You can improve these aspects of the table through some judiciously applied CSS and JavaScript. Some of your target platforms will not be able to take advantage of some of these features, but any features you attempt to use that aren't supported should silently be ignored.
Here are some of the issues that it would be good to address in the current table:
· There are no visible divisions between the cells.
· There are no large visual distinctions other than font weight between the headers and the normal cells.
· The numeric columns would look better right aligned.
· It can be difficult for the eye to travel along a row of the table without slipping to an adjacent row.
Styling Your Table
Now it's time to pretty things up a bit using the code shown in Listing 7-4.
Listing 7-4
<!DOCTYPE html>
<html>
<head>
<title>Table With Styled Semantic Markup</title>
<style type="text/css">
/* Remove excess interstitial borders and padding
establish an outer border */
table {
border-collapse: collapse;
border: 1px solid #4C4C4C;
}
/* Add a dotted border around both header cells
and normal cells */
th, td {
border: 1px dotted #707070;
}
/* Add some padding around the header content
removing the cramped spacing. Make the background
color of the headers green. */
th {
background: #C2F0C2;
padding: 5px;
}
/* Darken the green background for just the column
headers so that they use a different green than the
row headers. The fact that the column headers are
within a thead element helps to discriminate them
from the row headers. */
thead th {
background: #9BC09B;
}
/* Set the background behind the caption to a dark
gray and the caption text to white. */
caption {
background: #4C4C4C;
padding: 5px;
color: white;
}
/* This sets a solid bottom border to just the column
headers. This is achieved by using an attribute selector
to select just the th elements with scope set to col. */
th[scope=col] {
border-bottom: 2px solid #707070;
}
/* This sets a solid right border to just the row headers.
This is achieved by using an attribute selector to
select just the th elements with scope set to row. It
also left aligns these headers */
th[scope=row] {
border-right: 2px solid #707070;
text-align: left;
}
/* This right aligns all the normal cell content and
adds some padding to them */
td {
text-align: right;
padding: 5px;
}
/* This sets a different background to just the row
header that resides in the footer row. */
tfoot th {
background: #BBBBD1;
}
/* This sets a different background to just the
normal cells that reside in the footer row. */
tfoot td {
background: #CFCFDF;
color: #8D1919;
}
</style>
</head>
<body>
<table>
<caption>Sales By Region</caption>
<colgroup>
<col class="col-header">
<col class="col-amount">
<col class="col-mean">
</colgroup>
<thead>
<tr>
<th scope="col">Region</th>
<th scope="col">Sales</th>
<th scope="col">Mean</th>
</tr>
</thead>
<tfoot>
<tr>
<th scope="row">Sum</th>
<td>$1,000,000</td>
<td></td>
</tr>
</tfoot>
<tbody>
<tr>
<th scope="row">Northeast</th>
<td>$100,000</td>
<td>$142,857</td>
</tr>
<tr>
<th scope="row">Southeast</th>
<td>$75,000</td>
<td>$142,857</td>
</tr>
<tr>
<th scope="row">Midwest</th>
<td>$125,000</td>
<td>$142,857</td>
</tr>
<tr>
<th scope="row">Mid-Atlantic</th>
<td>$125,000</td>
<td>$142,857</td>
</tr>
<tr>
<th scope="row">Southwest</th>
<td>$75,000</td>
<td>$142,857</td>
</tr>
<tr>
<th scope="row">Northwest</th>
<td>$100,000</td>
<td>$142,857</td>
</tr>
<tr>
<th scope="row">California</th>
<td>$400,000</td>
<td>$142,857</td>
</tr>
</tbody>
</table>
</body>
</html>
You can see the result of Listing 7-4 in Figure 7.7.
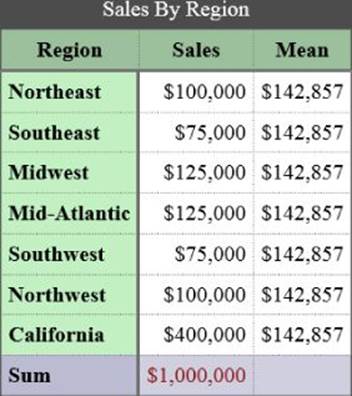
Figure 7.7 More comprehensive CSS styling rules have been applied to the table.
You can find the TableStyling.html file on the companion website.
The table in Figure 7.7 looks much better than earlier versions, doesn't it? The comments in Listing 7-4 explain what each individual styling rule accomplishes. Note how the use of the appropriate semantic HTML elements aided in discriminating between the various types of header rows and normal cells so that they could be styled differently.
Increasing Readability
With the styling in place, you've already improved the readability of the table remarkably, but there is still more that you can do. Most tables are rendered with horizontal lines between the rows. These lines help the eye track between cells in the same row and make it harder for the eye to slip from one row to another. Another trick that is often used to help the eye scan a table row is to use alternating row highlights. For example, a table might have a repeating pattern of a light background followed by a dark background. Conventional wisdom declares that this should make it harder for the eye to slip from one row to an adjacent one due to the visual disparity between them. Here's how you would add some additional styling rules to achieve this:
tbody tr:nth-child(odd) {
background: #DBDBDB;
}
This rule is a bit dense, so it helps to break it down; sometimes it helps to deconstruct complicated selectors if you read them from right to left. The nth-child(odd) bit is saying to select only odd children (every other child). Then, proceeding a step further to the left,tr:nth-child(odd) is the instruction to select all odd children if they are <tr> elements. Take a further step to the left, and tbody tr:nth-child(odd) is selecting odd children if they are <tr> elements and they are contained within a <tbody> element. You can see the results of this in Figure 7.8.
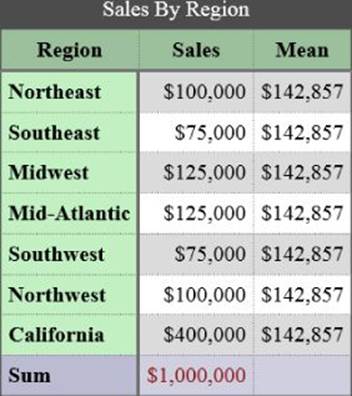
Figure 7.8 Now the table has alternating row highlights.
You can find the TableAlternateRowStyling.html file on the companion website.
The CSS required to create alternating row highlights actually turns out to be really concise. The downside, however, is that nth-child is actually a CSS level 3 selector, so it is only available in the most modern browsers. Older browsers just ignore the rule, so this rule still safely and gracefully degrades if someone tries to view it on a noncompliant browser.
If you drop some of the concision, you can support alternating highlights on older browsers also. One way of approaching this is to manually add a class to all the odd rows of the table and then select on that class directly in order to highlight the odd rows. If you were generating the table using some code on the server, this method would be relatively straightforward. You could just make sure to emit class="odd" for every other row in the markup generated for the table.
However, there is a distinct downside to approaching this problem in this way. If you were to use some client-side code to change the sorting of the rows, you would also need to reassign all the classes based on the new row order.
Another approach is to use jQuery to manipulate the rows to implement the alternating row highlights, as shown in Listing 7-5. One of the benefits of jQuery is that it can help you emulate some more modern browser features on older browsers.
Listing 7-5
<!DOCTYPE html>
<html>
<head>
<title>Table With Alternating Row Highlight</title>
<script src="jquery/jquery-1.11.1.min.js"></script>
<style type="text/css">
table {
border-collapse: collapse;
border: 1px solid #4C4C4C;
}
th, td {
border: 1px dotted #707070;
}
th {
background: #C2F0C2;
padding: 5px;
}
thead th {
background: #9BC09B;
}
caption {
background: #4C4C4C;
padding: 5px;
color: white;
}
th[scope=col] {
border-bottom: 2px solid #707070;
}
th[scope=row] {
border-right: 2px solid #707070;
text-align: left;
}
td {
padding: 5px;
}
tfoot th {
background: #BBBBD1;
}
tfoot td {
background: #CFCFDF;
color: #8D1919;
}
.row-odd {
background: #DBDBDB;
}
.row-odd th {
background: #A2D0A2;
}
.cell-number {
text-align: right;
}
</style>
<script type="text/javascript">
function usCurrencyToFloat(currency) {
currency = currency.replace(/\$/g, '');
currency = currency.replace(/,/g, '');
return parseFloat(currency);
}
$(function () {
$("tbody").find("tr:odd").addClass("row-odd");
$("tbody").find("td").filter(function (index) {
return !isNaN(usCurrencyToFloat($(this).text()));
}).addClass("cell-number");
});
</script>
</head>
<body>
<table>
<caption>Sales By Region</caption>
<colgroup>
<col class="col-header">
<col class="col-amount">
<col class="col-mean">
</colgroup>
<thead>
<tr>
<th scope="col">Region</th>
<th scope="col">Sales</th>
<th scope="col">Mean</th>
</tr>
</thead>
<tfoot>
<tr>
<th scope="row">Sum</th>
<td>$1,000,000</td>
<td></td>
</tr>
</tfoot>
<tbody>
<tr>
<th scope="row">Northeast</th>
<td>$100,000</td>
<td>$142,857</td>
</tr>
<tr>
<th scope="row">Southeast</th>
<td>$75,000</td>
<td>$142,857</td>
</tr>
<tr>
<th scope="row">Midwest</th>
<td>$125,000</td>
<td>$142,857</td>
</tr>
<tr>
<th scope="row">Mid-Atlantic</th>
<td>$125,000</td>
<td>$142,857</td>
</tr>
<tr>
<th scope="row">Southwest</th>
<td>$75,000</td>
<td>$142,857</td>
</tr>
<tr>
<th scope="row">Northwest</th>
<td>$100,000</td>
<td>$142,857</td>
</tr>
<tr>
<th scope="row">California</th>
<td>$400,000</td>
<td>$142,857</td>
</tr>
</tbody>
</table>
</body>
</html>
You can see the result of Listing 7-5 in Figure 7.9.

Figure 7.9 The alternating row highlights in this table were implemented with jQuery.
You can find the TableAlternateRowStylingJQuery.html file on the companion website.
Review the new aspects of this sample, starting with the following:
<script src="jquery/jquery-1.11.1.min.js"></script>
This line of code references jQuery, assuming it has been downloaded to a subfolder called jQuery, as it is in the code download from the companion site. It could also be loaded through its CDN server. For more information on using the jQuery CDN server seehttp://jquery.com/download/. You should, of course, review jQuery's license terms before use.
The following is the next new bit of CSS:
.row-odd {
background: #DBDBDB;
}
This defines a CSS style rule that targets any element that has the class row-odd. You use jQuery to make sure that the odd rows have this class assigned. This rule assigns a different background color to the odd rows so that the background color alternates as you achieved earlier through the nth-child selector.
Next is the following rule, which targets only <th> elements that are in odd rows, coloring their background a darker version of the row header color.
.row-odd th {
background: #A2D0A2;
}
And then you have this:
.cell-number {
text-align: right;
}
This rule assumes that you'll later use jQuery to assign a class called cell-number to any cell that appears to contain a number, in order that they all be right-aligned.
The following is the first actual JavaScript you'll employ to manipulate the table:
<script type="text/javascript">
function usCurrencyToFloat(currency) {
currency = currency.replace(/\$/g, '');
currency = currency.replace(/,/g, '');
return parseFloat(currency);
}
$(function () {
$("tbody").find("tr:odd").addClass("row-odd");
$("tbody").find("td").filter(function (index) {
return !isNaN(usCurrencyToFloat($(this).text()));
}).addClass("cell-number");
});
</script>
It's pretty concise and straightforward, but here's the breakdown. The first bit:
function usCurrencyToFloat(currency) {
currency = currency.replace(/\$/g, '');
currency = currency.replace(/,/g, '');
return parseFloat(currency);
}
attempts, through pretty brute force means, to convert the currency strings in the table cells into floating point numbers. This is done in order to attempt to identify which cells contain numbers, so that the style defined earlier can right-align only the number cells. This is accomplished through removing any dollar sign characters and commas from the string, and then parsing the result as a floating point number. If the string happens to still not be a valid number then parseFloat returns NaN (Not a number).
Next,
$(function () {
$("tbody").find("tr:odd").addClass("row-odd");
$("tbody").find("td").filter(function (index) {
return !isNaN(usCurrencyToFloat($(this).text()));
}).addClass("cell-number");
});
uses jQuery to invoke some code when the DOM is ready. In the ready callback, it invokes:
$("tbody").find("tr:odd").addClass("row-odd");
which uses jQuery to find just the odd rows from within the body of the table and adds the class row-odd to them. Then it calls
$("tbody").find("td").filter(function (index) {
return !isNaN(usCurrencyToFloat($(this).text()));
}).addClass("cell-number");
which finds only cells for which the usCurrencyToFloat function (discussed earlier in this chapter) returns a valid number, and to those cells it adds the class cell-number. As previously discussed, this should ensure that all number columns end up right-aligned.
Adding Dynamic Highlighting
Although the rows are far easier to scan now, there is still more you can do to make this table more readable. You can help the user single out a row and/or a column by coloring it differently than all the others. A good solution for this is to highlight whichever row and/or column is currently under the mouse cursor. You can implement this using jQuery. To achieve this, you would add these styles:
td.highlight {
background: #FF944D;
}
th.highlight {
background: #B26836;
}
This code is anticipating that you'll use jQuery to add a class called highlight to any cells and headers that are in the same row or column as the user's mouse cursor.
You would then add the following code to the ready callback from the previous listing:
$(document.body).on("mouseover", "td, th", function () {
var index = $(this).index(),
row = $(this).parent(),
trs = $("tr");
row.children().addClass("highlight");
for (var i = 0; i < trs.length; i++) {
trs.eq(i)
.children()
.eq(index)
.addClass("highlight");
}
});
$(document.body).on("mouseout", "td, th", function () {
var index = $(this).index(),
row = $(this).parent(),
trs = $("tr");
row.children().removeClass("highlight");
for (var i = 0; i < trs.length; i++) {
trs.eq(i)
.children()
.eq(index)
.removeClass("highlight");
}
});
With $(document.body).on("mouseover", "td, th", function () { you are listening for the mouseover event to fire for any table cell or table header on the page. var index = $(this).index() gets the index of the cell, within the table row, that the mouse is directly over. row = $(this).parent() gets the row that contains this cell. trs = $("tr") gets all table rows. Again, if you have multiple tables on the page, you have to do something a bit more complicated. You'd want to find the closest containing table element for the hovered cell and find only elements within that table.
Given these variables, you can add the highlight class to all cells in the current row with row.children().addClass("highlight") and then loop through all the rows and highlight all the cells that are in the same column as the hovered cell:
for (var i = 0; i < trs.length; i++) {
trs.eq(i)
.children()
.eq(index)
.addClass("highlight");
}
Here, .eq(index) is filtering the set of children to just those equaling the current column index.
NOTE jQuery uses a functional programming style. Most methods operate on the current selection. So when you execute trs.eq(i).children().eq(index).addClass("highlight"), the selection starts as all the table rows, is filtered down to just the current row, drills to become the children of that row, and is filtered to just the cell from the column with the provided index; then the “highlight” class is applied to the whole selection, which is just the cell from the hovered column, in this case.
Following this method, the same is done for mouseout, except the highlight class is being removed from all the previously highlighted cells rather than it being added. Given all this, you end up with something like Figure 7.10, which shows the result of hovering over a cell in the table.
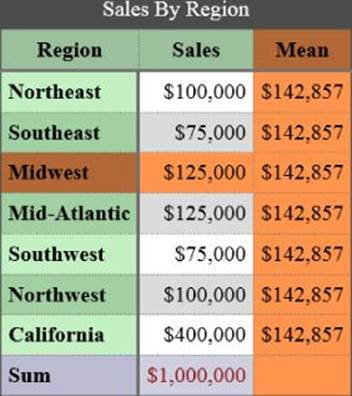
Figure 7.10 The hovered row and column are dynamically highlighted.
You can find the TableRowAndColumnHighlights.html file on the companion website.
Including Computations
Now that you've built a table, made it accessible, and improved its readability with CSS and JavaScript, it's time to see what else can be done to further enhance it with JavaScript. If you think back to when you initially used the data from this table in Chapter 2, you performed some further analysis on the data. This section describes how to perform the same analysis in JavaScript and explains how to automatically add it to the table in the process. Listing 7-6 is the new script block:
Listing 7-6
<script type="text/javascript">
function usCurrencyToFloat(currency) {
currency = currency.replace(/\$/g, '');
currency = currency.replace(/,/g, '');
return parseFloat(currency);
}
function floatToUSCurrency(value) {
var numString = value.toFixed(2),
parts = numString.split('.'),
outParts = [],
beforeDecimal = "0",
afterDecimal = "00",
currSegment;
beforeDecimal = parts[0];
afterDecimal = parts[1];
while (beforeDecimal.length > 3) {
currSegment = beforeDecimal.substring(
beforeDecimal.length - 3,
beforeDecimal.length);
beforeDecimal = beforeDecimal.substring(
0,
beforeDecimal.length - 3);
outParts.unshift(currSegment);
}
if (beforeDecimal.length > 0) {
outParts.unshift(beforeDecimal);
}
return '$' + outParts.join(',') + '.' + afterDecimal;
}
function populateCalculatedColumn(
tableSelector,
toPopulateIndex,
toPopulateHeader,
calculation,
parse,
toString) {
var columns = [],
rows = $(tableSelector).find("tbody").find("tr"),
headers, tableInfo = {},
headerRow = $(tableSelector).find("thead").find("tr"),
newColumn, header,
footerRow = $(tableSelector).find("tfoot").find("tr");
rows.each(function (index, row) {
$(this).children().each(function (index, cell) {
var currColumn;
if ((columns.length - 1) < index) {
columns.push([]);
}
currColumn = columns[index];
currColumn.push(parse($(this).text()));
});
});
tableInfo.columns = columns;
headers = headerRow.find("th");
headers.each(function (index, header) {
tableInfo[$(this).text()] = columns[index];
});
newColumn = calculation(tableInfo);
rows.each(function (index, row) {
var thisRow = $(this),
row;
while ((thisRow.children().length - 1) < toPopulateIndex) {
thisRow.append($("<td></td>"));
}
cell = thisRow.children().eq(toPopulateIndex);
cell.text(toString(newColumn[index]));
});
while ((headerRow.children().length - 1) < toPopulateIndex) {
headerRow.append($("<th scope='col'></th>"));
}
header = headerRow.children().eq(toPopulateIndex);
header.text(toPopulateHeader);
while ((footerRow.children().length - 1) < toPopulateIndex) {
footerRow.append($("<td></td>"));
}
if (newColumn.length > rows.length) {
footerRow.children.eq(toPopulateIndex).text(
toString(newColumn[rows.length]));
}
}
$(function () {
$(document.body).on("mouseover", "td, th", function () {
var index = $(this).index(),
row = $(this).parent(),
trs = $("tr"), i;
row.children().addClass("highlight");
for (var i = 0; i < trs.length; i++) {
trs.eq(i)
.children()
.eq(index)
.addClass("highlight");
}
});
$(document.body).on("mouseout", "td, th", function () {
var index = $(this).index(),
row = $(this).parent(),
trs = $("tr"), i;
row.children().removeClass("highlight");
for (var i = 0; i < trs.length; i++) {
trs.eq(i)
.children()
.eq(index)
.removeClass("highlight");
}
});
populateCalculatedColumn(
"table",
2,
"Mean",
function (tableInfo) {
var sum = 0, mean, newColumn = [];
for (var i = 0; i < tableInfo.Sales.length; i++) {
sum += tableInfo.Sales[i];
}
mean = sum / tableInfo.Sales.length;
for (var i = 0; i < tableInfo.Sales.length; i++) {
newColumn.push(mean);
}
return newColumn;
},
usCurrencyToFloat,
floatToUSCurrency);
populateCalculatedColumn(
"table",
3,
"Difference",
function (tableInfo) {
var newColumn = [];
for (var i = 0; i < tableInfo.Sales.length; i++) {
newColumn.push(
tableInfo.Sales[i] - tableInfo.Mean[i]
);
}
return newColumn;
},
usCurrencyToFloat,
floatToUSCurrency);
populateCalculatedColumn(
"table",
4,
"Squared Difference",
function (tableInfo) {
var newColumn = [];
for (var i = 0; i < tableInfo.Sales.length; i++) {
newColumn.push(
tableInfo.Difference[i] *
tableInfo.Difference[i]
);
}
return newColumn;
},
usCurrencyToFloat,
floatToUSCurrency);
$("tbody").find("tr:odd").addClass("row-odd");
$("tbody").find("td").filter(function (index) {
return !isNaN(usCurrencyToFloat($(this).text()));
}).addClass("cell-number");
});
</script>
The output is shown in Figure 7.11.
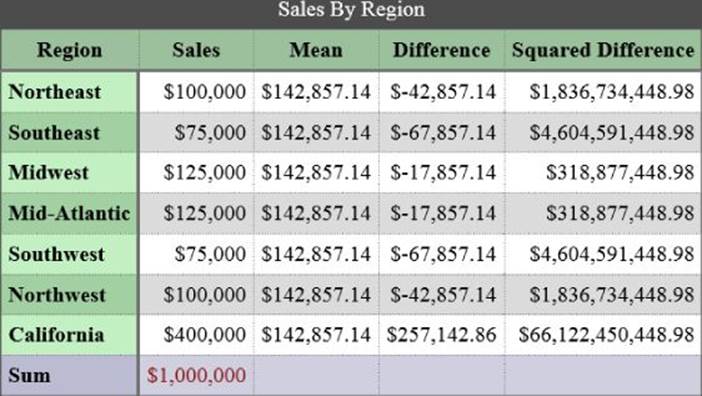
Figure 7.11 This table has dynamically calculated columns.
You can find the TableWithCalculatedColumns.html file on the companion website.
With the new code incorporated, you can now see two additional columns: Difference and Squared Difference. These were calculated by the JavaScript in the preceding code, which you examine shortly. Additionally, since the beginning of this chapter, you've used static values for the Mean column, but now this column is also dynamically calculated.
Using JavaScript for Calculations
Now, it's time to break down how the dynamically calculated columns shown in Figure 7.11 are produced.
function usCurrencyToFloat(currency) {
currency = currency.replace(/\$/g, '');
currency = currency.replace(/,/g, '');
return parseFloat(currency);
}
You might recall that this method was discussed earlier in the chapter. It's being used here to make it possible to manipulate the currency values in the table, and perform calculations based upon them.
function floatToUSCurrency(value) {
var numString = value.toFixed(2),
parts = numString.split('.'),
outParts = [],
beforeDecimal = "0",
afterDecimal = "00",
currSegment;
beforeDecimal = parts[0];
afterDecimal = parts[1];
while (beforeDecimal.length > 3) {
currSegment = beforeDecimal.substring(
beforeDecimal.length - 3,
beforeDecimal.length);
beforeDecimal = beforeDecimal.substring(
0,
beforeDecimal.length - 3);
outParts.unshift(currSegment);
}
if (beforeDecimal.length > 0) {
outParts.unshift(beforeDecimal);
}
return '$' + outParts.join(',') + '.' + afterDecimal;
}
This, like the conversion from a US currency string to a floating point number, is a rather brute force conversion back to a US currency string from a floating point number. There are more concise ways to achieve this, but this way strives to be pretty straightforward. It basically just adds the comma separators back into the number and then prepends the dollar sign again.
Now turn your attention to the main function that dynamically populates the columns for the table: populateCalculatedColumn. The parameters of the function are the following:
· tableSelector is a jQuery selector that you can use to indicate which table should have the column added.
· toPopulateIndex indicates the column index at which to add the new column in the table.
· toPopulateHeader indicates the desired text of the new header to top the column in the table.
· calculation takes a function that allows you to perform a custom calculation to determine the content of each cell in the new table column.
· parse takes a function that converts the values in any source columns into values that can be referenced in the calculation.
· toString takes a function that renders a floating point value into the final text you expect to see in the column cells.
Now that we've discussed the parameters, let's dive into the body of the method.
var columns = [],
rows = $(tableSelector).find("tbody").find("tr"),
headers, tableInfo = {},
headerRow = $(tableSelector).find("thead").find("tr"),
newColumn, header,
footerRow = $(tableSelector).find("tfoot").find("tr");
At the top, you are defining some useful variables to use later in the function, including arrays to hold information about the existing columns and headers in the table. Also, the various elements of the table are then located using jQuery selectors. Each of the selectors, such as $(tableSelector).find("tbody").find("tr"), first finds the table based on the tableSelector parameter and then finds various sub-elements within that table using the jQuery find function.
rows.each(function (index, row) {
$(this).children().each(function (index, cell) {
var currColumn;
if ((columns.length - 1) < index) {
columns.push([]); // need to add a new column
}
currColumn = columns[index];
// add the value for this cell to its column
currColumn.push(parse($(this).text()));
});
});
Here, for each row, the parse function (which was passed in as a parameter) is used to collect the value of every cell in each column into a collection of columns for you to reference when calculating column values later.
tableInfo.columns = columns;
headers = headerRow.find("th");
headers.each(function (index, header) {
tableInfo[$(this).text()] = columns[index];
});
In this code, the columns, with associated cell values, are stored such that they can be referenced from the calculation function. Then, to make it easier to reference various columns from the calculation function, it loops through the headers in the header row and stores each column via its header name also.
newColumn = calculation(tableInfo);
rows.each(function (index, row) {
var thisRow = $(this);
while ((thisRow.children().length - 1) < toPopulateIndex) {
thisRow.append($("<td></td>"));
}
cell = thisRow.children().eq(toPopulateIndex);
cell.text(toString(newColumn[index]));
});
Next, the calculation function (which was passed in) is called on the column information that you've collected, which produces a new column (an array of values) that need to be added to the table. To add these to the table, you loop over each of the existing rows in the table and add cells to the current row until there are enough cells to accommodate the new column value. Then the correct cell in the current row is located and the calculated content is added as text content for the cell by means of calling the toString function (which was passed in as a parameter).
while ((headerRow.children().length - 1) < toPopulateIndex) {
headerRow.append($("<th scope='col'></th>"));
}
header = headerRow.children().eq(toPopulateIndex);
header.text(toPopulateHeader);
This logic should look familiar because it's essentially the same logic that you just used to ensure that there was a cell to hold the new column data and then to populate the cell. In this case, however, you are ensuring that there is a header column to hold the new header value for the dynamically calculated column and then providing the new header text (which was passed in as a parameter) as the text of the header.
while ((footerRow.children().length - 1) < toPopulateIndex) {
footerRow.append($("<td></td>"));
}
if (newColumn.length > rows.length) {
footerRow.children.eq(toPopulateIndex).text(
toString(newColumn[rows.length]));
}
Finally, this adds a new cell to the footer row, if an appropriate value was returned from the calculation function.
Quite a lot of code, huh? Thankfully, there are plenty of libraries out there, both open source and commercial, to accomplish these sorts of things for you. As you can see, however, it isn't too complicated to do it from scratch!
Populating the Table
Now it's time to actually populate the table, so you'll be calling the populateCalculatedColumn function a few times. First, you can dynamically create the Mean column, which was a static part of the table until this point:
populateCalculatedColumn(
"table",
2,
"Mean",
function (tableInfo) {
var sum = 0, mean, newColumn = [];
for (var i = 0; i < tableInfo.Sales.length; i++) {
sum += tableInfo.Sales[i];
}
mean = sum / tableInfo.Sales.length;
for (var i = 0; i < tableInfo.Sales.length; i++) {
newColumn.push(mean);
}
return newColumn;
},
usCurrencyToFloat,
floatToUSCurrency);
Here, you are targeting all table elements on the page (normally you'd probably use an ID or a class name here; there is only one table on the page, in this instance). This is indicating that the new column should be inserted at index 2 and that it should be headed with the text “Mean”. Then, the calculation function is provided, which loops through the Sales column data and divides by the number of entries, which, you might recall from Chapter 2, is how you calculate the mean value. Then, this mean value is returned for every row of the new column. Finally, the functions usCurrencyToFloat and floatToUSCurrency are provided so that values can be read out of the existing columns or rendered into the new column being created.
Next, a column is created that holds the difference between each row's sales value and each row's mean value and is inserted at index 3:
populateCalculatedColumn(
"table",
3,
"Difference",
function (tableInfo) {
var newColumn = [];
for (var i = 0; i < tableInfo.Sales.length; i++) {
newColumn.push(
tableInfo.Sales[i] - tableInfo.Mean[i]
);
}
return newColumn;
},
usCurrencyToFloat,
floatToUSCurrency);
And finally the last column is inserted at column index 4 with a calculation that squares each row's Difference value, again, as discussed in Chapter 2:
populateCalculatedColumn(
"table",
4,
"Squared Difference",
function (tableInfo) {
var newColumn = [];
for (var i = 0; i < tableInfo.Sales.length; i++) {
newColumn.push(
tableInfo.Difference[i] *
tableInfo.Difference[i]
);
}
return newColumn;
},
usCurrencyToFloat,
floatToUSCurrency);
As a result of your jQuery wizardry, the table has three additional columns that weren't present when the table was delivered from the server.
NOTE Keep in mind that this sort of operation can lessen the requirement in terms of the upfront analysis that is performed on the data before it is sent to the client, but this sort of strategy can decrease the reach of your table. Any browser that does not have JavaScript enabled will not be able to view these additional columns. This includes many screen reader programs, which can deliberately avoid running scripts. Calculated columns can be extremely useful, however, if you want the user to be able to select extra ad hoc calculations to apply to the data on the client.
Using the DataTables Library
You just managed some pretty impressive table manipulation with only jQuery and a bit of elbow grease to assist you, but there are also mature libraries available to do much more elaborate things to help you visualize tabular data. In this section, you use one such library to accomplish some of what you've already accomplished through other means earlier in the chapter. This time, though, there is far less logic for you to write and maintain yourself (which can be a very important thing when working with JavaScript!).
NOTE JavaScript is a very flexible and fun-to-use language, but it lacks some features that make it an easy language to use for maintaining large code bases. If you need to maintain a lot of JavaScript code, it's best to have a good strategy laid out. One good strategy is to use static analysis tools, such as JSLint or JSHint, to warn you of issues well before your code gets executed. Another valid strategy is to try to minimize the JavaScript code that you have to maintain. Using jQuery helps you a lot in this regard, but there are lots of other libraries that can assist for other scenarios, not to mention lots of plug-ins for jQuery that extend its abilities in various ways.
The open source library you'll be using in this section is called DataTables (www.datatables.net/). In the code listings and companion code for this chapter, the assumption is that you have downloaded the DataTables plug-in to a subfolder called datatables. This is the arrangement you will find if you download the code from the companion site. As with jQuery you could alternatively load the code from a CDN.
NOTE There are many advantages to loading JavaScript resources from a CDN, but one of them is that if your users have already visited another site that loaded that resource from the same URL, that resource is already cached on the users' systems, which saves you bandwidth and also saves the user time when loading the page.
Making Pretty Tables with DataTables
The first thing you can try to do is to use DataTables to perform the same sort of progressive enhancement on the static <table> element that you've been targeting for this whole chapter (see Listing 7-7).
Listing 7-7
<!DOCTYPE html>
<html>
<head>
<title>Table With DataTables</title>
<link rel="stylesheet" type="text/css" href="datatables/media/css/jquery.dataTables_themeroller.css">
<link rel="stylesheet" type="text/css"
href="jquery-ui-1.11.1/jquery-ui.css">
<script type="text/javascript"
src="jquery/jquery-1.11.1.min.js"></script>
<script type="text/javascript"
src="jquery-ui-1.11.1/jquery-ui.min.js"></script>
<script type="text/javascript"
src="datatables/media/js/jquery.dataTables.min.js">
</script>
<script type="text/javascript">
$(function () {
$("#salesByRegion").dataTable({
bJQueryUI: true
});
});
</script>
</head>
<body>
<table id="salesByRegion">
<caption>Sales By Region</caption>
<colgroup>
<col class="col-header">
<col class="col-amount">
<col class="col-mean">
</colgroup>
<thead>
<tr>
<th scope="col">Region</th>
<th scope="col">Sales</th>
<th scope="col">Mean</th>
</tr>
</thead>
<tfoot>
<tr>
<th scope="row">Sum</th>
<td>$1,000,000</td>
<td></td>
</tr>
</tfoot>
<tbody>
<tr>
<th scope="row">Northeast</th>
<td>$100,000</td>
<td>$142,857</td>
</tr>
<tr>
<th scope="row">Southeast</th>
<td>$75,000</td>
<td>$142,857</td>
</tr>
<tr>
<th scope="row">Midwest</th>
<td>$125,000</td>
<td>$142,857</td>
</tr>
<tr>
<th scope="row">Mid-Atlantic</th>
<td>$125,000</td>
<td>$142,857</td>
</tr>
<tr>
<th scope="row">Southwest</th>
<td>$75,000</td>
<td>$142,857</td>
</tr>
<tr>
<th scope="row">Northwest</th>
<td>$100,000</td>
<td>$142,857</td>
</tr>
<tr>
<th scope="row">California</th>
<td>$400,000</td>
<td>$142,857</td>
</tr>
</tbody>
</table>
</body>
</html>
Listing 7-7 produces the output in Figure 7.12.
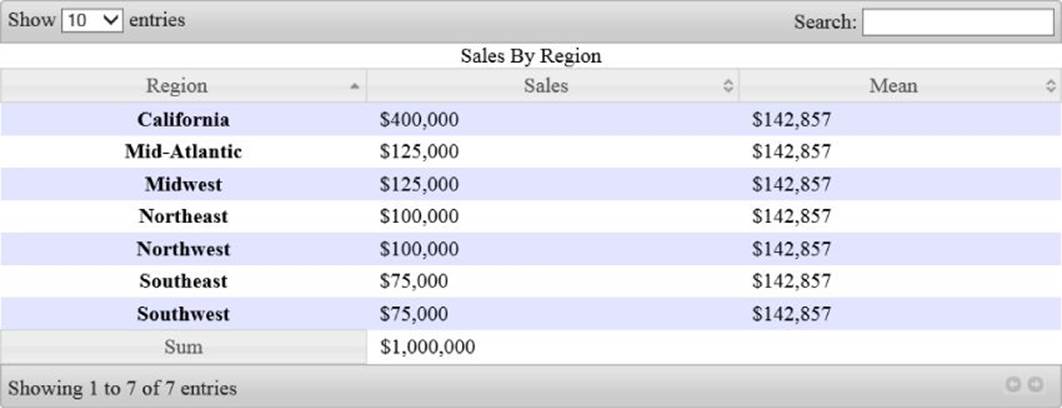
Figure 7.12 The table has been enhanced with the DataTables API.
You can find the TableUsingDataTables.html file on the companion website.
So, let's take a closer look:
$(function () {
$("#salesByRegion").dataTable({
bJQueryUI: true
});
});
That's a lot less JavaScript code, huh? So what did it achieve? You get a lot of styling, data paging, dynamic filtering, alternating row highlights, sorting headers, and so on. And all you had to do to achieve this was to target the table by ID and invoke the DataTable library on it. Very cool! Also, you still started with an accessible table that users that don't have the ability to run JavaScript logic can consume.
In the preceding code snippet, bJQueryUI: true is indicating that the DataTables library should apply the appropriate classes to the various table elements such that you can style the table with jQuery ThemeRoller themes. The DataTables API, rather curiously, uses some form of Hungarian notation to identify the types of its options, so the lowercase B indicates that bJQueryUI is a Boolean option. One of the CSS files loaded at the top of Listing 7-8 is the jQuery UI smoothness theme. By merit of this option, you get some pretty slick styling applied to all the table elements.
NOTE Notice in Figure 7.12 that the table caption looks rather unstyled. Unfortunately, it doesn't seem like DataTables attempts to mesh this with the other styled elements by default. In order to blend it in better with the other elements, you could experiment with applying the same CSS classes to the <caption> as are applied to other parts of the table by DataTables.
Sorting with DataTables
When running the sample from the preceding section, you'll find that, among other things, you can click the column headers to change the sort order of the rows based on the values in that column, much like you can in software such as Microsoft Excel. With some additional configuration, you can also specify the initial sort order of the rows, using the following code:
$(function () {
$("#salesByRegion").dataTable({
bJQueryUI: true,
aaSorting: [ [1, "desc"], [0, "desc"] ]
});
});
Here, the new option you are specifying is aaSorting. Again the Hungarian notation is at play here, so aaSorting indicates the expected type is an array of arrays. [ [1, "desc"], [0, "desc"] ] indicates that you first want the table to be sorted by the column with index 1 descending, and then by the column with index 0 descending. This produces the output shown in Figure 7.13.
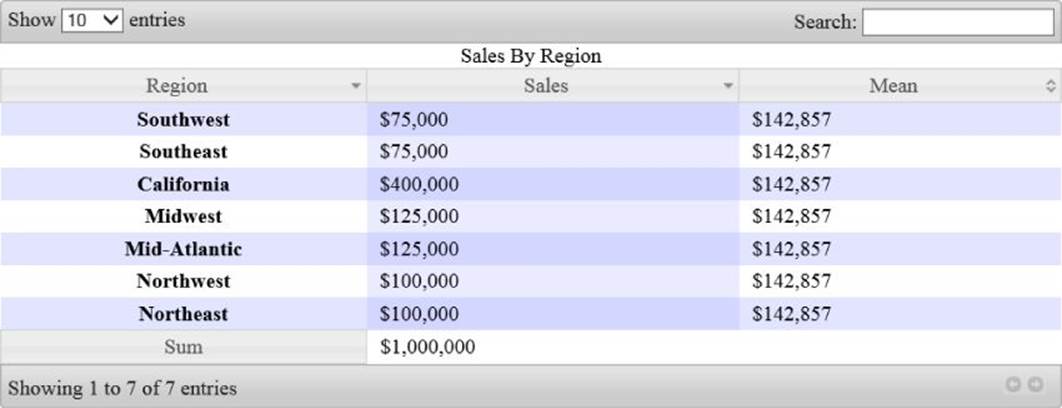
Figure 7.13 DataTables has been used to provide an initial sort for an HTML table.
You can find the TableUsingDataTablesSorting.html file on the companion website.
Something you'll notice, however, when sorting these columns by clicking the headers, or pre-sorting the columns, as in Figure 7.13, is that the numbers aren't quite sorted by value, but rather as strings. DataTables is capable of performing a numeric style sort, but you need to help it parse the numbers from strings to floating points, like so:
$(function () {
function usCurrencyToFloat(currency) {
currency = currency.replace(/\$/g, '');
currency = currency.replace(/,/g, '');
return parseFloat(currency);
}
jQuery.fn.dataTableExt.oSort['us-currency-asc'] = function(x,y) {
var fx = usCurrencyToFloat(x),
fy = usCurrencyToFloat(y);
if (fx < fy) {
return -1;
}
if (fx > fy) {
return 1;
}
return 0;
};
jQuery.fn.dataTableExt.oSort['us-currency-desc'] = function(x,y) {
var fx = usCurrencyToFloat(x),
fy = usCurrencyToFloat(y);
if (fx < fy) {
return 1;
}
if (fx > fy) {
return -1;
}
return 0;
};
$("#salesByRegion").dataTable({
bJQueryUI: true,
aaSorting: [ [1, "desc"], [0, "desc"] ],
aoColumns: [
null,
{ sType: "us-currency" },
{ sType: "us-currency" } ]
});
});
Here you are defining how the column type us-currency will be sorted in both an ascending and descending fashion. Then the types of the second and third columns can be changed to us-currency causing them to be sorted based on numeric value rather than by string value (which is the default).
Using Calculated Columns with DataTables
One of the trickier things you accomplished in the previous section was to use jQuery to dynamically add some new columns into the table. DataTables also has some facilities to enable this, but with far less code. You can change the table initialization to read
$(function () {
$("#salesByRegion").dataTable({
bJQueryUI: true,
aaSorting: [ [3, "desc"], [1, "desc"] ],
aoColumnDefs: [
{
mRender: function ( data, type, row ) {
var difference =
usCurrencyToFloat(row[1]) - usCurrencyToFloat(row[2]);
return floatToUSCurrency(difference);
},
aTargets: [ 3 ]
}]
});
});
This adds the aoColumnDefs option (an array of objects that define some new columns), specifying that your single render function is targeting the column in the table with index 3. The render method calculates the difference between the column at index 2 (the mean value) and the column at index 1 (the sales value) just as you did with the code from the earlier portion of this chapter. This function also uses your two old friends: usCurrencyToFloat and floatToUSCurrency. Notice, too, that you are leaving an empty column to render these values into:
<table id="salesByRegion">
<caption>Sales By Region</caption>
<colgroup>
<col class="col-header">
<col class="col-amount">
<col class="col-mean">
</colgroup>
<thead>
<tr>
<th scope="col">Region</th>
<th scope="col">Sales</th>
<th scope="col">Mean</th>
<th scope="col">Difference</th>
</tr>
</thead>
<tfoot>
<tr>
<th scope="row">Sum</th>
<td>$1,000,000</td>
<td></td>
<td></td>
</tr>
</tfoot>
<tbody>
<tr>
<th scope="row">Northeast</th>
<td>$100,000</td>
<td>$142,857</td>
<td></td>
</tr>
<tr>
<th scope="row">Southeast</th>
<td>$75,000</td>
<td>$142,857</td>
<td></td>
</tr>
<tr>
<th scope="row">Midwest</th>
<td>$125,000</td>
<td>$142,857</td>
<td></td>
</tr>
<tr>
<th scope="row">Mid-Atlantic</th>
<td>$125,000</td>
<td>$142,857</td>
<td></td>
</tr>
<tr>
<th scope="row">Southwest</th>
<td>$75,000</td>
<td>$142,857</td>
<td></td>
</tr>
<tr>
<th scope="row">Northwest</th>
<td>$100,000</td>
<td>$142,857</td>
<td></td>
</tr>
<tr>
<th scope="row">California</th>
<td>$400,000</td>
<td>$142,857</td>
<td></td>
</tr>
</tbody>
</table>
You can see the result of the column generation in Figure 7.14.
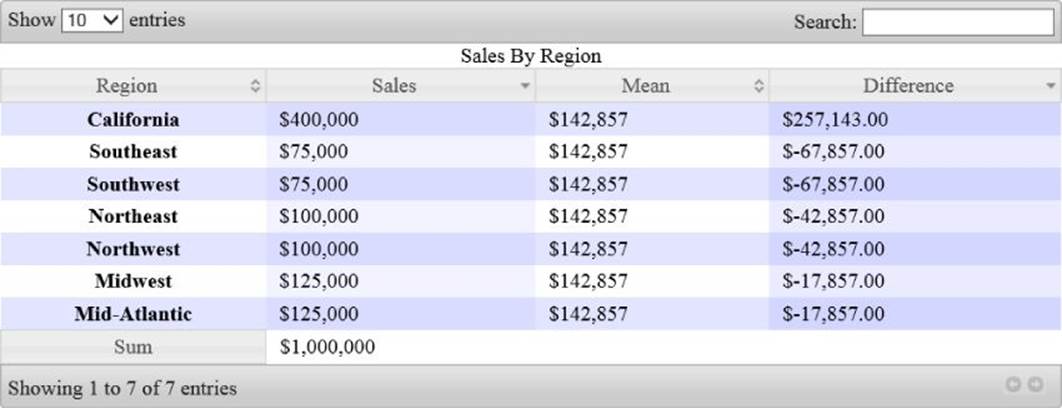
Figure 7.14 DataTables calculates columns at runtime.
You can find the TableUsingDataTablesCalculated.html file on the companion website.
Relating a Data Table to a Chart
To wrap up this chapter, you're going to take progressive enhancement to the extreme by taking the same data and presenting an interactive and editable data table with a linked chart displaying the same data. The charting component depends on HTML5 in order to do its sophisticated client-side rendering and represents one additional enhancement that can be made to presenting the data for supporting user agents.
For the last part of this chapter you switch to using the IgniteUI igGrid and igDataChart from Infragistics. These components are not free, but they also reduce some very complex interactive scenarios to simple turnkey configuration. The purpose of this chapter is not to discuss the configuration of chart components, which comes later in this book, so that topic is touched upon only lightly here. The idea, rather, is to focus on how the data tables from this chapter might be correlated with other related visualizations bound to the same data.
First, you should sign up for the trial version of IgniteUI. You can find more information about how to do this at http://www.igniteui.com. Additionally, Chapter 14 discusses both IgniteUI and the igDataChart in more detail. For the next code you use the IgniteUI Trial, which you have downloaded or is included with the download for this chapter from the companion website. Information about loading the trial version of IgniteUI can also be found at http://www.igniteui.com.
Mashing Visualizations Together
For this example, you are loading the same data as before into both an interactive data table and also an interactive chart. The data table is now editable, additionally, and editing the sales amount for a row causes both the mean column in the table to be updated as well as the linked chart's visuals to react. Selecting a column in the chart causes the appropriate row in the data table to be selected and vice versa.
Listing 7-8
<!DOCTYPE html>
<html>
<head>
<title>Table Row and Column Highlights</title>
<script type='text/javascript'
src='jquery/jquery-1.11.1.min.js'></script>
<script type="text/javascript"
src="jquery-ui-1.11.1/jquery-ui.js"></script>
<script type='text/javascript'
src="IgniteUI/js/infragistics.core.js"></script>
<script type='text/javascript'
src="IgniteUI/js/infragistics.dv.js"></script>
<link rel="stylesheet" href="IgniteUI/css/themes/infragistics/infragistics.theme.css">
<link rel="stylesheet" href="IgniteUI/css/structure/modules/infragistics.ui.shared.css">
<link rel="stylesheet" href="IgniteUI/css/structure/modules/infragistics.ui.chart.css">
<script type='text/javascript'
src="IgniteUI/js/infragistics.lob.js"></script>
<link rel="stylesheet" type="text/css" href="IgniteUI/css/structure/modules/infragistics.ui.grid.css">
<style>
#chart1
{
margin: 10px;
float: left;
}
#legend1
{
margin: 10px;
float: left;
}
#salesByRegion_container
{
clear: both;
}
#salesByRegion
{
margin: 10px;
max-width: 500px;
}
</style>
<script type="text/javascript">
var data = [{ "Region": "Northeast", "Sales": 100000,
"Mean": 142857.14 },
{ "Region": "Southeast", "Sales": 75000, "Mean": 142857.14 },
{ "Region": "Midwest", "Sales": 125000, "Mean": 142857.14 },
{ "Region": "Mid-Atlantic", "Sales": 125000, "Mean": 142857.14 },
{ "Region": "Southwest", "Sales": 75000, "Mean": 142857.14 },
{ "Region": "Northwest", "Sales": 100000, "Mean": 142857.14 },
{ "Region": "California", "Sales": 400000, "Mean": 142857.14 }];
var currSelectedIndex = -1;
var rowLookup = {};
data.map(function (item,index) {
rowLookup[item.Region] = index;
});
$(function () {
$("#chart1").igDataChart({
width: "500px",
height: "300px",
dataSource: data,
animateSeriesWhenAxisRangeChanges: true,
axes: [{
name: "xAxis",
type: "categoryX",
label: "Region",
interval: 1,
labelAngle: 45
}, {
name: "yAxis",
type: "numericY"
}],
series: [{
name: "Sales",
type: "column",
xAxis: "xAxis",
yAxis: "yAxis",
title: "Sales",
showTooltip: true,
valueMemberPath: "Sales",
isTransitionInEnabled: true,
isHighlightingEnabled: true,
isCustomCategoryStyleAllowed: true,
transitionDuration: 1000
}, {
name: "Mean",
type: "column",
xAxis: "xAxis",
yAxis: "yAxis",
title: "Mean",
showTooltip: true,
valueMemberPath: "Mean",
isTransitionInEnabled: true,
isHighlightingEnabled: true,
isCustomCategoryStyleAllowed: true,
transitionDuration: 1000
}],
legend: { element: "legend1" },
assigningCategoryStyle: function (evt, ui) {
if (currSelectedIndex >= ui.startIndex &&
currSelectedIndex <= ui.endIndex) {
ui.fill = "#FFB84D";
}
},
seriesMouseLeftButtonUp: function (evt, ui) {
var index = rowLookup[ui.item.Region];
currSelectedIndex = index;
updateSelectedIndex(true);
}
});
var updateMeans = function () {
var count = data.length;
var sum = 0;
data.map(function (item) { sum += item.Sales });
var mean = sum / count;
data.map(function (item) { item.Mean = mean });
$("#salesByRegion").igGrid("dataBind");
$("#chart1").igDataChart("notifyClearItems", data);
};
var updateSelectedIndex = function (fromChart) {
if (fromChart) {
var rows = $("#salesByRegion").igGrid("rows");
var key = data[currSelectedIndex].Region;
var index = -1;
$(rows).each(function(i, ele) {
if ($(ele).attr("data-id") == key) {
index = i;
}
});
$('#salesByRegion').igGridSelection(
'selectRow', index);
}
$("#chart1").igDataChart("notifyVisualPropertiesChanged",
"Sales");
$("#chart1").igDataChart("notifyVisualPropertiesChanged",
"Mean");
}
$("#salesByRegion").igGrid({
autoCommit: true,
dataSource: data,
autoGenerateColumns: false,
primaryKey: "Region",
columns: [
{ headerText: "Region",
key: "Region",
dataType: "string" },
{ headerText: "Sales",
key: "Sales",
dataType: "number",
format: "currency" },
{ headerText: "Mean",
key: "Mean",
dataType: "number",
format: "currency" }
],
features: [
{
name : 'Sorting',
type: "local"
},
{
name: "Resizing"
},
{
name: "ColumnMoving",
columnMovingDialogContainment: "window"
},
{
name: 'Updating',
enableAddRow: false,
enableDeleteRow: false,
editRowEnded: function (evt, ui) {
updateMeans();
},
columnSettings: [{
columnKey: "Region",
editorOptions: {readOnly: true}
},{
columnKey: "Mean",
editorOptions: {readOnly: true}
}]
},
{
name: "Selection",
mode: 'row',
rowSelectionChanged: function (evt, ui) {
currSelectedIndex = rowLookup[ui.row.id];
updateSelectedIndex(false);
}
}
]
});
});
</script>
</head>
<body>
<div id="chart1"></div>
<div id="legend1"></div>
<table id="salesByRegion"></table>
</body>
</html>
Diving into Listing 7-8, first you have some CSS:
<style>
#chart1
{
margin: 10px;
float: left;
}
#legend1
{
margin: 10px;
float: left;
}
#salesByRegion_container
{
clear: both;
}
#salesByRegion
{
margin: 10px;
max-width: 500px;
}
</style>
This ensures that the chart and the legend appear next to each other, and the data table appears beneath. Following that, you have
var data = [{ "Region": "Northeast", "Sales": 100000,
"Mean": 142857.14 },
{ "Region": "Southeast", "Sales": 75000, "Mean": 142857.14 },
{ "Region": "Midwest", "Sales": 125000, "Mean": 142857.14 },
{ "Region": "Mid-Atlantic", "Sales": 125000, "Mean": 142857.14 },
{ "Region": "Southwest", "Sales": 75000, "Mean": 142857.14 },
{ "Region": "Northwest", "Sales": 100000, "Mean": 142857.14 },
{ "Region": "California", "Sales": 400000, "Mean": 142857.14 }];
var currSelectedIndex = -1;
var rowLookup = {};
data.map(function (item,index) {
rowLookup[item.Region] = index;
});
Here you are starting with the data in JSON format rather than from a <table> to show another mechanism for table creation and to ease binding the data against multiple visualizations. You are also building a hashtable to aid looking up the data indexes based on the region name.
$(function () {
$("#chart1").igDataChart({
width: "500px",
height: "300px",
dataSource: data,
animateSeriesWhenAxisRangeChanges: true,
axes: [{
name: "xAxis",
type: "categoryX",
label: "Region",
interval: 1,
labelAngle: 45
}, {
name: "yAxis",
type: "numericY"
}],
series: [{
name: "Sales",
type: "column",
xAxis: "xAxis",
yAxis: "yAxis",
title: "Sales",
showTooltip: true,
valueMemberPath: "Sales",
isTransitionInEnabled: true,
isHighlightingEnabled: true,
isCustomCategoryStyleAllowed: true,
transitionDuration: 1000
}, {
name: "Mean",
type: "column",
xAxis: "xAxis",
yAxis: "yAxis",
title: "Mean",
showTooltip: true,
valueMemberPath: "Mean",
isTransitionInEnabled: true,
isHighlightingEnabled: true,
isCustomCategoryStyleAllowed: true,
transitionDuration: 1000
}],
legend: { element: "legend1" },
assigningCategoryStyle: function (evt, ui) {
if (currSelectedIndex >= ui.startIndex &&
currSelectedIndex <= ui.endIndex) {
ui.fill = "#FFB84D";
}
},
seriesMouseLeftButtonUp: function (evt, ui) {
var index = rowLookup[ui.item.Region];
currSelectedIndex = index;
updateSelectedIndex(true);
}
});
Here you are declaring an igDataChart that is bound against the preceding data. It has two column series that are bound to the sales data and the mean data respectively. Those column series are set to transition into view in an animated fashion, and are also set to animate subsequent data changes that will be coming from the igGrid. The assigningCategoryStyle event has been handled in order that the series can color the currently selected items with an orange color. Finally, the seriesMouseLeftButtonUp event is handled so that when items in the series are clicked the selected item in the igGrid can also be changed.
Skipping over the update methods for now, you have the declaration of the igGrid:
$("#salesByRegion").igGrid({
autoCommit: true,
dataSource: data,
autoGenerateColumns: false,
primaryKey: "Region",
columns: [
{ headerText: "Region",
key: "Region",
dataType: "string" },
{ headerText: "Sales",
key: "Sales",
dataType: "number",
format: "currency" },
{ headerText: "Mean",
key: "Mean",
dataType: "number",
format: "currency" }
],
features: [
{
name : 'Sorting',
type: "local"
},
{
name: "Resizing"
},
{
name: "ColumnMoving",
columnMovingDialogContainment: "window"
},
{
name: 'Updating',
enableAddRow: false,
enableDeleteRow: false,
editRowEnded: function (evt, ui) {
updateMeans();
},
columnSettings: [{
columnKey: "Region",
editorOptions: {readOnly: true}
},{
columnKey: "Mean",
editorOptions: {readOnly: true}
}]
},
{
name: "Selection",
mode: 'row',
rowSelectionChanged: function (evt, ui) {
currSelectedIndex = rowLookup[ui.row.id];
updateSelectedIndex(false);
}
}
]
});
This defines an igGrid against the same data as the preceding chart definition. It is set to automatically commit changes because you want the chart to update its content immediately when you finish editing a row in the table. autoGenerateColumns is set to false so that you can specify the data type and formatting for each of the columns manually, and the primary key for the data items is identified as being the Region property. The primary key is important so that rows can be discriminated from each other to support various features of the igGrid. Following that, various features are turned on for the igGrid:
{
name : 'Sorting',
type: "local"
},
{
name: "Resizing"
},
{
name: "ColumnMoving",
columnMovingDialogContainment: "window"
},
This code enables the sorting feature of the igGrid and indicates that the sorting should be performed locally in the browser (rather than remotely). It also turns on the column resizing feature in the igGrid, and, finally, it also enables the user to drag the columns to reorder them.
{
name: 'Updating',
enableAddRow: false,
enableDeleteRow: false,
editRowEnded: function (evt, ui) {
updateMeans();
},
columnSettings: [{
columnKey: "Region",
editorOptions: {readOnly: true}
},{
columnKey: "Mean",
editorOptions: {readOnly: true}
}]
},
This turns on the updating feature for the igGrid. The ability to add and remove rows is hidden because this is not needed for this scenario, and the Region and Mean columns are marked as being read only. This is because the Mean column is auto-calculated based on the Sales column, and the Region column is the primary key and should remain constant. The editRowEnded event is handled in order to call the updateMeans method which updates the Mean column based on the new Sales figures and propagates all the data to the chart.
{
name: "Selection",
mode: 'row',
rowSelectionChanged: function (evt, ui) {
currSelectedIndex = rowLookup[ui.row.id];
updateSelectedIndex(false);
}
}
This turns on the selection feature for the grid and ensures that entire rows are selected, rather than just cells. The rowSelectionChanged event is handled, so that the current selected index can be tracked and the updateSelectedIndex function is called to propagate the selection change to the chart.
var updateMeans = function () {
var count = data.length;
var sum = 0;
data.map(function (item) { sum += item.Sales });
var mean = sum / count;
data.map(function (item) { item.Mean = mean });
$("#salesByRegion").igGrid("dataBind");
$("#chart1").igDataChart("notifyClearItems", data);
};
The updateMeans function calculates the new mean value based on the updated sales data and sets it back into the data array. It then rebinds the igGrid, and notifies the igDataChart that all of the items' values have changed.
var updateSelectedIndex = function (fromChart) {
if (fromChart) {
var rows = $("#salesByRegion").igGrid("rows");
var key = data[currSelectedIndex].Region;
var index = -1;
$(rows).each(function(i, ele) {
if ($(ele).attr("data-id") == key) {
index = i;
}
});
$('#salesByRegion').igGridSelection('selectRow', index);
}
$("#chart1").igDataChart("notifyVisualPropertiesChanged", "Sales");
$("#chart1").igDataChart("notifyVisualPropertiesChanged", "Mean");
}
The updateSelectedIndex function loops through the visible rows in the igGrid and finds the index of the row that matches the primary key for the selected data item and asks the igGrid to select that row. Then it notifies the chart to invalidate the visuals of the two contained series so that the selection change can be shown. You can see the results of this in Figure 7.15.
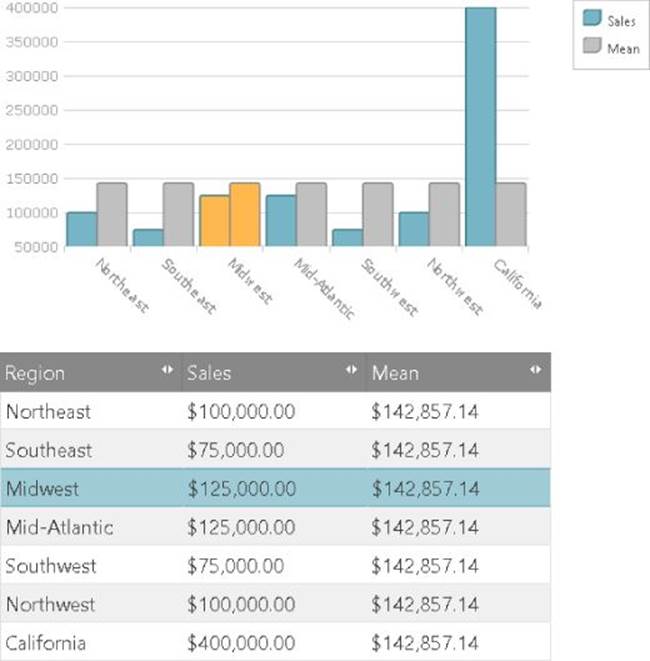
Figure 7.15 This shows the same data using two separate data visualizations.
Pretty cool, huh? Notice that when you click the columns in the top chart, it selects the appropriate rows in the data table below. Correspondingly, when you select rows in the bottom data table it highlights the appropriate columns in the upper chart. When you click again on the selected row it enters edit mode and you are able to change the sales value for that region. When you select done, or press enter, not only do the values in the mean column update, but the columns in the upper chart also animate to the corresponding new positions. You can see the edit mode experience in Figure 7.16.
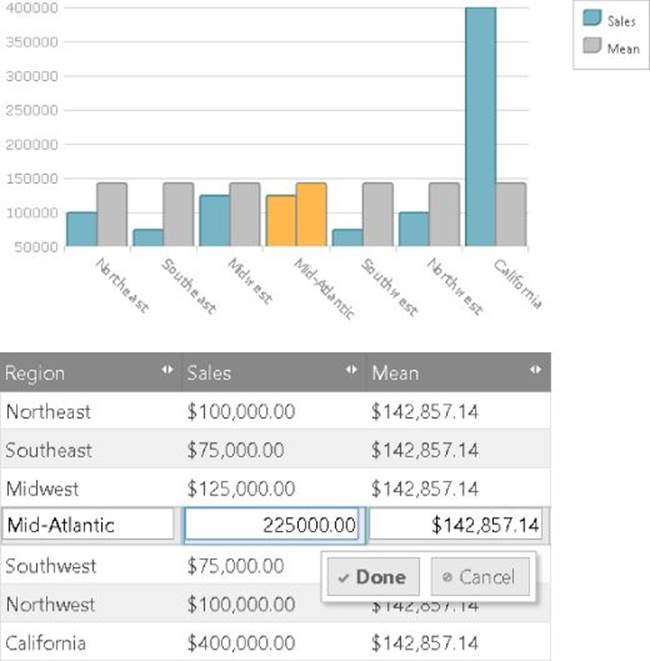
Figure 7.16 This shows the edit mode experience in the igGrid and the corresponding highlighted column in the igDataChart.
Finally, see how you can click the columns to change the sort order of the data rows in the table, and that you can drag the columns to reorder them. Pretty complex behavior for not a lot of code, huh?
The igGrid component has many other interesting features, such as the ability to filter the displayed data on the fly, or to maintain good performance even with large amounts of data loaded. You can find more information about its available features athttp://igniteui.com/grid/overview.
Summary
Data tables provide an important data visualization technique. They can provide data in a very concise format and, with the correct design decisions, can be accessible to a very wide audience. In this chapter you learned how to
· Format a basic table using HTML
· Enhance the semantic content with markup to aid accessibility and styling
· Make a table more accessible to screen readers
· Caption a table to provide context for the data
· Style a table with CSS
· Style a table with JavaScript
· Create alternating row highlights for a table using CSS and JavaScript
· Highlight the hovered row or column in a table
· Generate calculated columns with JavaScript
· Use the DataTables library to enhance an HTML table
· Use the DataTables library to sort columns
· Use the DataTables library to generate calculated columns
· Use IgniteUI igGrid and igDataChart to present multiple linked, interactive views of the same data.