Wrox Press Beginning JavaScript 5th (2015)
Chapter 18. Common Mistakes, Debugging, and Error Handling
WHAT YOU WILL LEARN IN THIS CHAPTER:
· Spotting common mistakes that everyone makes—even pros!
· Handling runtime errors, or exceptions, with the try…catch statement
· Debugging JavaScript with the development tools of various browsers
WROX.COM CODE DOWNLOADS FOR THIS CHAPTER
You can find the wrox.com code downloads for this chapter at http://www.wiley.com/go/BeginningJavaScript5E on the Download Code tab. You can also view all of the examples and related files at http://beginningjs.com.
Even a JavaScript guru makes mistakes, even if they are just annoying typos. In particular, when code expands to hundreds or thousands of lines, the chance of something going wrong becomes much greater. In proportion, the difficulty in finding these mistakes, or bugs, also increases. In this chapter you look at various techniques that will help you minimize the problems that arise from this situation.
You start by taking a look at the top seven JavaScript coding mistakes. After you know what they are, you’ll be able to look out for them when writing code, hopefully, so that you won’t make them so often!
Then you look at how you can cope with errors when they do happen, so that you prevent users from seeing your coding mistakes.
Finally, you look at the debugging tools in Microsoft’s Internet Explorer (IE11), Firebug (an add-on for Firefox), Chrome’s Web Inspector, and Opera’s Dragonfly. You see how you can use these tools to step through your code and check the contents of variables while the code is running, a process that enables you to hunt for difficult bugs. You also take a briefer look at the debugging tools available for Firefox.
D’OH! I CAN’T BELIEVE I JUST DID THAT: SOME COMMON MISTAKES
Several common mistakes are made by programmers. Some of these you’ll learn to avoid as you become more experienced, but others may haunt you forever!
Undefined Variables
JavaScript is actually very easygoing when it comes to defining your variables before assigning values to them. For example, the following will implicitly create the new global variable abc and assign it to the value 23:
abc = 23;
Although strictly speaking, you should define the variable explicitly with the var keyword like this:
var abc = 23;
Your choice of whether to use the var keyword to declare a variable has a consequence on the variable’s scope; so it is always best to use the var keyword. If a variable is used before it has been defined, an error will arise. For example, the following code will cause the error shown in Figure 18.1 in IE11 if the variable abc has not been previously defined (explicitly or implicitly):
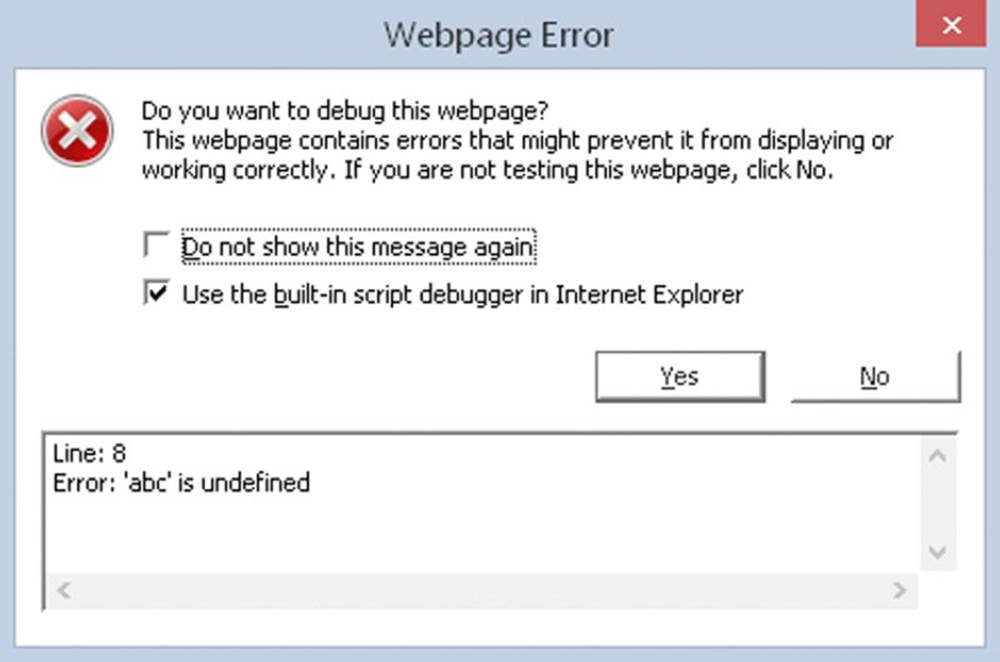
Figure 18.1
alert(abc);
In other browsers, you’ll need to look in the JavaScript console, which you can view by pressing Ctrl+Shift+J on your keyboard. You can also view the console by navigating through the browser’s menu. You learn how to do this later.
In addition, you must remember that function definitions also have parameters, which if not declared correctly can lead to the same type of error.
Take a look at the following code:
function foo(parametrOne) {
alert(parameterOne);
}
If you call this function, you get an error message similar to the one shown in Figure 18.2.
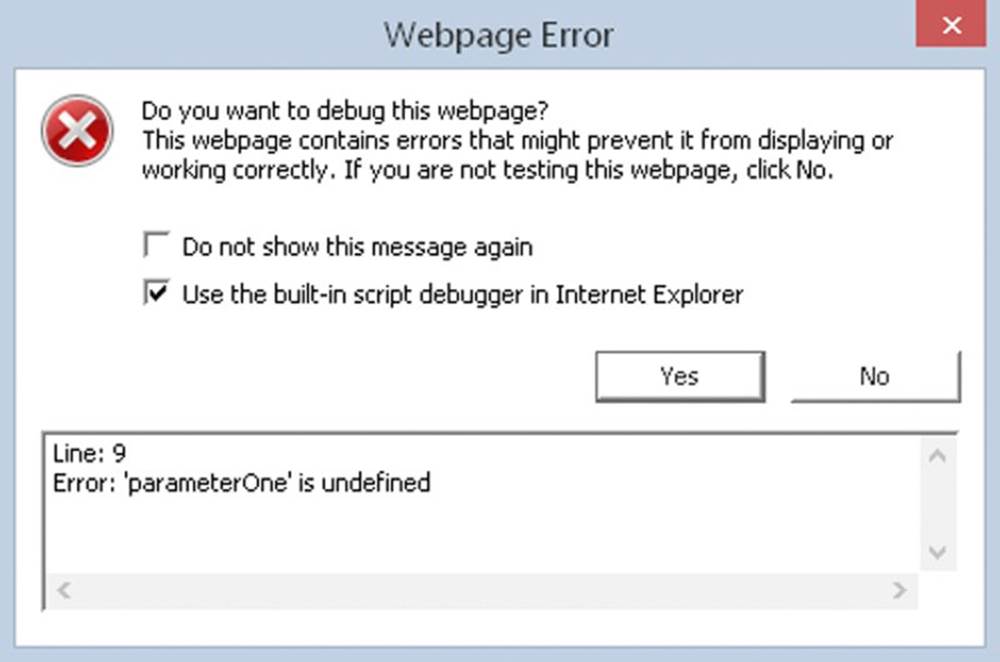
Figure 18.2
The error here is actually a simple typo in the function definition. The function’s parameter should read parameterOne, not parametrOne. What can be confusing with this type of error is that although the browser tells us the error is on one line, the source of the error is on another line.
Case Sensitivity
This is a major source of errors, particularly because it can be difficult to spot at times.
For example, spot the three case errors in the following code:
var myName = "Jeremy";
If (myName == "jeremy") {
alert(myName.toUppercase());
}
The first error is the if keyword; the code above has If rather than if. However, JavaScript won’t tell us that the error is an incorrect use of case, but instead the browser will tell us Object expected or that If is not defined. Although error messages give us some idea of what’s gone wrong, they often do so in an oblique way. In this case the browser thinks you are either trying to use an object called If or use an undefined function called If.
NOTE Different browsers use different wording when displaying errors. The overall meaning is the same, however, so you can identify what the problem is.
Okay, with that error cleared up, you come to the next error, not one of JavaScript syntax, but a logic error. Remember that Jeremy does not equal jeremy in JavaScript, so myName == "jeremy" is false, even though it’s quite likely that you didn’t care whether the word isJeremy or jeremy. This type of error will result in no error message at all because it is valid JavaScript; your only clue is that your code will not execute as you’d planned.
The third fault is with the toUpperCase() method of the String object. The previous code uses toUppercase, with the C in lowercase. IE gives us the message Object doesn't support this property or method and Firefox reports that myName.toUppercase is not a function. On first glance it would be easy to miss such a small mistake and start checking your JavaScript reference guide for that method. You might wonder why it’s there, but your code is not working. Again, you always need to be aware of case, something that even experts get wrong from time to time.
Incorrect Number of Closing Braces
In the following code, you define a function and then call it. However, there’s a deliberate mistake. See if you can spot where it is:
function myFunction()
{
var x = 1;
var y = 2;
if (x <= y)
{
if (x == y)
{
alert("x equals y");
}
}
myFunction();
This is why formatting your code is important—you’ll have a much easier time spotting errors such as this:
function myFunction() {
var x = 1;
var y = 2;
if (x <= y) {
if (x == y) {
alert("x equals y");
}
}
myFunction();
Now you can see that the ending curly brace of the function is missing. When you have a lot of if, for, or do while statements, it’s easy to have too many or too few closing braces. This type of problem is much easier to spot with formatted code.
Incorrect Number of Closing Parentheses
Similarly, not having the correct number of closing parentheses can be problematic. Take a look at the following code:
if (myVariable + 12) / myOtherVariable < myString.length)
Spot the mistake? The problem is the missing parenthesis at the beginning of the condition. You want myVariable + 12 to be calculated before the division by myOtherVariable is calculated, so quite rightly you know you need to put it in parentheses:
(myVariable + 12) / myOtherVariable
However, the if statement’s condition must also be in parentheses. Not only is the initial parenthesis missing, but there is one more closing parenthesis than opening parentheses. Like curly braces, each opening parenthesis must have a closing parenthesis. The following code is correct:
if ((myVariable + 12) / myOtherVariable < myString.length)
It’s very easy to miss a parenthesis or have one too many when you have many opening and closing parentheses.
Using Equals (=) Rather than Equality (==)
The equality operator is a commonly confused operator. Consider the following code:
var myNumber = 99;
if (myNumber = 101) {
alert("myNumber is 101");
} else {
alert("myNumber is " + myNumber);
}
At first glance, you’d expect that the code inside the else statement would execute, telling us that the number in myNumber is 99. It won’t. This code makes the classic mistake of using the assignment operator (=) instead of the equality operator (==). Hence, instead of comparing myNumber with 101, this code sets myNumber to equal 101.
What makes things even trickier is that JavaScript does not report this as an error; it’s valid JavaScript! The only indication that something isn’t correct is that your code doesn’t work. Assigning a variable a value in an if statement may look like an error, but it’s perfectly legal.
When embedded in a large chunk of code, a mistake like this is easily overlooked. Just remember it’s worth checking for this error the next time your program doesn’t do what you expect. Debugging your code can help easily spot this type of error. You learn how to debug your code later in this chapter.
Using a Method as a Property and Vice Versa
Another common error is where either you forget to put parentheses after a method with no parameters, or you use a property and do put parentheses after it.
When calling a method, you must always have parentheses following its name; otherwise, JavaScript thinks that it must be a pointer to the method or a property. For example, examine the following code:
var nowDate = new Date();
alert(nowDate.getMonth);
The first line creates a Date object, and the second line uses its getMonth property. But you know that Date objects do not have a getMonth property; it’s supposed to be a method. Now, this is valid JavaScript because you can pass a function pointer—which is whatnowDate.getMonth is—to another function, and as such, the browser will not have any issues executing this code. And in many cases, you want to do that (like when registering event listeners). But chances are very good that we intended to call getMonth(). Therefore, the following is the corrected code:
var nowDate = new Date();
alert(nowDate.getMonth());
NOTE To perhaps confuse the issue: technically, JavaScript doesn’t have methods. What we think of as methods are actually functions assigned to an object’s properties. But it’s generally accepted to use the term method to describe such properties.
Similarly, another common mistake is to type parentheses after a property, making JavaScript think that you are trying to use a method of that object:
var myString = "Hello, World!";
alert(myString.length());
The second line uses the length property as a method, and JavaScript will attempt to treat it as one. When this code executes, you will see an error because length cannot be called as a method. This code should have been written like this:
var myString = new String("Hello");
alert(myString.length);
Missing Plus Signs During Concatenation
Ordinarily, string concatenation is a straightforward process, but it can become confusing when working with many variables and values. For example, there’s a deliberate concatenation mistake in the following code. Spot it:
var myName = "Jeremy";
var myString = "Hello";
var myOtherString = "World";
myString = myName + " said " + myString + " " myOtherString;
alert(myString);
There should be a + operator between " " and myOtherString in the final line of code.
Although easy to spot in just a few lines, this kind of mistake can be more difficult to spot in large chunks of code. Also, the error message this type of mistake causes can be misleading. Load this code into a browser and you you’ll be told Error : Expected ';' by IE,Missing ; before statement by Firefox, and SyntaxError: Unexpected identifier in Chrome. It’s surprising how often this error crops up.
These most common mistakes are errors caused by the programmer. Other types of errors, called runtime errors, occur when your code executes in the browser, and they aren’t necessarily caused by a typo or a missing curly brace or parenthesis. Runtime errors can still be planned for, as you see in the next section.
ERROR HANDLING
When writing your programs, you want to be informed of every error. However, the last things you want the user to see are error messages when you finally deploy the code to a web server for the whole world to access. Of course, writing bug-free code would be a good start, but keep the following points in mind:
· Conditions beyond your control can lead to errors. A good example of this is when you are relying on Ajax to talk to the web server, and something happens to the user’s network connection.
· Murphy’s Law states that anything that can go wrong will go wrong!
Preventing Errors
The best way to handle errors is to stop them from occurring in the first place. That seems like stating the obvious, but you should do a number of things if you want error-free pages:
· Thoroughly check pages in as many browsers as possible. This is easier said than done on some operating systems. The alternative is for you to decide which browsers you want to support for your web page, and then verify that your code works in them.
· Validate your data. If users can enter dud data that will cause your program to fail, then they will. Make sure that a text box has data entered into it if your code fails when the text box is empty. If you need a whole number, make sure that the user entered one. Is the date the user just entered valid? Is the e-mail address mind your own business the user just entered likely to be valid? No, so you must check that it is in the format something@something.something.
Okay, so let’s say you carefully checked your pages and there is not a syntax or logic error in sight. You added data validation that confirms that everything the user enters is in a valid format. Things can still go wrong, and problems may arise that you can do nothing about. Here’s a real-world example of something that can still go wrong.
One professional created an online message board that relies on a small Java applet to enable the transfer of data to and from the server without reloading the page (this was before Ajax). He checked the code and everything was fine, and it continued to work fine after launching the board, except that in about five percent of cases the Java applet initialized but then caused an error due to the user being behind a particular type of firewall (a firewall is a means of stopping intruders from getting into a local computer network, and many block Java applets because of Java’s security issues). It’s impossible to determine whether a user is behind a certain type of firewall, so there is nothing that can be done in that sort of exceptional circumstance. Or is there?
In fact, JavaScript includes something called the try...catch statement. This enables you to try to run your code; if it fails, the error is caught by the catch clause and can be dealt with as you wish. For the message board, this professional used a try...catch clause to catch the Java applet’s failure and redirected the user to a more basic page that still displayed messages, but without using the applet.
The try…catch Statements
The try...catch statements work as a pair; you can’t have one without the other. You use the try statement to define a block of code that you want to try to execute, and use the catch statement to define a block of code that executes when an exception occurs in the trystatement. The term exception is key here; it means a circumstance that is extraordinary and unpredictable. Compare that with an error, which is something in the code that has been written incorrectly. If no exception occurs, the code inside the catch statement never executes. The catch statement also enables you to get the contents of the exception message that would have been shown to the user had you not caught it first.
Let’s create a simple example of a try...catch clause:
<!DOCTYPE html>
<html lang="en">
<head>
<title>Chapter 18: Example 1</title>
</head>
<body>
<script>
try {
alert("This is code inside the try clause");
alert("No Errors so catch code will not execute");
} catch (exception) {
alert("The error is " + exception.message);
}
</script>
</body>
</html>
Save this as ch18_example1a.html and open it in your browser.
This code defines the try statement, and as with all other blocks of code, you mark out the try block by enclosing it in curly braces.
Immediately following the try block is the catch statement, and notice that it includes exception inside a set of parentheses. This exception is simply a variable name, and it stores an object that contains information about any exception that may occur inside the trycode block. We’ll call this object the exception object. Although the word exception is used here, you can use any valid variable name. For example, catch(ex) would be fine.
The exception object contains several properties that provide information about the exception that occurred, but the most commonly used properties are name and message. The aptly named name property contains the name of the error type, and the message property contains the error message the user would normally see.
Back to the code at hand, within the catch block is the code that executes when an exception occurs. In this case, the code within the try block will not throw an exception, and so the code inside the catch block will never execute.
But let’s insert a deliberate error. Change the highlighted line in the following code:
try {
alert("This is code inside the try clause");
ablert("No Errors so catch code will not execute");
} catch (exception) {
alert("The error is " + exception.message);
}
Save the document as ch18_example1b.html and open it in your browser.
The browser will start executing this code as normal. It will execute the first call to alert()inside the try block and display the message to the user. However, the call to ablert() will cause an exception. The browser will stop executing the try block, and instead will start executing the catch block. You’ll see a message similar to "The error is ablert is not defined."
Let’s change this code once again to introduce a different error. As before, modify the highlighted line in the following code:
try {
alert("This is code inside the try clause");
alert('This code won't work');
} catch (exception) {
alert("The error is " + exception.message);
}
Save this as ch18_example1c.html and open it in your browser. You will not see any alert box because this code contains a syntax error; the functions and methods are valid, but you have an invalid character. The single quote in the word won't has ended the string value being passed to alert().
Before executing any code, the JavaScript engine goes through all the code and checks for syntax errors, or code that breaches JavaScript’s rules. If the engine finds a syntax error, the browser deals with it as usual; your try clause never runs and therefore cannot handle syntax errors.
Throwing Errors
You can use the throw statement to create your own runtime exceptions. Why create a statement to generate an exception, when a bit of bad coding will do the same?
Throwing errors can be very useful for indicating problems such as invalid user input. Rather than using lots of if...else statements, you can check the validity of user input, then use throw to stop code execution in its tracks and cause the error-catching code in thecatch block of code to take over. In the catch clause, you can determine whether the error is based on user input, in which case you can notify the user what went wrong and how to correct it. Alternatively, if it’s an unexpected error, you can handle it more gracefully than with lots of JavaScript errors.
You can throw anything; from a simple string or number to an object. In most cases, however, you’ll throw an object. To use throw, type throw and include the object after it. For example, if you are validating a set of form fields, your exception object could contain not only the message, but the id of the element that has invalid data. An example could look like this:
throw {
message : "Please type a valid email address",
elementId : "txtEmail"
};
The objects you throw should include at least a message property; most error-handling code will be looking for it.
TRY IT OUT try…catch and Throwing Errors
In this example you modify ch16_example2.html to use the try...catch and throw statements to validate the e-mail and username fields. Feel free to use ch16_example2.html as a basis for this new file. For your convenience, the following code listing highlights the key changes:
<!DOCTYPE html>
<html lang="en">
<head>
<title>Chapter 18: Example 2</title>
<style>
.fieldname {
text-align: right;
}
.submit {
text-align: right;
}
</style>
</head>
<body>
<form>
<table>
<tr>
<td class="fieldname">
Username:
</td>
<td>
<input type="text" id="username" />
</td>
<td>
<a id="usernameAvailability" href="#">Check Availability</a>
</td>
</tr>
<tr>
<td class="fieldname">
Email:
</td>
<td>
<input type="text" id="email" />
</td>
<td>
<a id="emailAvailability" href="#">Check Availability</a>
</td>
</tr>
<tr>
<td class="fieldname">
Password:
</td>
<td>
<input type="text" id="password" />
</td>
<td />
</tr>
<tr>
<td class="fieldname">
Verify Password:
</td>
<td>
<input type="text" id="password2" />
</td>
<td />
</tr>
<tr>
<td colspan="2" class="submit">
<input type="submit" value="Submit" />
</td>
<td />
</tr>
</table>
</form>
<script src="jquery-2.1.1.min.js"></script>
<script>
function checkUsername(e) {
e.preventDefault();
var userValue = $("#username").val();
try {
if (!userValue) {
throw {
message: "Please enter a user name to check!"
};
}
var parms = {
username: userValue
};
$.getJSON("ch14_formvalidator.php", parms).done(handleResponse);
} catch (ex) {
alert(ex.message);
}
}
function checkEmail(e) {
e.preventDefault();
var emailValue = $("#email").val();
try {
if (!emailValue) {
throw {
message: "Please enter an email address to check!"
};
}
var parms = {
email: emailValue
};
$.getJSON("ch14_formvalidator.php", parms).done(handleResponse);
} catch (ex) {
alert(ex.message);
}
}
function handleResponse(response) {
if (response.available) {
alert(response.searchTerm + " is available!");
} else {
alert("We're sorry, but " + response.searchTerm +
" is not available.");
}
}
$("#usernameAvailability").on("click", checkUsername);
$("#emailAvailability").on("click", checkEmail);
</script>
</body>
</html>
Remember that this example relies upon Ajax in order to work; so, be sure to save this page as ch18_example2.html in your web server’s root. In case you haven’t set up a web server yet, see Chapter 14 for more information.
You know how this example works, so we’ll focus only on the highlighted code.
Let’s first look at the checkUsername() function. It has been rewritten to use the try...catch and throw statements for validating the username <input/> element, and the majority of this function’s code resides within the try block:
try {
if (!userValue) {
throw {
message: "Please enter a user name to check!"
};
}
var parms = {
username: userValue
};
$.getJSON("ch14_formvalidator.php", parms).done(handleResponse);
}
Before you make the Ajax request, you first ensure the user provided a value to the username field. If userValue is blank, you throw a new object detailing the cause of the exception with its message property. This causes the JavaScript engine to stop executing code in this try block and starts executing the catch block:
catch (ex) {
alert(ex.message);
}
Here, you simply alert the exception’s message property, displaying the “Please enter a user name to check!” message to the user.
Naturally, the changes made to the checkEmail() function are almost identical to checkUsername():
try {
if (!emailValue) {
throw {
message: "Please enter an email address to check!"
};
}
var parms = {
email: emailValue
};
$.getJSON("ch14_formvalidator.php", parms).done(handleResponse);
} catch (ex) {
alert(ex.message);
}
Once again, the majority of the function code resides within a try code block. If the e-mail field validation fails, you throw an object containing the exception message and display that message in an alert box—the result of executing the code in the catchblock.
Nested try…catch Statements
So far you’ve been using just one try...catch statement, but it’s possible to include a try...catch statement inside another try statement. Indeed, you can go further and have a try...catch inside the try statement of this inner try...catch, or even another inside that, the limit being what it’s actually sensible to do.
So why would you use nested try...catch statements? Well, you can deal with certain errors inside the inner try...catch statement. If, however, you’re dealing with a more serious error, the inner catch clause could pass that error to the outer catch clause by throwing the error to it.
Here’s an example:
try {
try {
ablurt("This code has an error");
} catch(exception) {
var name = exception.name;
if (name == "TypeError" || name == "ReferenceError") {
alert("Inner try...catch can deal with this error");
} else {
throw exception;
}
}
} catch(exception) {
alert("The inner try...catch could not handle the exception.");
}
In this code you have two try...catch pairs, one nested inside the other.
The inner try statement contains a line of code that contains an error. The catch statement of the inner try...catch checks the value of the error’s name. If the exception’s name is either TypeError or ReferenceError, the inner try...catch deals with it by way of an alertbox (see Appendix B for a full list of error types and their descriptions). Unfortunately, and unsurprisingly, the type of error thrown by the browser depends on the browser itself. In the preceding example, IE reports the error as a TypeError whereas the other browsers report it as a ReferenceError.
If the error caught by the inner catch statement is any other type of error, it is thrown up in the air again for the catch statement of the outer try...catch to deal with.
finally Clauses
The try...catch statement has a finally clause that defines a block of code that always executes—even if an exception wasn’t thrown. The finally clause can’t appear on its own; it must be after a try block, which the following code demonstrates:
try {
ablurt("An exception will occur");
} catch(exception) {
alert("Exception occurred");
} finally {
alert("This line always executes");
}
The finally part is a good place to put any cleanup code that needs to execute regardless of any exceptions that previously occurred.
You’ve seen the top mistakes made by developers, and you’ve also seen how to handle errors in your code. Unfortunately, errors will still occur in your code, so let’s take a look at one way to make remedying them easier by using a debugger.
DEBUGGING
JavaScript is traditionally looked upon as a difficult language to write and debug due to the lack of decent development tools. This, however, is no longer the case thanks to the tools made available through the browser: the debugging tools available for Internet Explorer, Firefox, Chrome, and Opera. With these tools, you can halt the execution of your script with breakpoints and then step through code line by line to see exactly what is happening.
You can also find out what data is being held in variables and execute statements on the fly. Without debuggers, the best you can do is use the alert() method in your code to show the state of variables at various points.
Debugging is generally universal across all browsers, and even languages. Some debugging tools may offer more features than others, but for the most part, the following concepts apply to any debugger:
· Breakpoints tell the debugger it should break, or pause code execution, at a certain point. You can set a breakpoint anywhere in your JavaScript code, and the debugger will halt code execution when it reaches the breakpoint.
· Watches enable you to specify variables that you want to inspect when your code pauses at a breakpoint.
· The call stack is a record of what functions and methods have been executed to the breakpoint.
· The console enables you to execute JavaScript commands in the context of the page and within the scope of the breakpoint. In addition, it catalogs all JavaScript errors found in the page.
· Stepping is the most common procedure in debugging. It enables you to execute one line of code at a time. You can step through code in three ways:
· Step Into executes the next line of code. If that line is a function call, the debugger executes the function and halts at the first line of the function.
· Step Over, like Step Into, executes the next line of code. If that line is a function, Step Over executes the entire function and halts at the first line outside the function.
· Step Out returns to the calling function when you are inside a called function. Step Out resumes the execution of code until the function returns. It then breaks at the return point of the function.
Before delving into the various debuggers, let’s create a page you can debug:
<!DOCTYPE html>
<html lang="en">
<head>
<title>Chapter 18: Example 3</title>
</head>
<body>
<script>
function writeTimesTable(timesTable) {
var writeString;
for (var counter = 1; counter < 12; counter++) {
writeString = counter + " * " + timesTable + " = ";
writeString = writeString + (timesTable * counter);
writeString = writeString + "<br />";
document.write(writeString);
}
}
writeTimesTable(2);
</script>
</body>
</html>
Save this as ch18_example3.html. You will need to open this file in each browser in order to debug it.
The next section walks you through the features and functionality of Chrome’s JavaScript debugger. Because of the universal nature of debugging and debuggers, the sections for Internet Explorer, Firefox, and Safari will merely familiarize you with the UI for each browser’s debugger and point out any differences.
Debugging in Chrome (and Opera)
Chrome and Opera use the same rendering and JavaScript engine, and as such, they also share the same development tools. For the sake of simplicity, this section focuses on Chrome, but keep in mind that Opera is exactly the same.
You can access Chrome’s developer tools a couple of ways. You can click the “hamburger menu” in the top right-hand corner of the window and select More Tools ➢ Developers tools. You can also open them by pressing the F12 key.
NOTE You’ll find that F12 opens the developer tools in almost every browser.
By default, the Developer tools opens as a panel in Chrome (see Figure 18.3).
Figure 18.3
You can pop it out to its own window by clicking the icon next to the Close button.
Open ch18_example3.html (either from your computer or the web) in Chrome and open Chrome’s developer tools.
The JavaScript debugger is contained in the Sources tab, and it is made up of three panels (Figure 18.4). The left panel contains the list of sources to choose from. You’ll only see one source available in this chapter because there is only one file loaded by the browser. But if you load a page with multiple external JavaScript files, you’ll find each of them listed in the left panel.
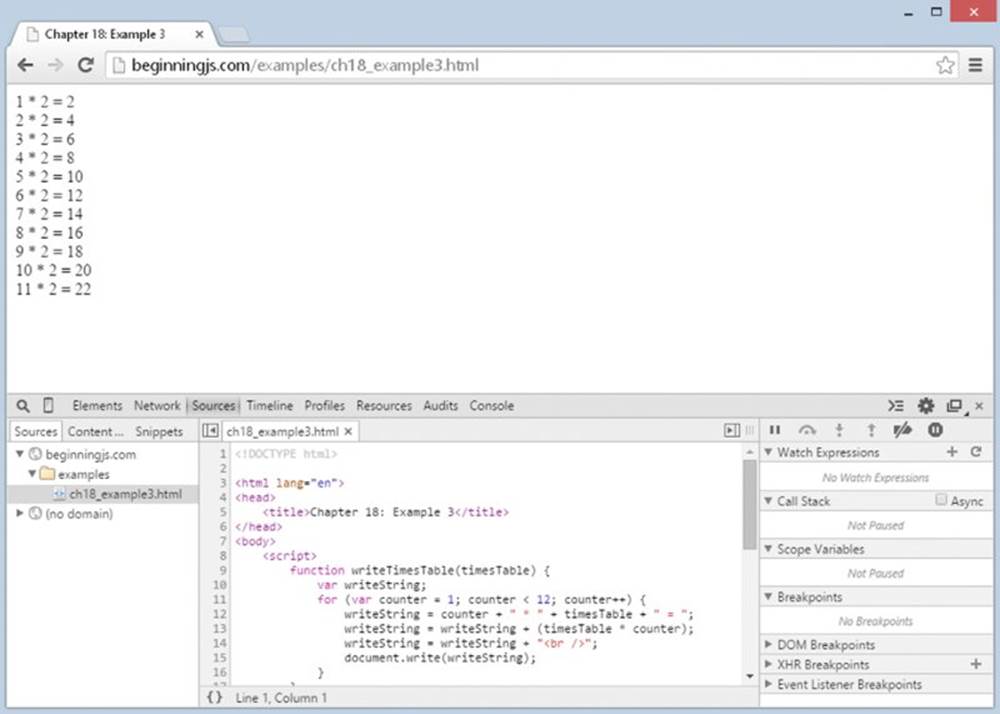
Figure 18.4
The center panel contains the source code of the selected file, and it’s here that you’ll set breakpoints and step through code. The code displayed in this panel is read-only; if you want to change it, you have to edit the file in your text editor and reload the page.
The right panel contains several different subpanels. In this chapter, we focus on Breakpoints, Scope Variables, Watch Expressions, and Call Stack:
· Breakpoints: Lists all breakpoints that you’ve created for the code in the current page
· Scope Variables: Lists the variables and their values in scope of the breakpoint
· Watch Expressions: Lists the “watches” that you specify. These are typically variables and/or expressions that you want to inspect at a breakpoint.
· Call Stack: Displays the call stack
Setting Breakpoints
As mentioned earlier, breakpoints tell the debugger to pause code execution at a specific point in your code. This is useful when you want to inspect your code while it executes.
Creating breakpoints is straightforward. Simply left-click the line number, and Chrome highlights the line number with a blue tag icon. This highlight denotes a breakpoint in Chrome.
You can also hard-code a breakpoint by using the debugger keyword directly in your code (we’ll use this a bit later).
Set a breakpoint on line 13:
writeString = writeString + (timesTable * counter);
Reload the page, and notice Chrome paused code execution at the newly created breakpoint. Chrome highlights the current line of code in blue. This line hasn’t been executed yet.
Look at the Breakpoints in the right panel; it shows you the list of breakpoints (only one in this case). Each entry in the list consists of a checkbox to enable/disable the breakpoint, the filename and line number of the source file, and the source text of the breakpoint.
Now look at the Scope Variables.
Scope Variables and Watches
The Scope Variables pane displays variables and their values currently in scope at the current line. Figure 18.5 shows the contents of the Scope Variables pane at this breakpoint.
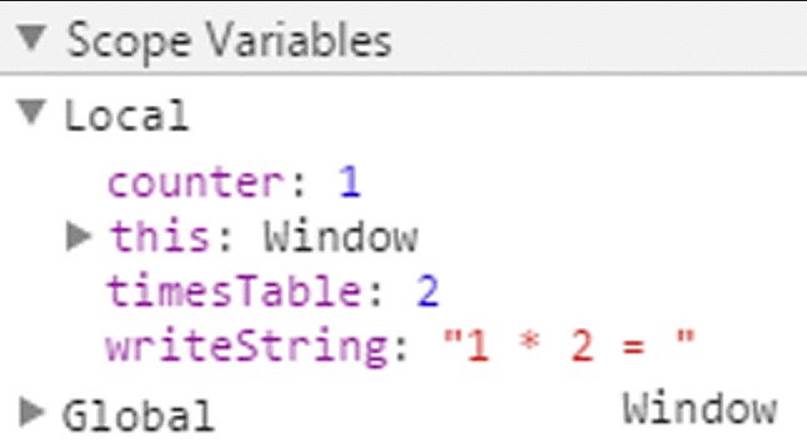
Figure 18.5
Notice that the counter, timesTable, and writeString variables are visible (as is this).
Now look at the Watch Expressions pane. There are currently no watch expressions, but you can add them by simply clicking the add icon (the plus sign). Type the variable name or expression you want to watch, and press the Enter key.
Go ahead and create a watch expression for counter == 1. You’ll see your expression followed by a colon and the value of the expression. At this point in time, you should see the following as shown in Figure 18.6:
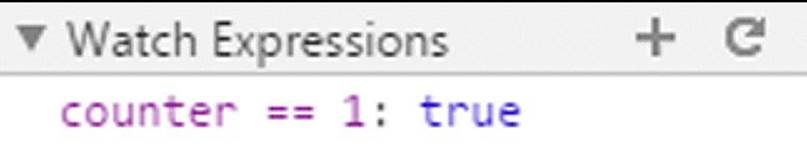
Figure 18.6
counter == 1: true
If the watch is in scope, the expression’s value is displayed. If the variable is out of scope, you’ll see “not available.”
Although this information is helpful when you want to see what exactly is going on in your code, it’s not very helpful if you can’t control code execution. It’s impractical to set a breakpoint and reload the page multiple times just to advance to the next line, so we use a process called stepping.
Stepping through Code
Code stepping is controlled by four buttons in the upper-right of the developer tools (Figure 18.7).
· Continue (shortcut key is F8): Its function is to continue code execution until either the next breakpoint or the end of all code is reached.
· Step Over (F10): This executes the current line of code and moves to the next statement. However, if the statement is a function, it executes the function and steps to the next line after the function call.
· Step Into (shortcut key is F11): Executes the current line of code and moves to the next statement. If the current line is a function, it steps to the first line of the function.
· Step Out (Shift-F11): Returns to the calling function.
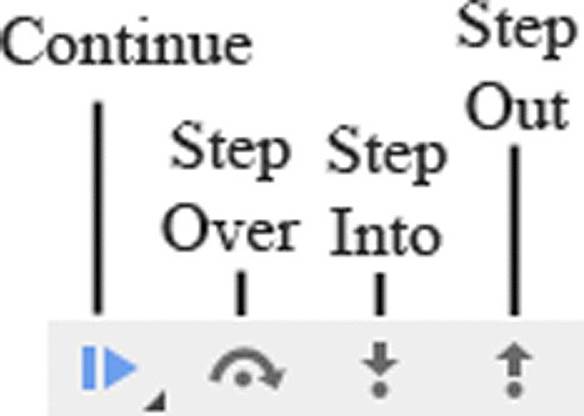
Figure 18.7
Let’s do some stepping; follow these steps:
1. Step Into the code by clicking the icon or pressing F11. The debugger executes the currently highlighted line of code and moves to the next line.
2. Look at the value of writeString in the Scope Variables pane; it is "1 * 2 = 2". As you can see, the values displayed in the Watch tab are updated in real time.
3. One nice feature of Chrome’s developer tools is the page updates, if necessary, as you step through code. Click Step Into two more times to see this in action. Figure 18.8 shows the page updated while stepping through code.
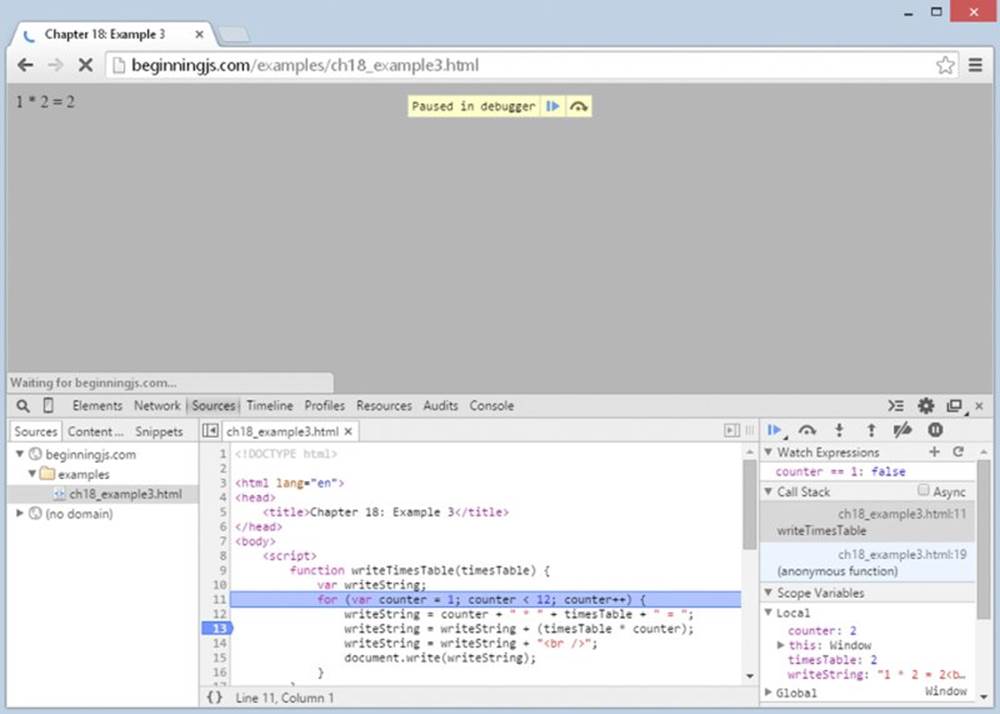
Figure 18.8
You may find that the function you stepped into is not the source of the bug, in which case you want to execute the remaining lines of code in the function so that you can continue stepping after the function. Do so by clicking the Step Out icon to step out of the code. However, if you’re in a loop and the breakpoint is set inside the loop, you will not step out of the function until you iterate through the loop.
There may also be times when you have some buggy code that calls a number of functions. If you know that some of the functions are bug-free, you may want to just execute those functions instead of stepping into them. Use Step Over in these situations to execute the code within a function but without going through it line by line.
Alter your times-table code in ch18_example3.html as follows so you can use it for the three kinds of stepping:
<!DOCTYPE html>
<html lang="en">
<head>
<title>Chapter 18: Example 4</title>
</head>
<body>
<script>
function writeTimesTable(timesTable) {
var writeString;
for (var counter = 1; counter < 12; counter++) {
writeString = counter + " * " + timesTable + " = ";
writeString = writeString + (timesTable * counter);
writeString = writeString + "<br />";
document.write(writeString);
}
}
for (var timesTable = 1; timesTable <= 12; timesTable++) {
document.write("<p>");
writeTimesTable(timesTable);
document.write("</p>");
}
</script>
</body>
</html>
Save this as ch18_example4.html and open it in your browser. The following instructions walk you through the process of stepping through code:
1. Set a breakpoint in line 19, the for loop in the body of the page, and reload the page.
2. Click the Step Into icon and code execution moves to the next statement. Now the first statement inside the for loop, document.write("<p>"), is up for execution.
3. When you click the Step Into icon again, it takes you to the next line (the first calling of the writeTimesTable() function).
4. You want to see what’s happening inside that function, so click Step Into again to step into the function. Your screen should look similar to Figure 18.9.
5. Click the Step Into icon a few times to get the gist of the flow of execution of the function. In fact, stepping through code line by line can get a little tedious. So let’s imagine you’re happy with this function and want to run the rest of it.
6. Use Step Out to run the rest of the function’s code. You’re back to the original for loop, and the debugger is paused on line 22, as you can see from Figure 18.10.
7. Click the Step Into icon to execute document.write() (it won’t be visible because it’s a closing tag).
8. Click Step Into four more times. Execution continues through the condition and increments parts of the for loop, ending back at the line that calls writeTimesTable().
9. You’ve already seen this code in action, so you want to step over this function. Well, no prizes for guessing that Step Over is what you need to do. Click the Step Over icon (or press the F10 key) and the function executes, but without stepping through it statement by statement. You should find yourself back at the document.write("</p>") line.
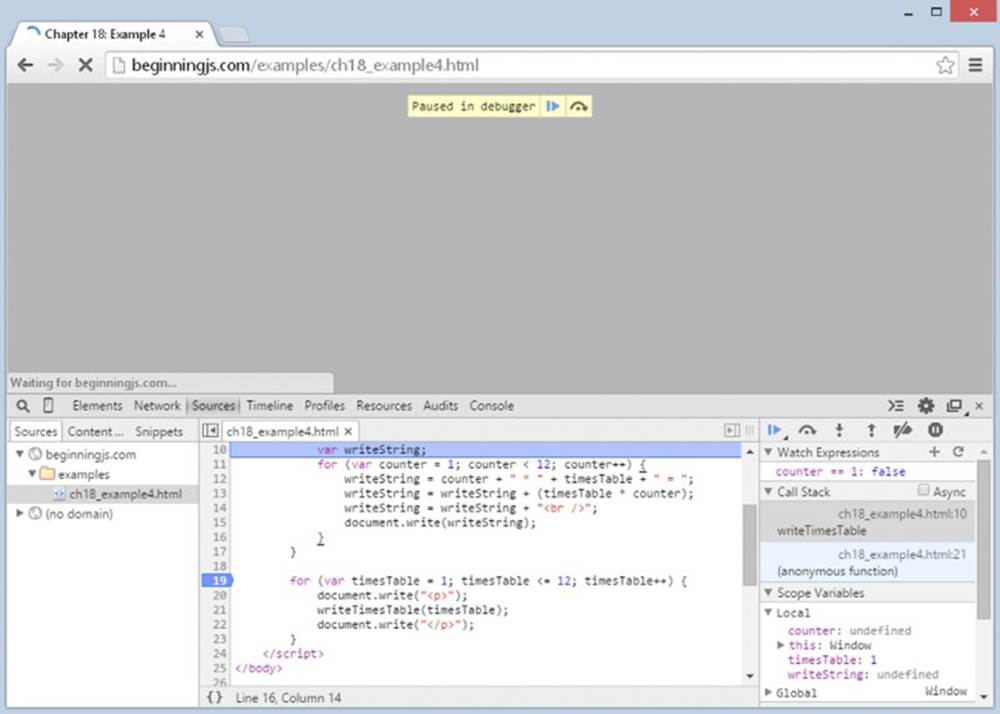
Figure 18.9
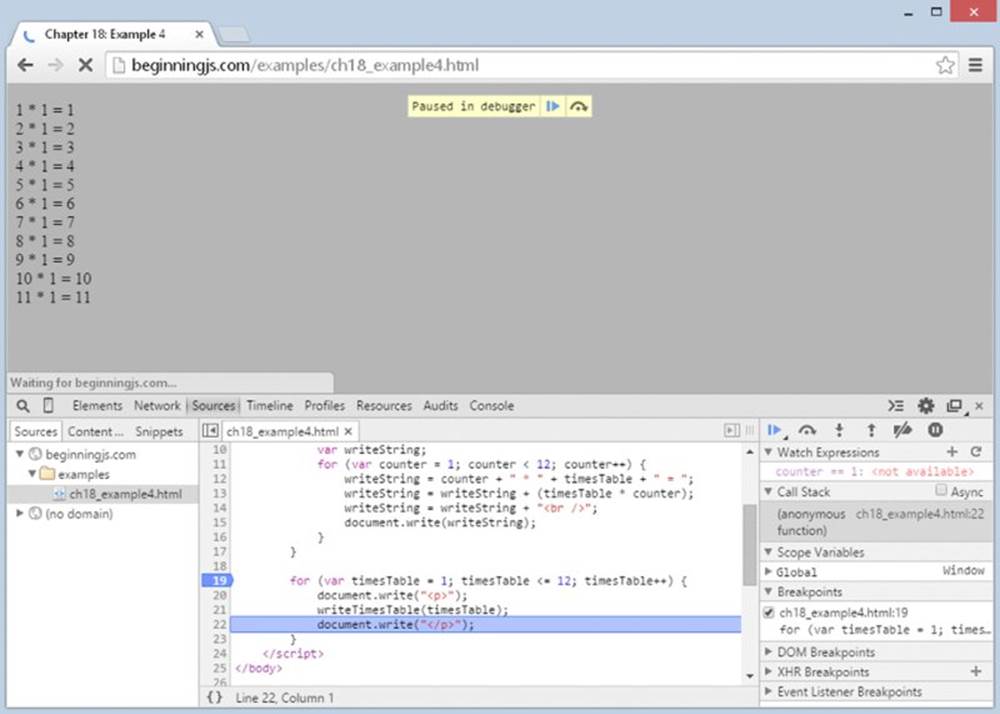
Figure 18.10
If you’ve finished debugging, you can run the rest of the code without stepping through each line by clicking the Continue icon (or pressing F8) on the toolbar. You should see a page of times tables from 1*1=1 to 11*12=132 in the browser.
The Console
While you’re stepping through code and checking its flow of execution, it would be really useful to evaluate conditions and even to change things on the fly. You can do these things using the console.
Follow these steps:
1. Remove the previously set breakpoint by clicking it and set a new breakpoint at line 15:
document.write(writeString);
2. Let’s see how you can find out the value currently contained in the variable writeString. Reload the page. When the debugger stops at the breakpoint, click the Console tab and type the name of the variable you want to examine, in this case writeString. Press the Enter key. This causes the value contained in the variable to be printed below your command in the command window, as shown in Figure 18.11.
3. If you want to change a variable, you can write a line of JavaScript into the command window and press Enter. Try it with the following code:
writeString = "Changed on the Fly<br />";
4. Click the Sources tab, remove the breakpoint, and then click the Continue icon. You see the results of your actions: Where the 1*1 times table result should be, the text you changed on the fly has been inserted.
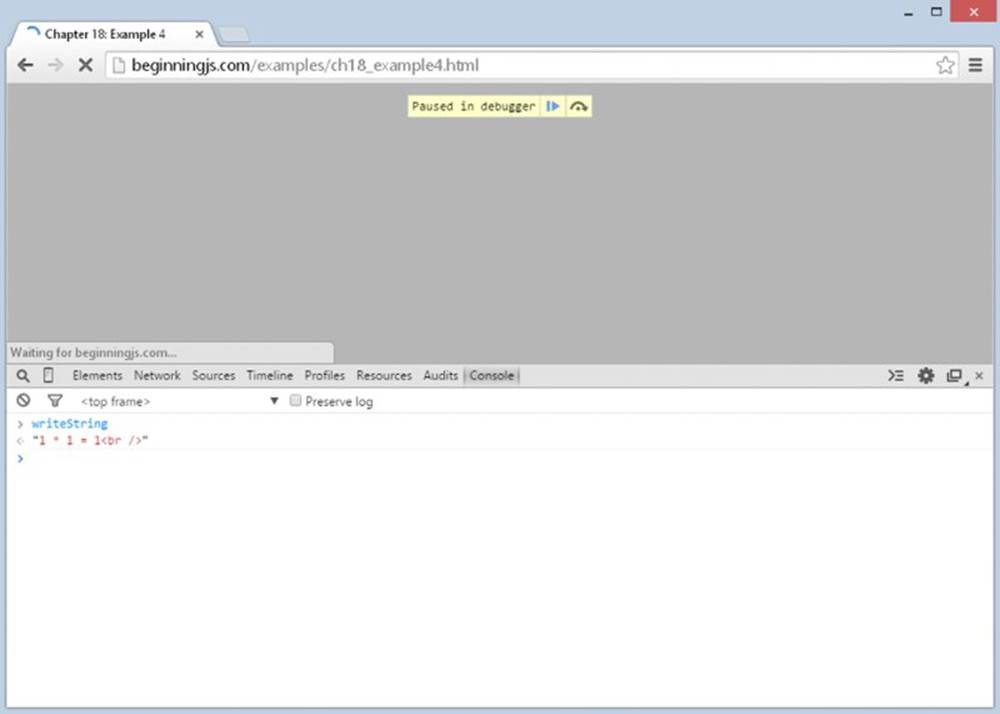
Figure 18.11
NOTE This alteration does not change your actual HTML source file.
The console can also evaluate conditions. Set a breakpoint on line 20 and reload the page. Leave execution stopped at the breakpoint, and Step Into the for loop’s condition.
Go to the Console, type the following, and press Enter:
timesTable <= 12
Because this is the first time the loop has been run, as shown in Figure 18.12, timesTable is equal to 1 so the condition timesTable <= 12 evaluates to true.
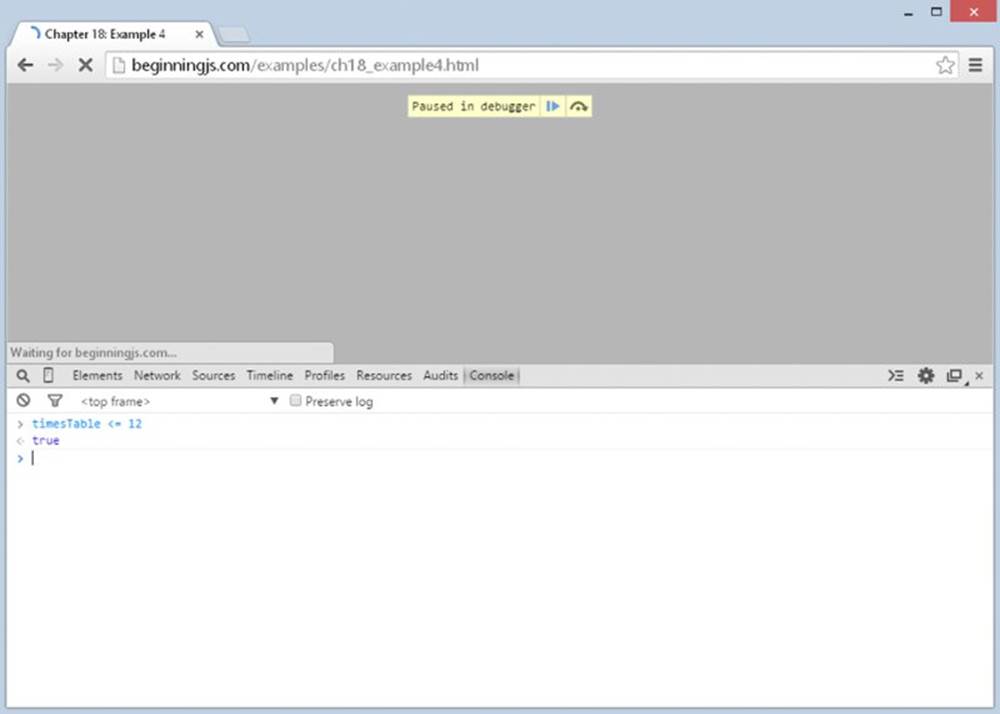
Figure 18.12
You can also use the console to access properties of the BOM and DOM. For example, if you type location.href into the console and press Enter, it will tell you the web page’s URL.
NOTE You can evaluate any JavaScript in the console, and it executes within the scope of the page and/or breakpoint. This makes the console an extremely powerful tool.
Call Stack Window
When you are single-stepping through the code, the call stack window keeps a running list of which functions have been called to get to the current point of execution in the code.
Let’s create an example web page to demonstrate the call stack. Open your text editor and type the following:
<!DOCTYPE html>
<html lang="en">
<head>
<title>Chapter 18: Example 5</title>
</head>
<body>
<input type="button" value="Button" name="button1" id="button1" />
<script>
function firstCall() {
secondCall();
}
function secondCall() {
thirdCall();
}
function thirdCall() {
//
}
function buttonClick() {
debugger;
firstCall();
}
document.getElementById("button1")
.addEventListener("click", buttonClick);
</script>
</body>
</html>
Save this file as ch18_example5.html and open it in Chrome. You’ll see a page with a simple button. With the development tools open, click the button and examine the Call Stack pane. You should see something like Figure 18.13.
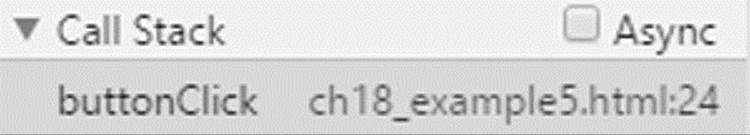
Figure 18.13
Chrome adds the function to the top of the call stack for every function call. It displays the name of the function, the file the function resides in, and the line number of the currently executing statement within the function. You can already see that the first function called was buttonClick(), it is inside ch18_example5.html, and the execution is at line 24.
Now Step Into twice, and you’ll be taken inside the firstCall() function. Once again, examine the Call Stack pane, and you’ll see something similar to Figure 18.14.
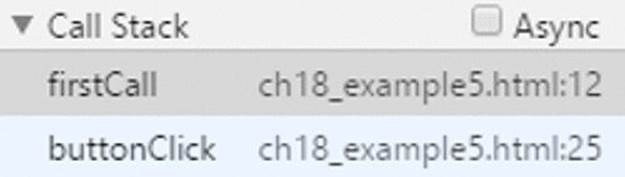
Figure 18.14
You can click each entry in the Call Stack pane to examine where the JavaScript engine is currently executing in each of the functions. If you click the buttonClick entry, the developer tools highlight line 25, the line inside of buttonClick() that is currently executing.
Now step into secondCall(), and another entry is added to the call stack. One more step takes you into thirdCall(), again with its name being added to the top of the call stack.
Step Into again, and as you leave the thirdCall() you will see that its corresponding entry is removed from the top of the call stack. Yet another step takes you out of secondCall(). Each additional step takes you out of a function and removes its name from the call stack, until eventually all the code has been executed.
This demo page was very simple to follow, but with complex pages, the call stack can prove very useful for tracking where you are, where you have been, and how you got there.
As mentioned earlier, most other developer tools for other browsers are similar to Chrome’s developer tools in functionality, but as you’ll soon see with IE11, the tools can look a bit different.
Debugging in Internet Explorer
Before version 8, developers had to download and install the Microsoft Script Debugger for any type of script debugging. Thankfully, Microsoft built a debugger into IE8, and every subsequent version includes a suite of tools to ease our lives.
You can access the debugger in a couple of ways, the easiest being to press the F12 key. However, you can also bring up the development tools by clicking the “gear” menu and choosing the F12 Developer Tools option.
By default, the F12 Developer Tools opens as a panel within the browser window (Figure 18.15), but as with Chrome’s tools, you can pop it out with the icon next to the Close button.
Figure 18.15
As you can tell from Figure 18.15, IE’s tools are laid out much differently than Chrome’s. On the left-hand side, you see a list of icons. The two we are concerned with are the second and third icons: the console (Figure 18.16) and debugger (Figure 18.17), respectively.
Figure 18.16
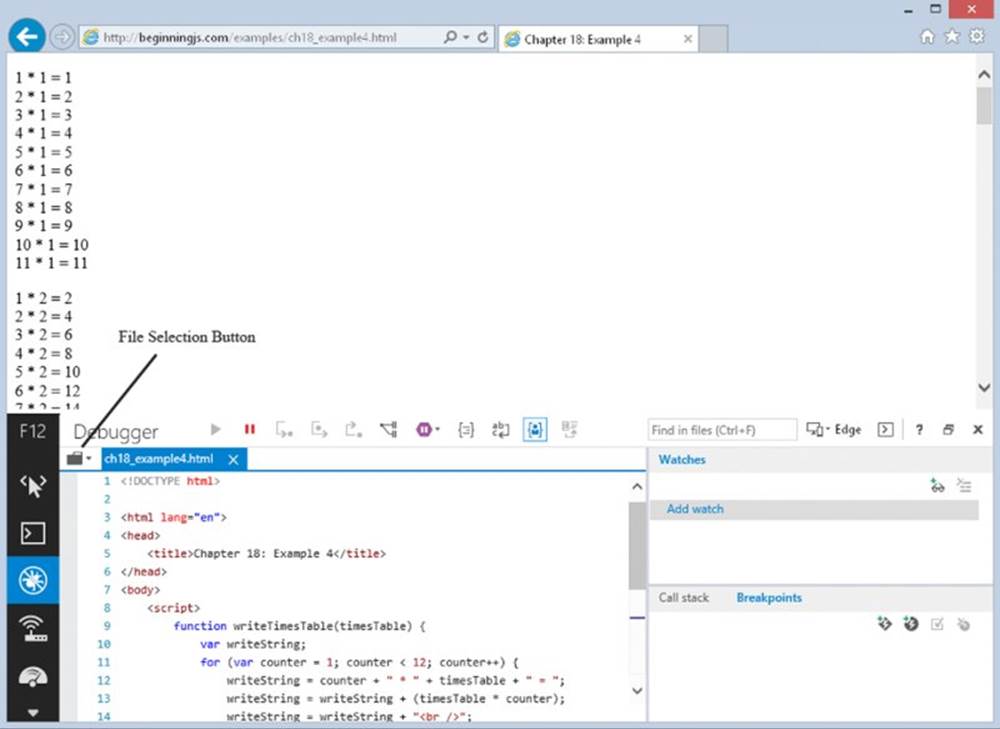
Figure 18.17
As you can see in Figure 18.17, the debugger is made up of two panels. The left displays the source code of the file, and it uses a tabbed interface to display the source of multiple files. If multiple files contain JavaScript, you can open them in a new tab using the file selection button.
The right panel contains two subpanel tabs:
· Watches: Lists the variables/expressions and their values you specify to watch at the breakpoint. This also displays the variables in scope.
· Breakpoints/Call Stack: Lists all breakpoints that you’ve created for the code in the current page. You can click “Call Stack” to display the call stack.
Now load ch18_example4.html, and you’ll see the times table in your web page.
Setting Breakpoints
Creating a breakpoint in the F12 Developer Tools is as simple and straightforward as it is in Chrome, except that instead of clicking the line number, you want to click the gray area to the left of the line number (the gutter).
Set a breakpoint on line 12. Breakpoints are denoted by a red circle in the gutter, and notice that an entry was added in the list of breakpoints in the breakpoints subpanel (Figure 18.18). Each entry consists of a checkbox to enable/disable the breakpoint, the filename of the source file, and the line number the breakpoint is on (it also displays the column of that line).
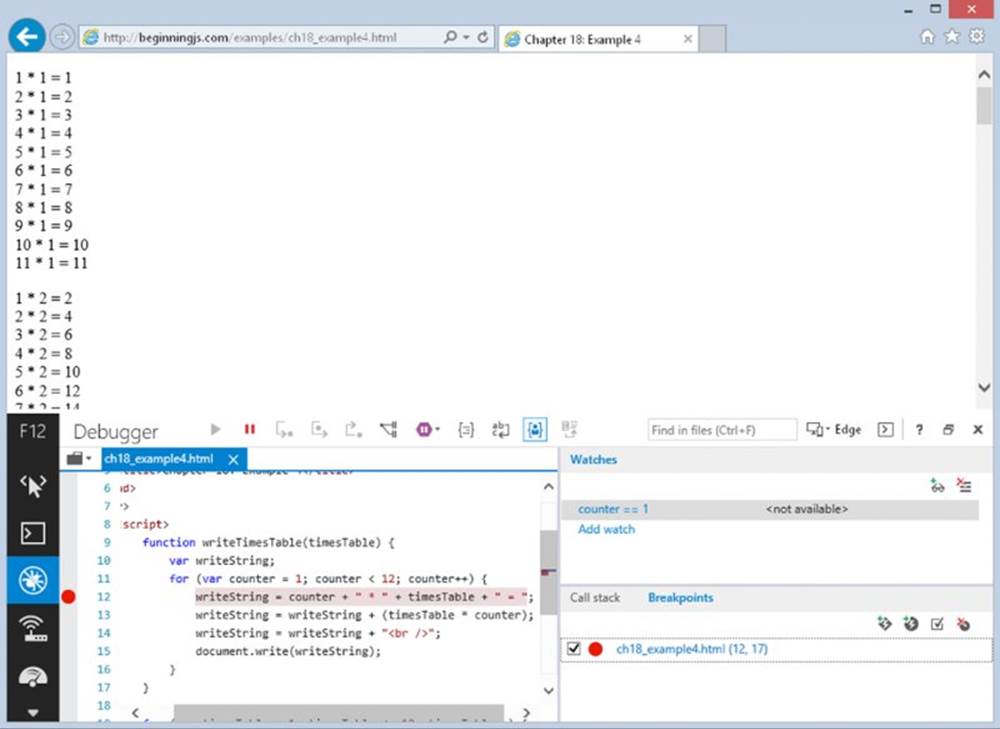
Figure 18.18
Adding Watches
The Watches panel lists the variables and expressions you want to watch, as well as the variables in scope. Adding a watch is very similar to Chrome; simply click the new watch icon and type the variable or expression you want to watch. Figure 18.19 shows a watch for the expression counter == 1 when the debugger is paused on line 12.
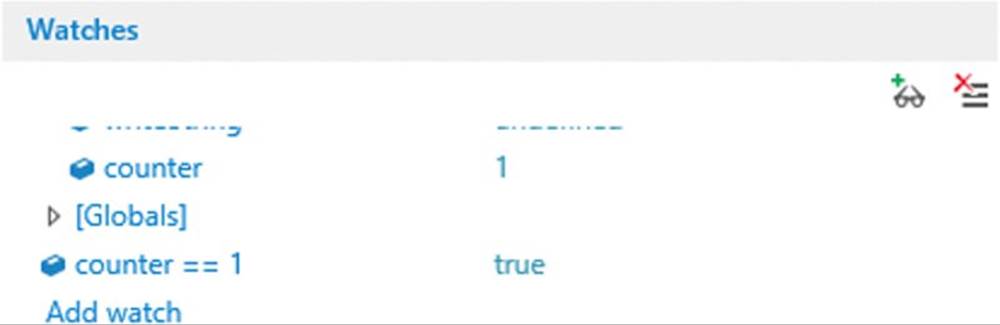
Figure 18.19
Stepping through Code
At the top of the debugger window is a set of buttons that control code execution (see Figure 18.20).

Figure 18.20
The Continue option (shortcut key F5 or F8) continues code execution until either the next breakpoint or the end of all code. The second option, Break, lets you pause execution. This is useful if you find yourself in an infinite loop. Next are the Step Into (F11), Step Over (F10), and Step Out (Shift+11) buttons.
The F12 Developer Tools debugger denotes the current line by highlighting the line in yellow and adds a yellow arrow in the gutter. But unlike Chrome, stepping through code does not update the web page. The JavaScript executes, but you will not see the results until all code is executed.
The Console
The console logs JavaScript errors and enables you to execute code within the context of the line at which the debugger is stopped. Figure 18.21 shows the “Changed on the Fly” example.
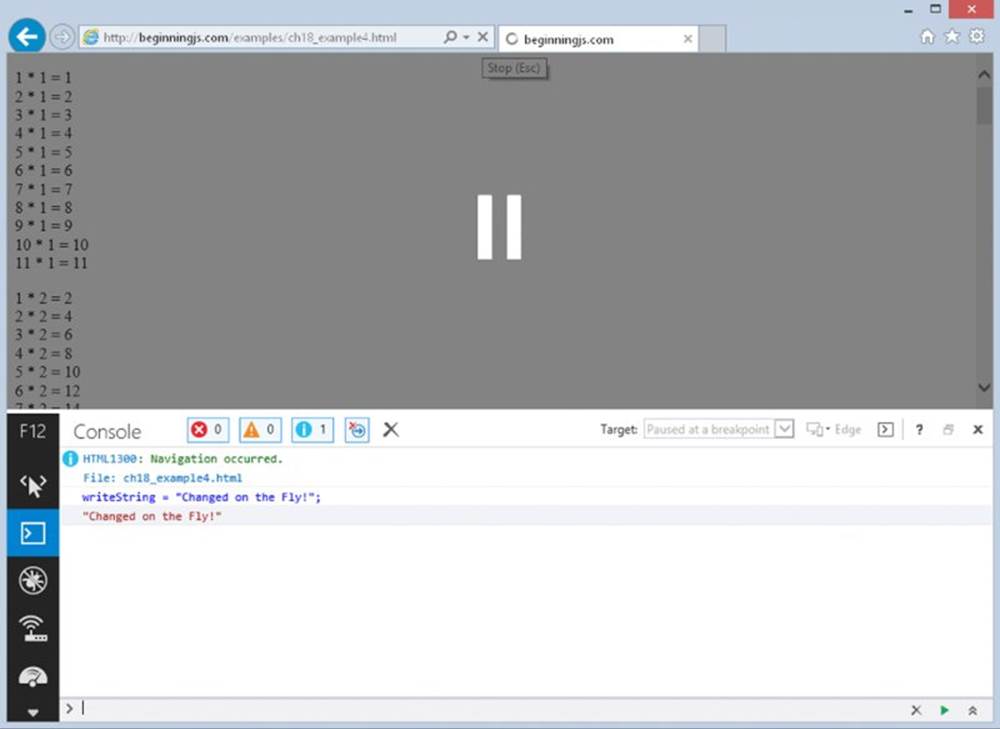
Figure 18.21
Debugging in Firefox with Firebug
Firefox’s story is an interesting one because its toolset is relatively new to the browser. For many years, Firefox did not have native developer tools. Instead, developers relied upon a Firefox extension called Firebug, which was the first suite of browser-based developer tools. The tools we use in every browser today are directly inspired by Firebug.
Even though Firefox has its own set of built-in tools, they still lack a lot of features found in Firebug (and other browsers’ tools). So for this section, you need to download and install the Firebug extension.
To install Firebug, open Firefox and go to http://www.getfirebug.com. Click the Install button on the web page and follow the instructions. In most cases, you will not need to restart Firefox.
You can access Firebug by clicking the Firebug icon in the toolbar (Figure 18.22). You can also access a dropdown menu by clicking the down arrow next to the Firebug icon to reveal additional settings. Many panels are disabled by default, so clicking on the Enable All Panels option is very useful.
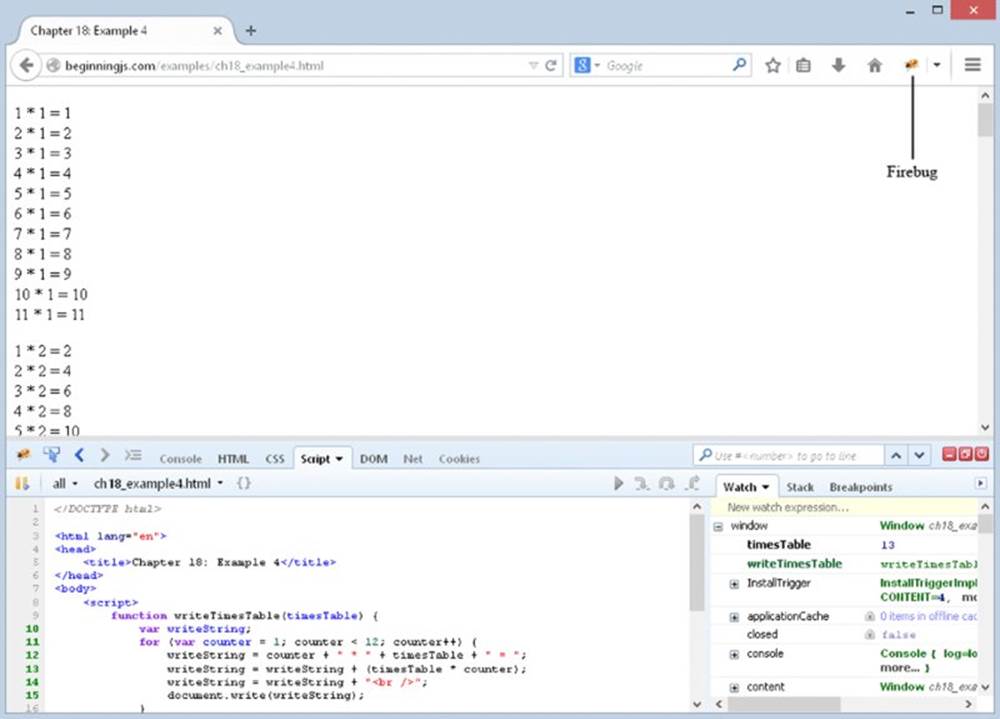
Figure 18.22
The JavaScript debugger is contained in the Script tab, and it is made up of two panels. The left panel contains the source code, and the right panel contains three different views to choose from: Watch, Stack, and Breakpoints.
Setting Breakpoints
Creating breakpoints in Firebug is easy; simply left-click the line number or the gutter. Breakpoints are denoted by a red circle in the gutter.
The Breakpoints tab in the right pane displays the list of breakpoints you have created, and it shows all the information you expect: the filename, the code at that breakpoint, and the line number. Figure 18.23 shows a breakpoint on line 12.
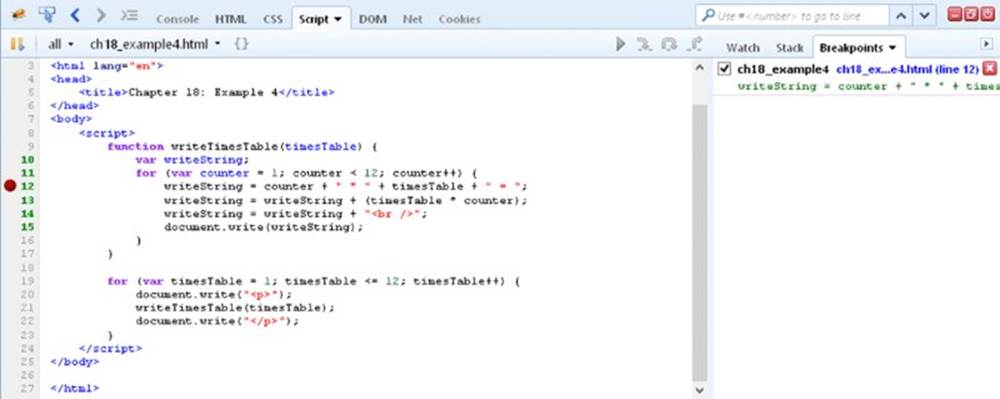
Figure 18.23
Now click the Watch tab.
Watches
The Watch tab displays variables and their values currently in scope at the current line, and you can add your own watch by clicking “New watch expression…,” typing the variable or expression you want to watch, and pressing the Enter key. Watches that you add have a gray background, and moving your mouse over them reveals a red Delete button (Figure 18.24).
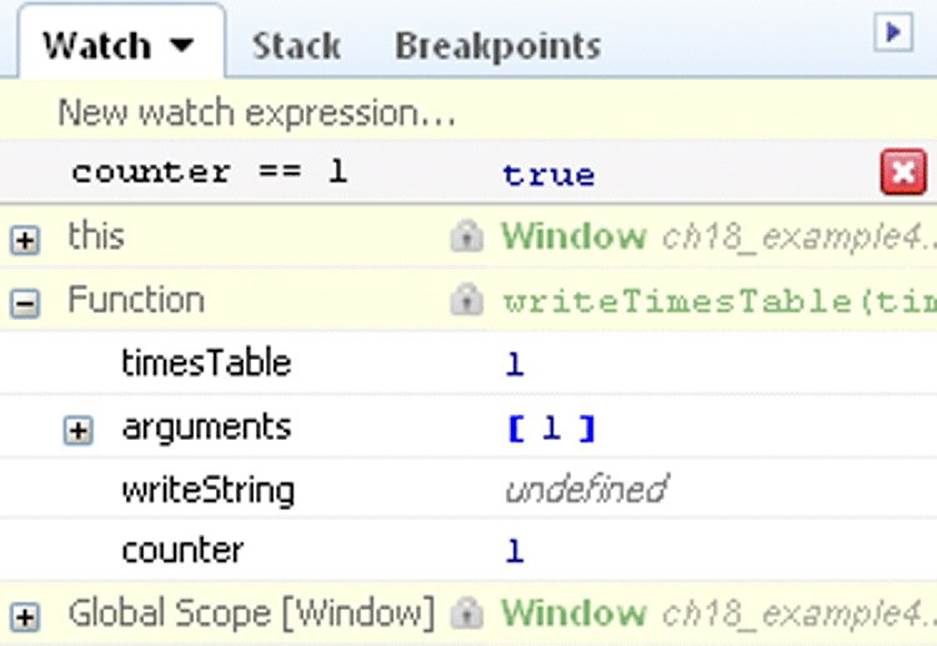
Figure 18.24
Stepping through Code
At the top of the debugger window are the icons for stepping through code (see Figure 18.25).
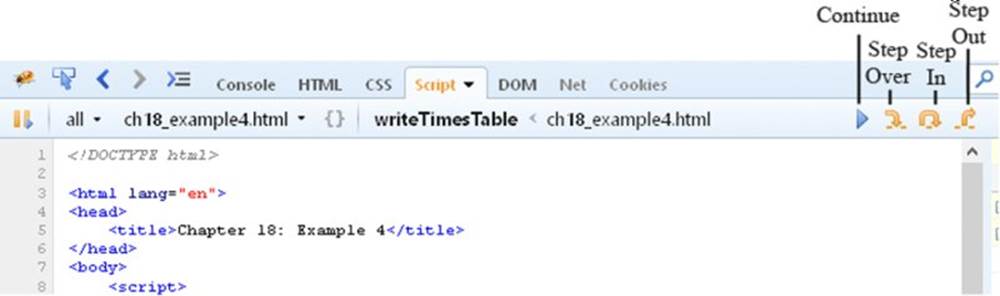
Figure 18.25
The Continue button (F8) is first, followed by Step Into (F11). Next are the Step Over (F10) and Step Out (Shift+11) buttons.
As you step through code, you can tell the current statement by its yellow highlight. Firebug also uses a yellow arrow in the gutter to indicate the current line. Like Chrome, stepping through code updates the web page.
The Console
Firebug provides a console window with the Console tab (Figure 18.26), and it works like the console found in Chrome and IE. You can inspect any variable or expression within the context of the scope or page, and you can use it to execute JavaScript.
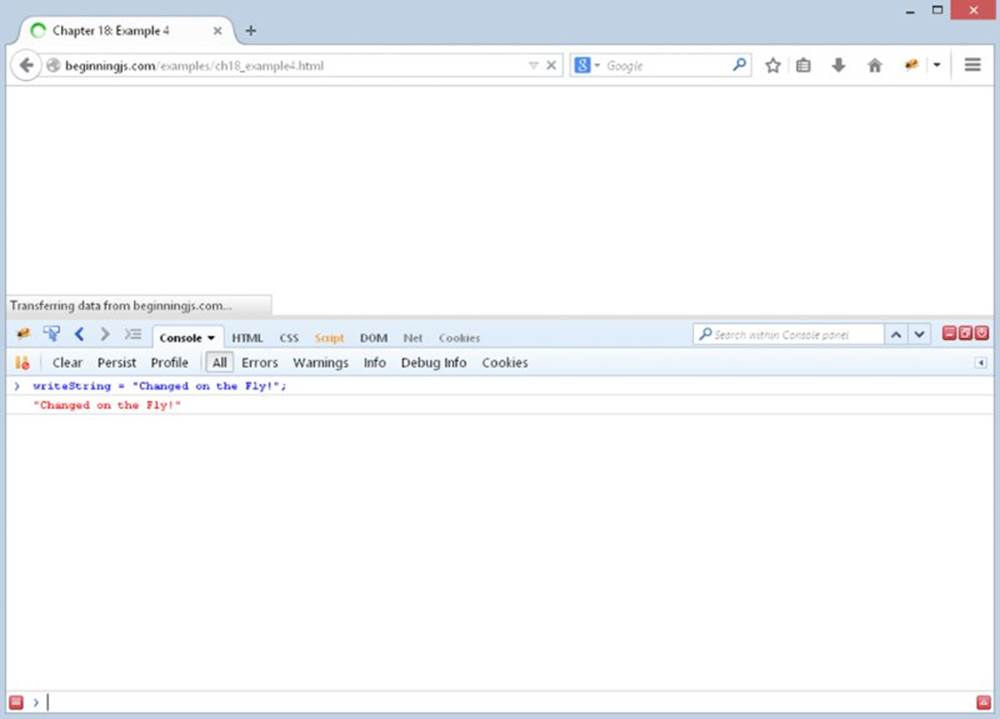
Figure 18.26
Debugging in Safari
Safari’s story is similar to IE’s. Safari’s rendering engine is called Webkit, and the folks that write and maintain Webkit built a separate tool, codenamed Drosera, that contained the tools similar to the other browsers. It was a separate download, and it required you to attach it to a specific Safari/Webkit window. Today, Safari includes a tool called Web Inspector, and it provides the functionality you would expect from a browser-based suite of tools.
Safari’s Web Inspector is disabled by default. To enable it, follow these steps:
1. Click the Settings menu button and choose the Preferences option (see Figure 18.27).
2. In the Preferences window, click the Advanced tab and select the Show Develop Menu in Menu Bar option (see Figure 18.28). Close the Preferences window.
3. Click the Settings menu button and select the Show Menu Bar option. This displays the traditional menus at the top of the window.
4. To open the debugger, select Develop ➢ Start Debugging JavaScript from the menu bar.
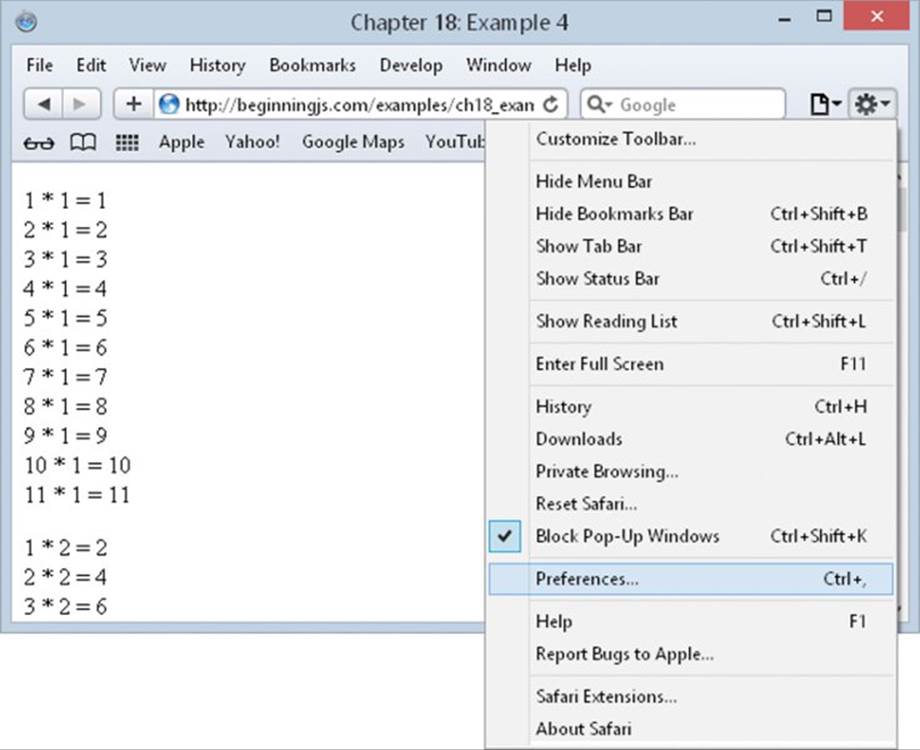
Figure 18.27
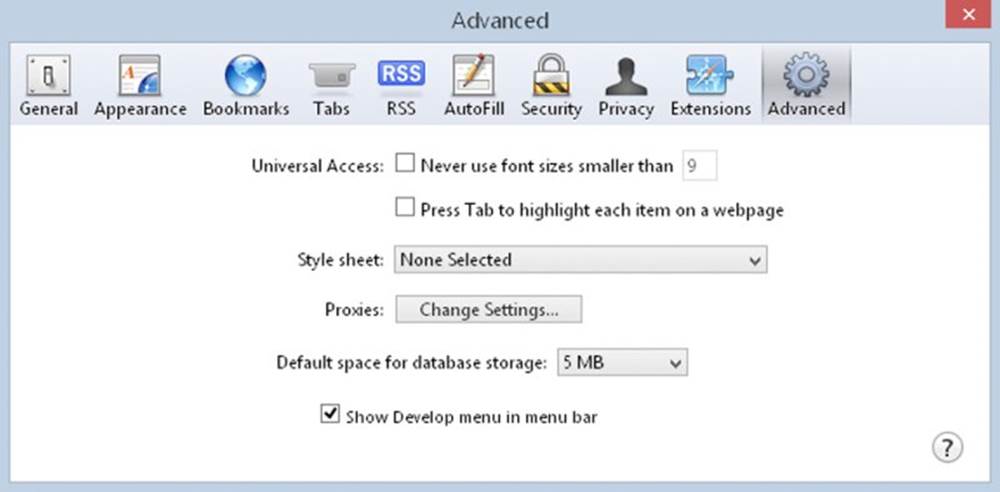
Figure 18.28
Let’s look at the window and identify the separate parts. Figure 18.29 shows the JavaScript debugger when it was first opened on the ch18_example4.html file.
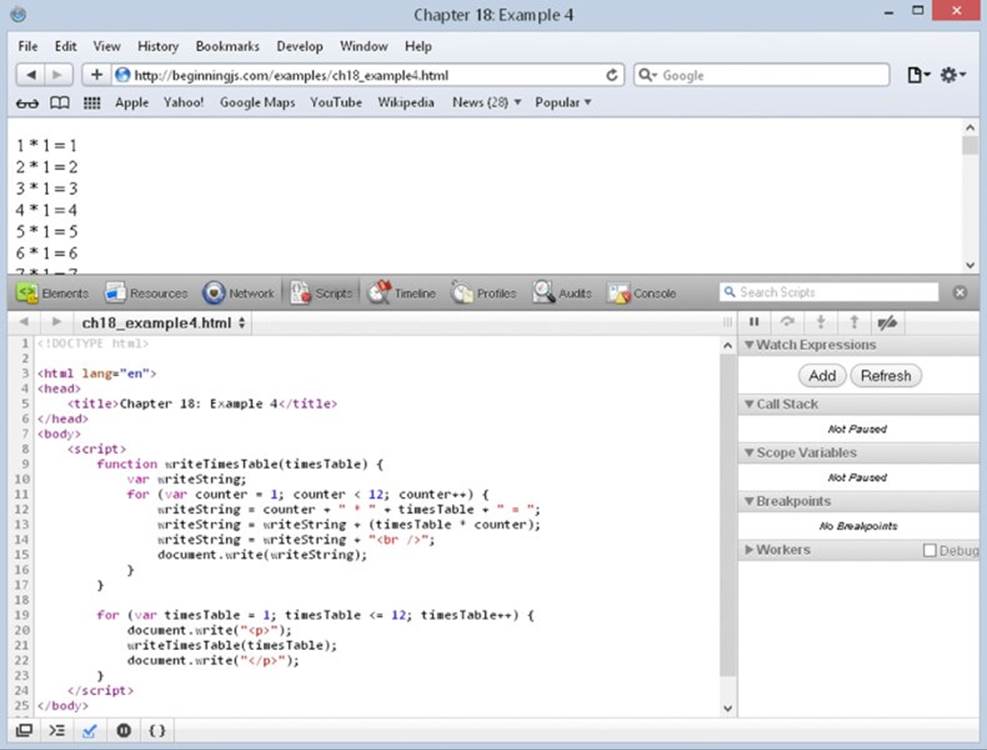
Figure 18.29
Safari’s Web Inspector looks a lot like Chrome’s, doesn’t it? That’s because Chrome is built using a heavily modified version of WebKit. The Scripts tab is much like Chrome’s Sources tab; you can see the code, watch expressions, call stack, scope variables, and breakpoints all at one time.
Setting Breakpoints
Creating a breakpoint follows the same procedure in Web Inspector as Chrome: Click the line number at which you want the debugger to break. Breakpoints in Web Inspector are denoted by the same blue tag used in Chrome. Create one on line 12. The breakpoints’ subsection lists the breakpoints you create, and it displays the same information you expect it to.
Adding Watches
In earlier versions, Web Inspector did not allow you to add watches. But in Safari 5, you can create watches to inspect variables and expressions. Simply click the Add button to create your watch. Figure 18.30 shows the watch counter == 1 when the debugger is paused on line 12.
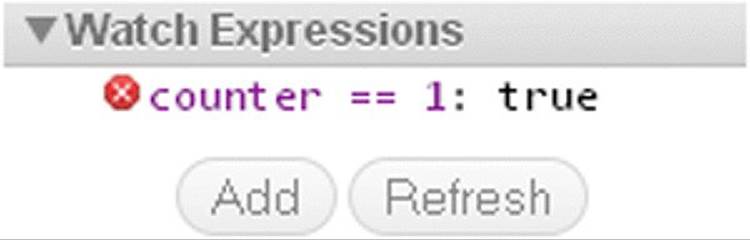
Figure 18.30
To remove a watch, click the red X next to it.
Stepping through Code
The code-stepping buttons are at the top of the right panel and underneath the search box (see Figure 18.31).
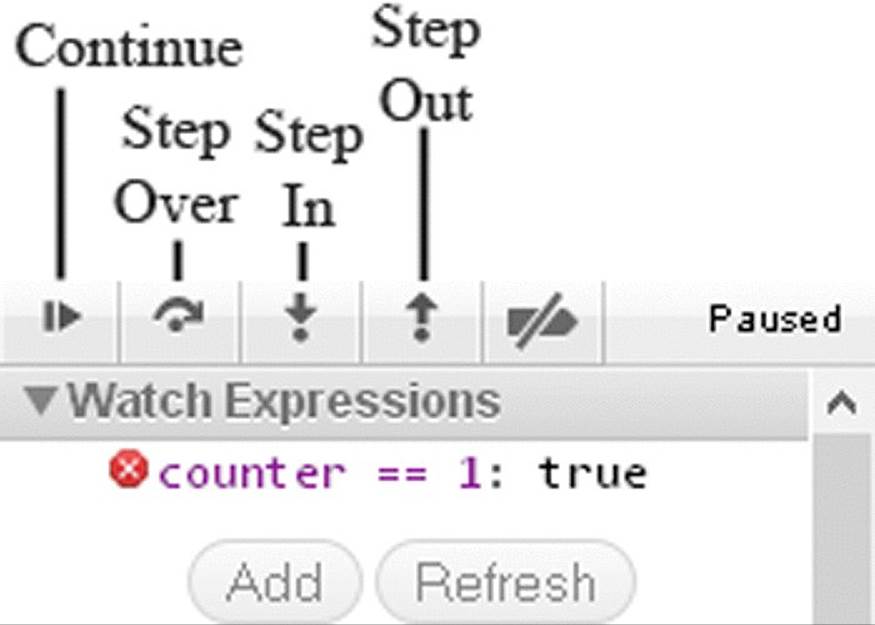
Figure 18.31
These buttons perform the same functions as the other browser tools. You have the Continue button, followed by Step Over, then Step In, and finally Step Out.
Like Chrome and Firebug, Web Inspector updates the page as you step through code. So you can see the results as each line executes.
The Console
The console serves the same purpose as it does in the previous tools. You can check the value of a variable by typing the variable and pressing the Enter key. You can also execute code in the context of the current line of code. Try the “Changed on the Fly” example to see it in action.
SUMMARY
In this chapter you looked at the less exciting part of coding, namely bugs. In an ideal world you’d get things right the first time, every time, but in reality any code more than a few lines long is likely to suffer from bugs.
· You first looked at some of the more common errors, those made not just by JavaScript beginners, but also by experts with lots of experience.
· Some errors are not necessarily bugs in your code, but in fact exceptions to the normal circumstances that cause your code to fail. You saw that the try...catch statements are good for dealing with this sort of error, and that you can use the catch clause with thethrow statement to deal with likely errors, such as those caused by user input. Finally, you saw that if you want a block of code to execute regardless of any error, you can use the finally clause.
· You looked at the debugging tools found in Chrome (and by extension Opera), Internet Explorer, Firebug for Firefox, and Safari. With these tools you can analyze code as it executes, which enables you to see its flow step by step, and to check variables and conditions. And although these debuggers have different interfaces, their principles are identical.
EXERCISES
You can find suggested solutions to these questions in Appendix A.
1. The example ch18_example4.html has a deliberate bug. For each times table it creates only multipliers with values from 1 to 11.
Use the script debugger to work out why this is happening, and then correct the bug.
2. The following code contains a number of common errors. See if you can spot them:
<!DOCTYPE html>
<html lang="en">
<head>
<title>Chapter 18: Question 2</title>
</head>
<body>
<form name="form1" action="">
<input type="text" id="text1" name="text1" />
<br />
CheckBox 1<input type="checkbox" id="checkbox2" name="checkbox2" />
<br />
CheckBox 1<input type="checkbox" id="checkbox1" name="checkbox1" />
<br />
<input type="text" id="text2" name="text2" />
<p>
<input type="submit" value="Submit" id="submit1" name="submit1" />
</p>
</form>
<script>
function checkForm(e) {
var elementCount = 0;
var theForm = document.form1;
while(elementCount =<= theForm.length) {
if (theForm.elements[elementcount].type == "text") {
if (theForm.elements[elementCount].value() = "")
alert("Please complete all form elements");
theForm.elements[elementCount].focus;
e.preventDefault();
break;
}
}
}
document.form1.addEventListener("submit", checkForm);
</script>
</body>
</html>