Linux Web Server Development (2015)
Chapter 4 Cherokee Administration Panel
In this chapter, you will take a tour of the main sections of the Cherokee Administration Panel. Each section is accessed from the corresponding icon at the top of the panel’s web page. Notice that the number of sections and other features of the Administration Panel may vary according to the Cherokee version.
The Home Section of the Administration Panel
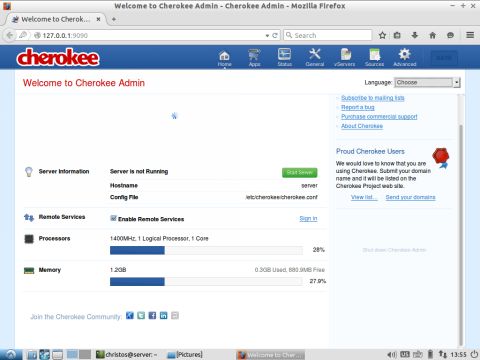
In the Home section, you can find some information about the status of the server, the system’s memory and the processor, the system’s hostname and the path of the Cherokee configuration file. In the Language drop-down menu, you can select the language used at the Administration Panel interface.
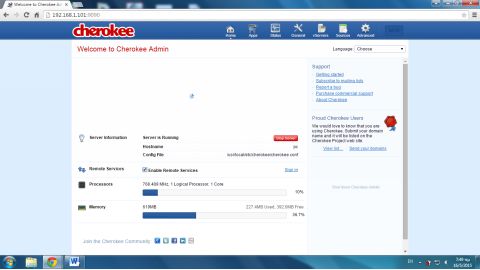
In the right area of the window are included some support links for the Cherokee server.
As was already mentioned, you must start the server with the green Start Server button and stop the server with the same button (which is red-colored and has the caption Stop Server when the server is running). The Start/Stop Server button is the most important feature of the Home section.
The Status Section of the Administration Panel
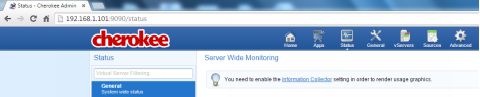
To go to the Status section, click the Status link. The Status section offers a monitoring tool. To activate this monitoring, click on the Information Collection link, which brings you to the General section.
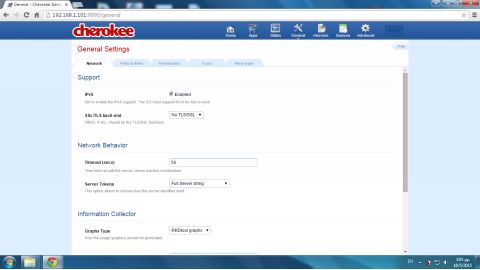
In the General section, select the RRDtool option in the Graphs Type drop-down menu if it is not already selected.
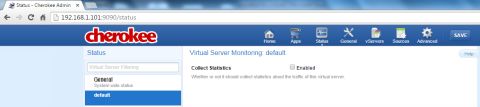
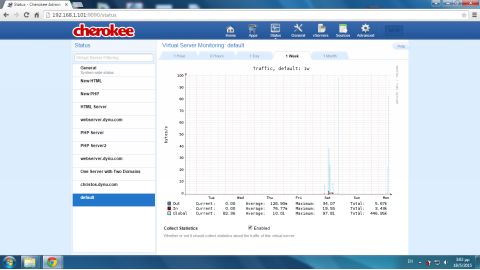
The last chapters of this book describe how you can run simultaneously a number of Web servers, called Virtual Servers. To enable the graphs for a specific virtual server individually (instead of viewing system-wide data for all servers), you must enable data collection for the specific server. So far, there is only one virtual server running – the default. To permit data collection for the default server, return to the Status section and click the server’s name (default) just below the General link. Click the Enabled check box.
Remember – each time a preference in the Administration Panel is configured, press the SAVE button next to the Cherokee section icons. After configuring some options (like the previous option – Graphs Type) the Cherokee program will ask you to restart the server.
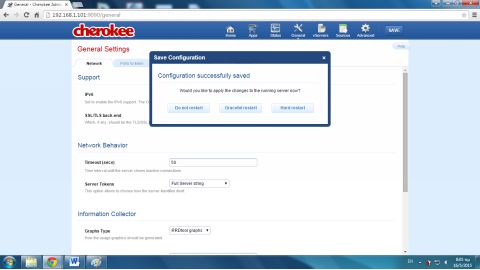
Click the Graceful restart button in the Save Configuration dialogue window that appears.
After configuring these options the Status page looks like this:
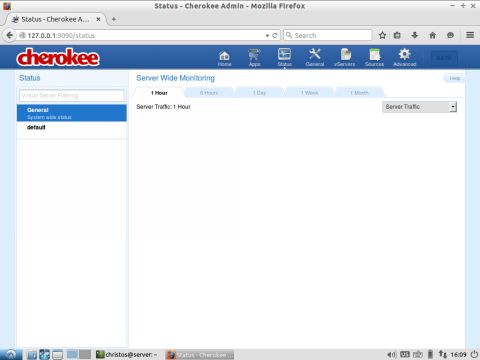
If no graphs are available at this point, it is because the RRDtool package is missing from the example system. RRDtool (Round-Robin Database Tool) is the data logging and graphing tool that handles time series data like network bandwidth, CPU load, etc. You can install RRDtool (if it is not already installed) with the following command at the Linux terminal:
$ sudo apt-get install rrdtool
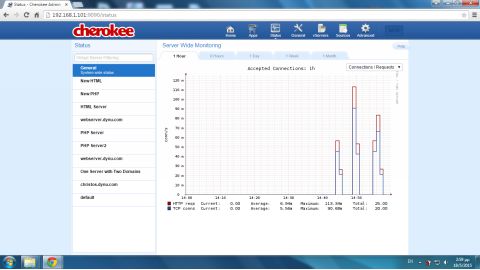
You must restart the server afterwards. After the RRDtool installation is complete, the graphs are available:
You can test the graph by visiting the Cherokee test page from another computer on your LAN or, as we describe in the next chapter, from external computers using an online network tool.
There are three types of graphs to view by selecting the corresponding option from the drop-down menu:
● Server Traffic
● Connections / Requests
● Connection Timeouts
You can also set the time period for the data collection by clicking on one of the following tabs at the top of the graph: 1 Hour, 6 Hours, 1 Day, 1 Week, and 1 Month.
On the left side of the graph, you can click General to display data for system-wide data or you can click the server’s name to display data for a specific virtual server.
To learn more about Cherokee graphs, visit the Cherokee Documentation page:
http://cherokee-project.com/doc/other_graphs.html
The General Section of the Administration Panel
The General section provides the tabs Network, Ports to listen, Permissions, Icons, and Mime types.
You have already visited the Network tab and set the value of the Graphs Type to RRDtool graphs. This page also provides network “behavior” configuration options. For example, you can configure the time interval a server will wait until it closes inactive connections. As another example, you can also enable protocol support for IPv6.
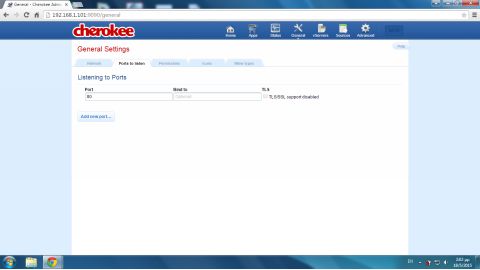
In the Ports to listen tab, you can add and delete the ports on which the server listens. The default port for the HTTP protocol, port 80, is already included. You may wish to add additional port numbers for the following reason. Some Internet Service Providers (ISPs) forbid incoming packets to port 80 or you can experiment with another Web server that uses port 80. If this is the case, you must use a different port number for your Web server. A common port number you can use is port 8080, sometimes referred as the HTTP alternate port. Chapter 12 describes the simultaneous use of two virtual servers that listen on different ports, ports 8080 and 8181.
Before you add a new port, make sure that the port is not already used by another service. At the Linux terminal run the following command:
$ netstat --tcp --listening --programs
The following image shows the command’s output before we start cherokee-admin and before we start the Cherokee server:

As you can see, there is a Web server already listening on the http port (port 80):
Active Internet connections (only servers)
Proto Recv-Q Send-Q Local Address Foreign Address State PID/Program name
tcp 0 0 server:domain *:* LISTEN 905/dnsmasq
tcp 0 0 localhost:ipp *:* LISTEN 601/cupsd
tcp6 0 0 [::]:http [::]:* LISTEN 28928/apache2
tcp6 0 0 ip6-localhost:ipp [::]:* LISTEN 601/cupsd
The service running on port 80 is the Apache Web server (apache2).
To disable the apache2 process from starting at system startup and, as a consequence, release port 80, which will allow Cherokee to run using the standard port:
$ sudo update-rc.d –f apache2 remove
Notice that in order to enable apache again, you should enter:
$ sudo update-rc.d apache2 defaults
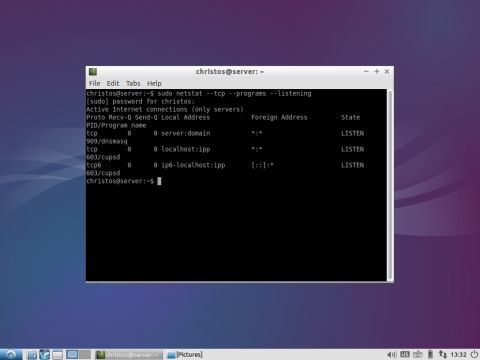
You must now restart the computer. The output of netstat shows that no process is now listening on port 80 (http):
christos@server:~$ sudo netstat --tcp --programs --listening
[sudo] password for christos:
Active Internet connections (only servers)
Proto Recv-Q Send-Q Local Address Foreign Address State PID/Program name
tcp 0 0 server:domain *:* LISTEN 909/dnsmasq
tcp 0 0 localhost:ipp *:* LISTEN 603/cupsd
tcp6 0 0 ip6-localhost:ipp [::]:* LISTEN 603/cupsd
To display the port numbers in their numeric form (e.g., 80 instead of http), use the --numeric-ports argument:
$ netstat --tcp --listening --programs --numeric-ports
Since there are no other processes that conflict with the standard HTTP port and ports 8080 and 8181 (that are used in the following chapters), Cherokee can be configured to listen to these ports.
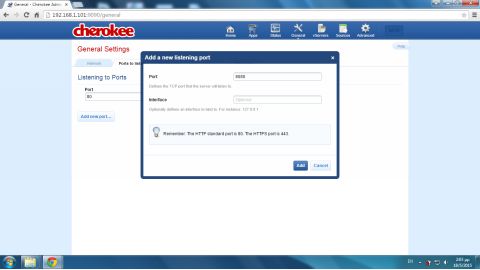
To add a new port on which Cherokee will listen, click the Add new port button.
In the dialogue window that appears, enter the port number (e.g., 8080) in the Port textbox and then click the Add button.
The new port number is included in the Listening to Ports list:
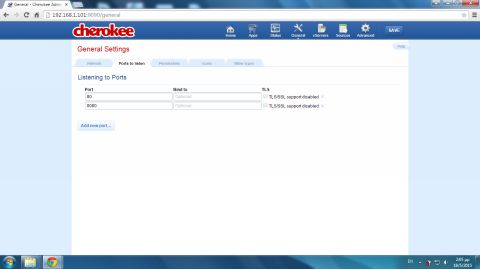
You can add more ports with the same method. For example, port 8181 is used in a few examples in this book. You can delete a port number by clicking at the ‘x’ button at the end of the line corresponding to the port. Click on the SAVE button in the upper-right area of the window to confirm the changes. On the dialogue window that appears click on the Graceful restart button to restart the server with the new configuration.
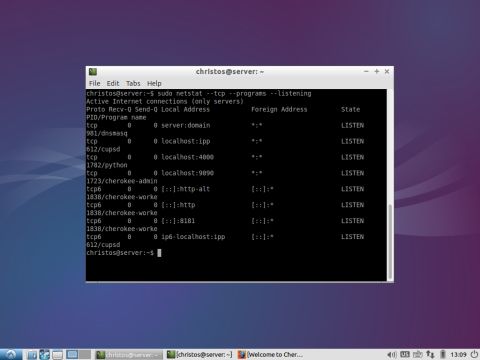
The following is the output of the netstat command after starting cherokee-admin and the Cherokee server, which listens to ports 80 (http), 8080 (http-alt) and 8181. Note that port 9090, the port on which cherokee-admin listens, is also included in the output.
christos@server:~$ sudo netstat --tcp --programs --listening
Active Internet connections (only servers)
Proto Recv-Q Send-Q Local Address Foreign Address State PID/Program name
tcp 0 0 server:domain *:* LISTEN 981/dnsmasq
tcp 0 0 localhost:ipp *:* LISTEN 612/cupsd
tcp 0 0 localhost:4000 *:* LISTEN 1782/python
tcp 0 0 localhost:9090 *:* LISTEN 1723/cherokee-admin
tcp6 0 0 [::]:http-alt [::]:* LISTEN 1838/cherokee-worke
tcp6 0 0 [::]:http [::]:* LISTEN 1838/cherokee-worke
tcp6 0 0 [::]:8181 [::]:* LISTEN 1838/cherokee-worke
tcp6 0 0 ip6-localhost:ipp [::]:* LISTEN 612/cupsd
The Virtual Servers Section of the Administration Panel
The next section to be discussed is vServers, which stands for Virtual Servers. Cherokee can support multiple Web servers, called Virtual Servers, which can run simultaneously. Each virtual server may have a different domain name, support different sites and utilize different tools. Even if you don’t want to create multiple virtual servers, you will still use the default virtual server. This virtual server, named default, will exist in every Cherokee server.
On the Basics tab of vServers, you can configure your Web site’s Document Root directory. This is the directory from which Cherokee will serve files. For example, if the Document Root is /var/www, then a client’s request forhttp://www.example.com/index.html refers to /var/www/index.html on the server. As can be seen in the previous image, the Document Root defaults either to /var/www or /usr/local/var/www/ for Ubuntu. If we wish to change the Document Root directory, the path of the new directory can be entered in the Document Root textbox.
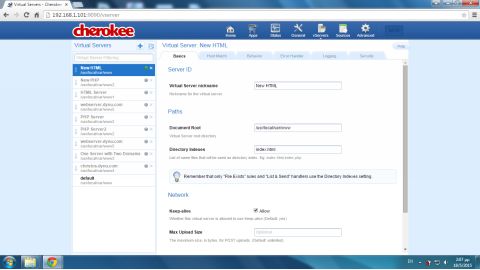
The Directory Indexes text field sets the directory index. The directory index indicates the list of files to send when the client requests a URL with a forward slash (/) at the end of the domain name (e.g., http://webserver.dynu.com/).A common name for the directory indexes file is index plus the corresponding file name extension (e.g., index.html, index.php). If the directory index is set to index.html, the previous URL becomes the equivalent of:
http://webserver.dynu.com/index.html
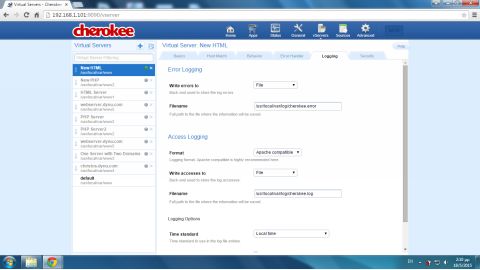
In the Logging tab, we can configure the logging for our Cherokee server (e.g., which two filenames to use for error and access logging). The Error Logging and the Access Logging file names can also be changed from their default.
To enable the Access Logging at the Format drop-down menu, select Apache compatible instead of the default (None). In the Filename textbox, select a new name and path for the log file. You can also leave the default. In the Time standard drop-down menu, select either Local time or UTC (Coordinated Universal Time).
If the default access log location was not changed from its default location, you can review the Access Logging file with the following command:
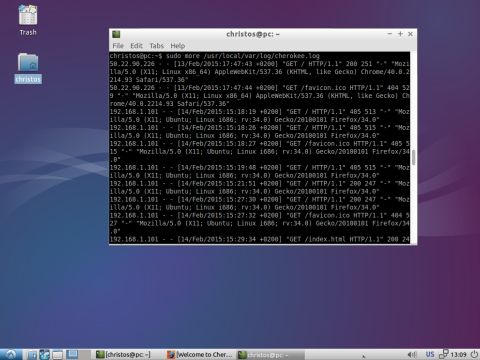
$ sudo more /usr/local/var/log/cherokee.log
The output for the example, shown in the following image, shows records with information about Web client connections to the server. The information includes the IP Address, the time of access, the URL requested by the client, the client’s browser, and the client’s OS. For instance:
50.22.90.226 - - [13/Feb/2015:17:47:43 +0200] "GET / HTTP/1.1" 200 251 "-" "Mozi
lla/5.0 (X11; Linux x86_64) AppleWebKit/537.36 (KHTML, like Gecko) Chrome/40.0.2
214.93 Safari/537.36"
You can also configure the error logging file by selecting File in the Write errors to drop-down menu and then specifying a filename in the Filename textbox. The other menu options are Standard Error, Execute Program, System Logger and Disabled.
Chapters 8 through 12 contain many examples of creating and running multiple virtual servers. Those chapters also discuss the other tabs of the vServers section.