Windows Internals, Sixth Edition, Part 1 (2012)
Chapter 5. Processes, Threads, and Jobs
In this chapter, we’ll explain the data structures and algorithms that deal with processes, threads, and jobs in the Microsoft Windows operating system. The first section focuses on the internal structures that make up a process. The second section outlines the steps involved in creating a process (and its initial thread). The internals of threads and thread scheduling are then described. The chapter concludes with a description of jobs.
Because processes and threads touch so many components in Windows, a number of terms and data structures (such as working sets, objects and handles, system memory heaps, and so on) are referred to in this chapter but are explained in detail elsewhere in the book. To fully understand this chapter, you need to be familiar with the terms and concepts explained in Chapter 1, and Chapter 2, such as the difference between a process and a thread, the Windows virtual address space layout, and the difference between user mode and kernel mode.
Process Internals
This section describes the key Windows process data structures maintained by various parts of the system and describes different ways and tools to examine this data.
Data Structures
Each Windows process is represented by an executive process (EPROCESS) structure. Besides containing many attributes relating to a process, an EPROCESS contains and points to a number of other related data structures. For example, each process has one or more threads, each represented by an executive thread (ETHREAD) structure. (Thread data structures are explained in the section Thread Internals later in this chapter.)
The EPROCESS and most of its related data structures exist in system address space. One exception is the process environment block (PEB), which exists in the process address space (because it contains information accessed by user-mode code). Additionally, some of the process data structures used in memory management, such as the working set list, are valid only within the context of the current process, because they are stored in process-specific system space. (See Chapter 10, “Memory Management,” in Part 2 for more information on process address space.)
For each process that is executing a Win32 program, the Win32 subsystem process (Csrss) maintains a parallel structure called the CSR_PROCESS. Finally, the kernel-mode part of the Win32 subsystem (Win32k.sys) maintains a per-process data structure, W32PROCESS. The W32PROCESS structure is created the first time a thread calls a Windows USER or GDI function that is implemented in kernel mode.
With the exception of the idle process, every EPROCESS structure is encapsulated as a process object by the executive object manager (described in Chapter 3). Because processes are not named objects, they are not visible in the WinObj tool. You can, however, see the Type object called “Process” in the \ObjectTypes directory. A handle to a process provides, through use of the process-related APIs, access to some of the data in the EPROCESS structure and also in some of its associated structures.
Figure 5-1 is a simplified diagram of the process and thread data structures. Each data structure shown in the figure is described in detail in this chapter.
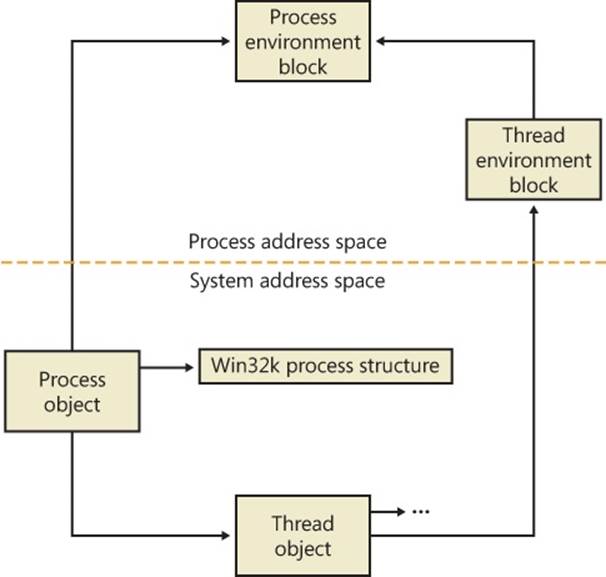
Figure 5-1. Data structures associated with processes and threads
Many other drivers and system components, by registering process creation notifications, can choose to create their own data structures to track information they store on a per-process basis. When one discusses the overhead of a process, the size of such data structures must often be taken into consideration, although it is nearly impossible to obtain an accurate number.
First let’s focus on the process object. (The thread object is covered in the section Thread Internals later in the chapter.) Figure 5-2 shows the key fields in an EPROCESS structure.
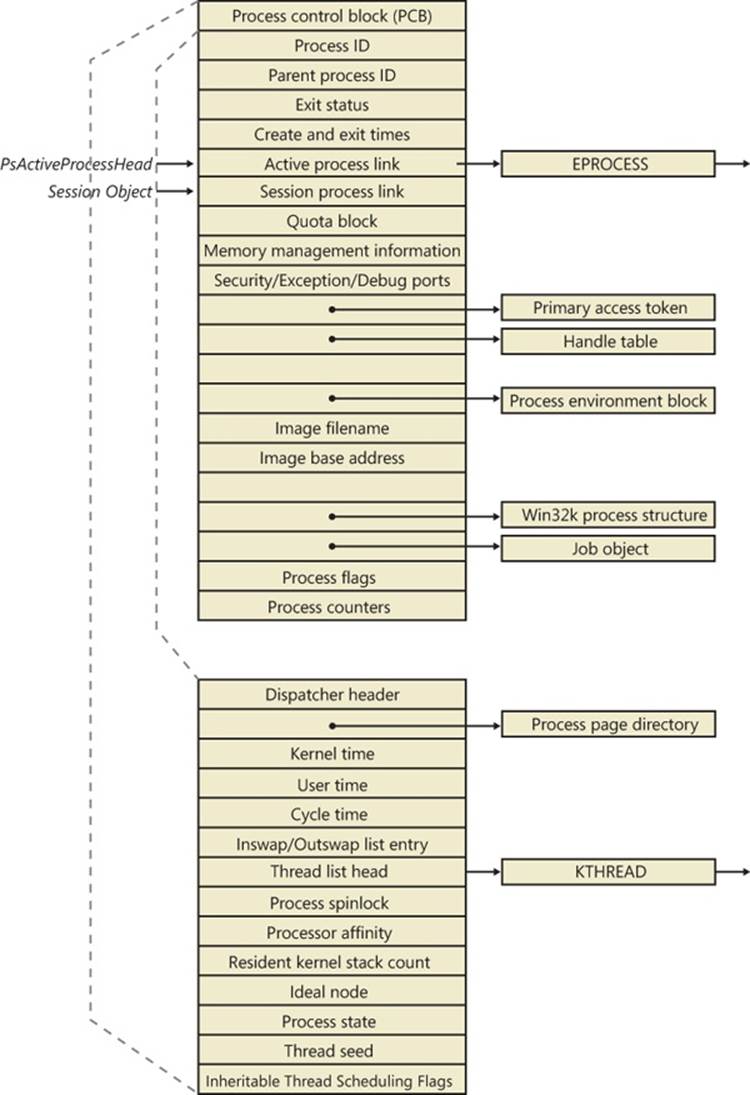
Figure 5-2. Important fields of the executive process structure and its embedded kernel process structure
Similar to the way that the kernel’s APIs and components are divided into isolated and layered modules with their own naming conventions, the data structures for a process follow a similar design. As shown in Figure 5-2, the first member of the executive process structure is calledPcb, for process control block. It is a structure of type KPROCESS, for kernel process. Although routines in the executive store information in the EPROCESS, the dispatcher, scheduler, and interrupt/time accounting code—being part of the operating system kernel—use the KPROCESS instead. This allows a layer of abstraction to exist between the executive’s high-level functionality and its underlying low-level implementation of certain functions, and it helps prevent unwanted dependencies between the layers.
EXPERIMENT: DISPLAYING THE FORMAT OF AN EPROCESS STRUCTURE AND ITS FIELDS
For a list of the fields that make up an EPROCESS structure and their offsets in hexadecimal, type dt nt!_eprocess in the kernel debugger. (See Chapter 1 for more information on the kernel debugger and how to perform kernel debugging on the local system.) The output (truncated for the sake of space) on a 32-bit system looks like this:
lkd> dt nt!_eprocess
+0x000 Pcb : _KPROCESS
+0x080 ProcessLock : _EX_PUSH_LOCK
+0x088 CreateTime : _LARGE_INTEGER
+0x090 ExitTime : _LARGE_INTEGER
+0x098 RundownProtect : _EX_RUNDOWN_REF
+0x09c UniqueProcessId : Ptr32 Void
...
+0x0dc ObjectTable : Ptr32 _HANDLE_TABLE
+0x0e0 Token : _EX_FAST_REF
...
+0x108 Win32Process : Ptr32 Void
+0x10c Job : Ptr32 _EJOB
...
+0x2a8 TimerResolutionLink : _LIST_ENTRY
+0x2b0 RequestedTimerResolution : Uint4B
+0x2b4 ActiveThreadsHighWatermark : Uint4B
+0x2b8 SmallestTimerResolution : Uint4B
+0x2bc TimerResolutionStackRecord : Ptr32 _PO_DIAG_STACK_RECORD
The first member of this structure (Pcb) is an imbedded structure of type KPROCESS. This is where scheduling and time-accounting data is stored. You can display the format of the kernel process structure in the same way as the EPROCESS:
lkd> dt _kprocess
nt!_KPROCESS
+0x000 Header : _DISPATCHER_HEADER
+0x010 ProfileListHead : _LIST_ENTRY
+0x018 DirectoryTableBase : Uint4B
...
+0x074 StackCount : _KSTACK_COUNT
+0x078 ProcessListEntry : _LIST_ENTRY
+0x080 CycleTime : Uint8B
+0x088 KernelTime : Uint4B
+0x08c UserTime : Uint4B
+0x090 VdmTrapcHandler : Ptr32 Void
The dt command also enables you to view the specific contents of one field or multiple fields by typing their names following the structure name—such as dt nt!_eprocess UniqueProcessId, which displays the process ID field. In the case of a field that represents a structure—such as the Pcb field of EPROCESS, which contains the KPROCESS substructure—adding a period after the field name will cause the debugger to display the substructure.
For example, an alternative way to see the KPROCESS is to type dt nt!_eprocess Pcb. You can continue to recurse this way by adding more field names (within KPROCESS) and so on. Finally, to recurse through all the substructures, the –r switch of the dt command allows you to do just that. Adding a number after the switch controls the depth of recursion the command will follow.
The dt command used as shown earlier shows the format of the selected structure, not the contents of any particular instance of that structure type. To show an instance of an actual process, you can specify the address of an EPROCESS structure as an argument to the dt command. You can get the addresses of almost all of the EPROCESS structures in the system by using the!process 0 0 command (the exception being the system idle process). Because the KPROCESS is the first thing in the EPROCESS, the address of an EPROCESS will also work as the address of a KPROCESS with dt _kprocess.
Processes and threads are such integral parts of Windows that it’s impossible to talk about them without referring to many other parts of the system. To keep the length of this chapter manageable, however, those related subjects (such as memory management, security, objects, and handles) are covered elsewhere.
EXPERIMENT: USING THE KERNEL DEBUGGER !PROCESS COMMAND
The kernel debugger !process command displays a subset of the information in a process object and its associated structures. This output is arranged in two parts for each process. First you see the information about the process, as shown here. (When you don’t specify a process address or ID, !process lists information for the process owning the thread currently running on CPU 0, which will be WinDbg itself on a single-processor system.)
lkd> !process
PROCESS 85857160 SessionId: 1 Cid: 0bcc Peb: 7ffd9000 ParentCid: 090c
DirBase: b45b0820 ObjectTable: b94ffda0 HandleCount: 99.
Image: windbg.exe
VadRoot 85a1c8e8 Vads 97 Clone 0 Private 5919. Modified 153. Locked 1.
DeviceMap 9d32ee50
Token ebaa1938
...
' PageFaultCount 37066
MemoryPriority BACKGROUND
BasePriority 8
CommitCharge 6242
After the basic process output comes a list of the threads in the process. That output is explained in the EXPERIMENT: Using the Kernel Debugger !thread Command section later in the chapter.
Other commands that display process information include !handle, which dumps the process handle table (which is described in more detail in the section Object Handles and the Process Handle Table in Chapter 3). Process and thread security structures are described in Chapter 6.
Note that the output gives you the address of the PEB, which you can use with the !peb command shown in the next experiment to see the PEB of an arbitrary process. However, because the PEB is in the user-mode address space, it is valid only within the context of its own process. To look at the PEB of another process, you must first switch WinDbg to that process. You can do this with the .process command, followed by the EPROCESS pointer.
The PEB lives in the user-mode address space of the process it describes. It contains information needed by the image loader, the heap manager, and other Windows components that need to access it from user mode. The EPROCESS and KPROCESS structures are accessible only from kernel mode. The important fields of the PEB are illustrated in Figure 5-3 and are explained in more detail later in this chapter.
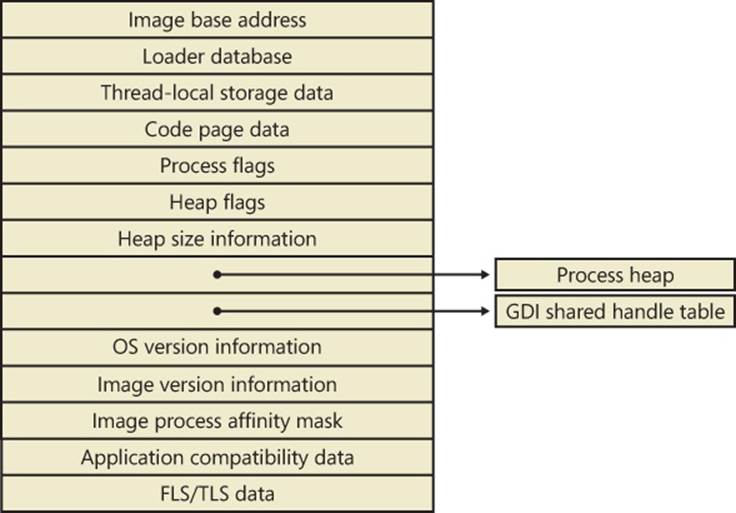
Figure 5-3. Fields of the process environment block
EXPERIMENT: EXAMINING THE PEB
You can dump the PEB structure with the !peb command in the kernel debugger, which displays the PEB of the process that owns the currently running thread on CPU 0. By using the information in the previous experiment, you can also use the PEB pointer as an argument to the command.
lkd> !peb 7ffd9000
PEB at 7ffd9000
InheritedAddressSpace: No
ReadImageFileExecOptions: No
BeingDebugged: No
ImageBaseAddress: 002a0000
Ldr 77895d00
...
WindowTitle: 'C:\Users\Alex Ionescu\Desktop\WinDbg.lnk'
ImageFile: 'C:\Program Files\Debugging Tools for Windows\windbg.exe'
CommandLine: '"C:\Program Files\Debugging Tools for Windows\windbg.exe" '
DllPath: 'C:\Program Files\Debugging Tools for Windows;C:\Windows\
system32;C:\Windows\system;C:\Windows
Environment: 001850a8
ALLUSERSPROFILE=C:\ProgramData
APPDATA=C:\Users\Alex Ionescu\AppData\Roaming
...
The CSR_PROCESS structure contains information about processes that is specific to the Windows subsystem (Csrss). As such, only Windows applications have a CSR_PROCESS structure associated with them (for example, Smss does not). Additionally, because each session has its own instance of the Windows subsystem, the CSR_PROCESS structures are maintained by the Csrss process within each individual session. The basic structure of the CSR_PROCESS is illustrated in Figure 5-4 and is explained in more detail later in this chapter.
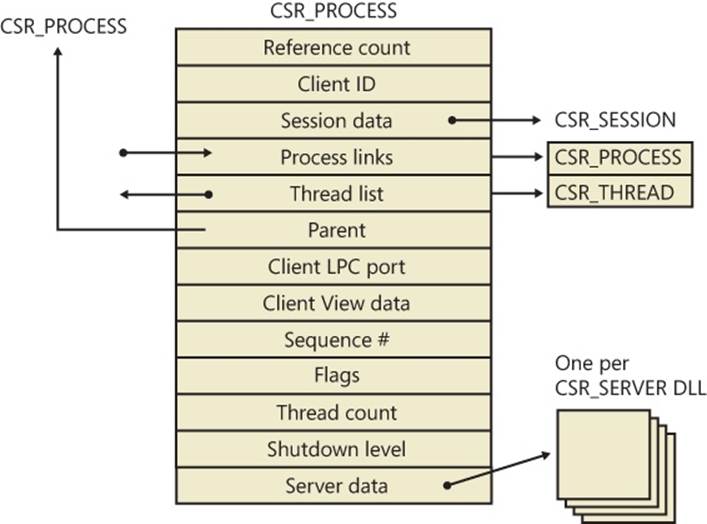
Figure 5-4. Fields of the CSR process structure
EXPERIMENT: EXAMINING THE CSR_PROCESS
You can dump the CSR_PROCESS structure with the !dp command in the user-mode debugger while attached to the Csrss process of the session you want to inspect. Use the File, Attach To A Process option to get a list of processes, and select the Csrss process for the correct session. (You can see the session of the process by expanding the tree item for it.) Make sure to select the Noninvasive check box to avoid freezing your system.
The !dp command takes as input the PID of the process whose CSR_PROCESS structure should be dumped. Alternatively, the structure pointer can be given directly as an argument. Because !dp already performs a dt command internally, there is no need to use dt on your own.
0:000> !dp v 0x1c0aa8-8
PCSR_PROCESS @ 001c0aa0:
+0x000 ClientId : _CLIENT_ID
+0x008 ListLink : _LIST_ENTRY [ 0x1d8618 - 0x1b1b10 ]
+0x010 ThreadList : _LIST_ENTRY [ 0x1c0b80 - 0x1c7638 ]
+0x018 NtSession : 0x001c0bb8 _CSR_NT_SESSION
...
+0x054 Luid : _LUID
+0x05c ServerDllPerProcessData : [1] (null)
Threads:
Thread 001c0b78, Process 001c0aa0, ClientId 198.19c, Flags 0, Ref Count 1
Thread 001c0e78, Process 001c0aa0, ClientId 198.1cc, Flags 0, Ref Count 1
...
The W32PROCESS structure is the final system data structure associated with processes that we’ll look at. It contains all the information that the Windows graphics and window management code in the kernel (Win32k) needs to maintain state information about GUI processes (which were defined earlier as processes that have done at least one USER/GDI system call). The basic structure of the W32PROCESS is illustrated in Figure 5-5 and is explained in more detail later in this chapter.
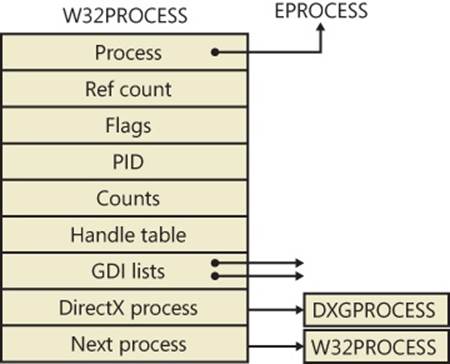
Figure 5-5. Fields of the Win32k Process structure
EXPERIMENT: EXAMINING THE W32PROCESS
There is no command provided by the debugger extensions to dump the W32PROCESS structure, but it is present in the symbols of the Win32k driver. As such, by using the dt command with the appropriate symbol name win32k!_W32PROCESS, it is possible to dump the fields as long as the pointer is known. Because the !process command does not actually output this pointer (even though it is stored in the EPROCESS object), the field must be inspected manually with dt nt!_EPROCESS Win32Process followed by an EPROCESS pointer.
In the following example, the W32PROCESS structure for the shell, Explorer.exe, is shown:
lkd> dt win32k!_W32PROCESS 0xff991490
+0x000 Process : 0x84a2b030 _EPROCESS
+0x004 RefCount : 1
...
+0x020 W32Pid : 0x590
+0x024 GDIHandleCount : 383
+0x028 GDIHandleCountPeak : 0x239
+0x02c UserHandleCount : 228
+0x030 UserHandleCountPeak : 0x16c
...
+0x088 hSecureGdiSharedHandleTable : 0x84a24159
+0x08c DxProcess : 0xa2c93980
The DxProcess field is a pointer to yet another per-process data structure—in this case, maintained by the DirectX Video Card Port Driver—but its description is beyond the scope of this book.
Protected Processes
In the Windows security model, any process running with a token containing the debug privilege (such as an administrator’s account) can request any access right that it desires to any other process running on the machine—for example, it can read and write arbitrary process memory, inject code, suspend and resume threads, and query information on other processes. Tools such as Process Explorer and Task Manager need and request these access rights to provide their functionality to users.
This logical behavior (which helps ensure that administrators will always have full control of the running code on the system) clashes with the system behavior for digital rights management requirements imposed by the media industry on computer operating systems that need to support playback of advanced, high-quality digital content such as Blu-ray and HD-DVD media. To support reliable and protected playback of such content, Windows uses protected processes. These processes exist alongside normal Windows processes, but they add significant constraints to the access rights that other processes on the system (even when running with administrative privileges) can request.
Protected processes can be created by any application; however, the operating system will allow a process to be protected only if the image file has been digitally signed with a special Windows Media Certificate. The Protected Media Path (PMP) in Windows makes use of protected processes to provide protection for high-value media, and developers of applications such as DVD players can make use of protected processes by using the Media Foundation API.
The Audio Device Graph process (Audiodg.exe) is a protected process because protected music content can be decoded through it. Similarly, the Windows Error Reporting (or WER, discussed in Chapter 3) client process (Werfault.exe) can also run protected because it needs to have access to protected processes in case one of them crashes. Finally, the System process itself is protected because some of the decryption information is generated by the Ksecdd.sys driver and stored in its user-mode memory. The System process is also protected to protect the integrity of all kernel handles (because the System process’ handle table contains all the kernel handles on the system).
At the kernel level, support for protected processes is twofold: first, the bulk of process creation occurs in kernel mode to avoid injection attacks. (The flow for both protected and standard process creation is described in detail in the next section.) Second, protected processes have a special bit set in their EPROCESS structure that modifies the behavior of security-related routines in the process manager to deny certain access rights that would normally be granted to administrators. In fact, the only access rights that are granted for protected processes are PROCESS_QUERY/SET_LIMITED_INFORMATION, PROCESS_TERMINATE, and PROCESS_SUSPEND_RESUME. Certain access rights are also disabled for threads running inside protected processes; we will look at those access rights later in this chapter in the sectionThread Internals.
Because Process Explorer uses standard user-mode Windows APIs to query information on process internals, it is unable to perform certain operations on such processes. On the other hand, a tool like WinDbg in kernel-debugging mode, which uses kernel-mode infrastructure to obtain this information, will be able to display complete information. See the experiment in the Thread Internals section on how Process Explorer behaves when confronted with a protected process such as Audiodg.exe.
NOTE
As mentioned in Chapter 1, to perform local kernel debugging, you must boot in debugging mode (enabled by using bcdedit /debug on or by using the Msconfig advanced boot options). This protects against debugger-based attacks on protected processes and the Protected Media Path (PMP). When booted in debugging mode, high-definition content playback will not work.
Limiting these access rights reliably allows the kernel to sandbox a protected process from user-mode access. On the other hand, because a protected process is indicated by a flag in the EPROCESS structure, an administrator can still load a kernel-mode driver that disables this bit. However, this would be a violation of the PMP model and considered malicious, and such a driver would likely eventually be blocked from loading on a 64-bit system because the kernel-mode, code-signing policy prohibits the digital signing of malicious code. Even on 32-bit systems, the driver has to be recognized by PMP policy or else the playback will be halted. This policy is implemented by Microsoft and not by any kernel detection. This block would require manual action from Microsoft to identify the signature as malicious and update the kernel.
Flow of CreateProcess
So far, this chapter has shown the various data structures involved in process state manipulation and management, and how various tools and debugger commands can inspect this information. In this section, we’ll see how and when those data structures are created and filled out, as well as the overall creation and termination behaviors behind processes.
A Windows subsystem process is created when an application calls (or eventually ends up in) one of the process-creation functions, such as CreateProcess, CreateProcessAsUser, CreateProcessWithTokenW, or CreateProcessWithLogonW. Creating a Windows process consists of several stages carried out in three parts of the operating system: the Windows client-side library Kernel32.dll (in the case of the CreateProcessAsUser, CreateProcessWithTokenW, and CreateProcessWithLogonW routines, part of the work is first done in Advapi32.dll), the Windows executive, and the Windows subsystem process (Csrss).
Because of the multiple-environment subsystem architecture of Windows, creating an executive process object (which other subsystems can use) is separated from the work involved in creating a Windows subsystem process. So, although the following description of the flow of the Windows CreateProcess function is complicated, keep in mind that part of the work is specific to the semantics added by the Windows subsystem as opposed to the core work needed to create an executive process object.
The following list summarizes the main stages of creating a process with the Windows CreateProcess function. The operations performed in each stage are described in detail in the subsequent sections. Some of these operations might be performed by CreateProcess itself (or other helper routines in user mode), while others will be performed by NtCreateUserProcess or one of its helper routines in kernel mode. In our detailed analysis to follow, we will differentiate between the two at each step required.
NOTE
Many steps of CreateProcess are related to the setup of the process virtual address space and therefore refer to many memory management terms and structures that are defined in Chapter 10 in Part 2.
1. Validate parameters; convert Windows subsystem flags and options to their native counterparts; parse, validate, and convert the attribute list to its native counterpart.
2. Open the image file (.exe) to be executed inside the process.
3. Create the Windows executive process object.
4. Create the initial thread (stack, context, and Windows executive thread object).
5. Perform post-creation, Windows-subsystem-specific process initialization.
6. Start execution of the initial thread (unless the CREATE_ SUSPENDED flag was specified).
7. In the context of the new process and thread, complete the initialization of the address space (such as load required DLLs) and begin execution of the program.
Figure 5-6 shows an overview of the stages Windows follows to create a process.
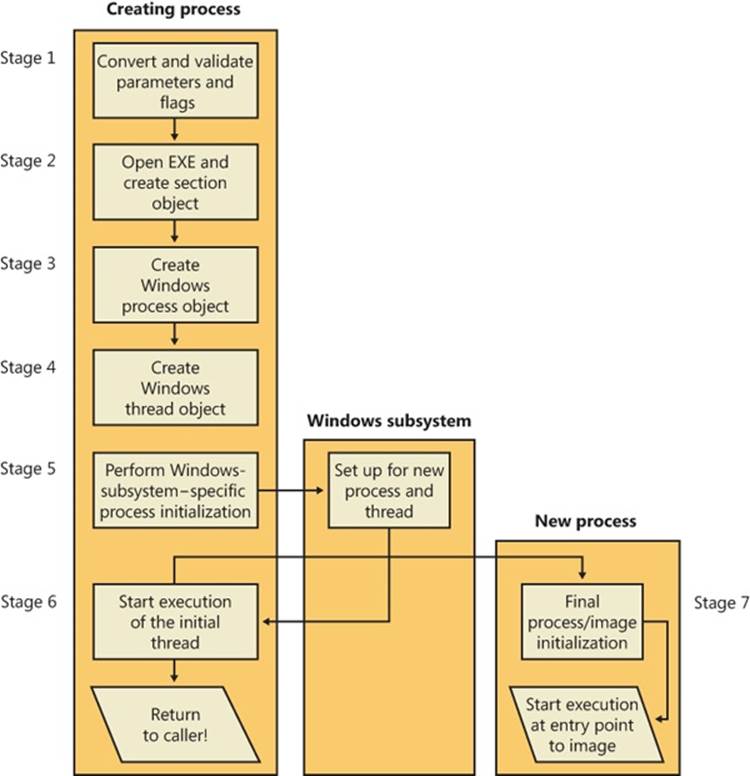
Figure 5-6. The main stages of process creation
Stage 1: Converting and Validating Parameters and Flags
Before opening the executable image to run, CreateProcess performs the following steps.
In CreateProcess, the priority class for the new process is specified as independent bits in the CreationFlags parameter. Thus, you can specify more than one priority class for a single CreateProcess call. Windows resolves the question of which priority class to assign to the process by choosing the lowest-priority class set.
If no priority class is specified for the new process, the priority class defaults to Normal unless the priority class of the process that created it is Idle or Below Normal, in which case the priority class of the new process will have the same priority as the creating class.
If a Real-time priority class is specified for the new process and the process’ caller doesn’t have the Increase Scheduling Priority privilege, the High priority class is used instead. In other words, CreateProcess doesn’t fail just because the caller has insufficient privileges to create the process in the Real-time priority class; the new process just won’t have as high a priority as Real-time.
All windows are associated with desktops, the graphical representation of a workspace. If no desktop is specified in CreateProcess, the process is associated with the caller’s current desktop.
If the process is part of a job object, but the creation flags requested a separate virtual DOS machine (VDM), the flag is ignored.
If the caller is sending a handle to a monitor as an output handle instead of a console handle, standard handle flags are ignored.
If the creation flags specify that the process will be debugged, Kernel32 initiates a connection to the native debugging code in Ntdll.dll by calling DbgUiConnectToDbg and gets a handle to the debug object from the current thread’s environment block (TEB).
Kernel32.dll sets the default hard error mode if the creation flags specified one.
The user-specified attribute list is converted from Windows subsystem format to native format and internal attributes are added to it. The possible attributes that can be added to the attribute list are listed in Table 5-1, including their documented Windows API counterparts, if any.
NOTE
The attribute list passed on a CreateProcess call permits passing back to the caller information beyond a simple status code, such as the TEB address of the initial thread or information on the image section. This is necessary for protected processes because the parent cannot query this information after the child is created.
Table 5-1. Process Attributes
|
Native Attribute |
Equivalent Windows Attribute |
Type |
Description |
|
PS_CP_PARENT_PROCESS |
PROC_THREAD_ATTRIBUTE_PARENT_PROCESS. Also used when elevating |
Input |
Handle to the parent process. |
|
PS_CP_DEBUG_OBJECT |
N/A – used when using DEBUG_PROCESS as a flag |
Input |
Debug object if process is being started debugged. |
|
PS_CP_PRIMARY_TOKEN |
N/A – used when using CreateProcessAsUser/WithToken |
Input |
Process token if CreateProcessAsUser was used. |
|
PS_CP_CLIENT_ID |
N/A – returned by Win32 API as a parameter |
Output |
Returns the TID and PID of the initial thread and the process. |
|
PS_CP_TEB_ADDRESS |
N/A – internally used and not exposed |
Output |
Returns the address of the TEB for the initial thread. |
|
PS_CP_FILENAME |
N/A – used as a parameter in CreateProcess API. |
Input |
Name of the process that should be created. |
|
PS_CP_IMAGE_INFO |
N/A – internally used and not exposed |
Output |
Returns SECTION_IMAGE_INFORMATION, which contains information on the version, flags, and subsystem of the executable, as well as the stack size and entry point. |
|
PS_CP_MEM_RESERVE |
N/A – internally used by SMSS and CSRSS. |
Input |
Array of virtual memory reservations that should be made during initial process address space creation, allowing guaranteed availability because no other allocations have taken place yet. |
|
PS_CP_PRIORITY_CLASS |
N/A – passed in as a parameter to the CreateProcess API. |
Input |
Priority class that the process should be given. |
|
PS_CP_ERROR_MODE |
N/A – passed in through CREATE_DEFAULT_ERROR_MODE flag |
Input |
Hard error-processing mode for the process. |
|
PS_CP_STD_HANDLE_INFO |
Input |
Specifies if standard handles should be duplicated, or if new handles should be created. |
|
|
PS_CP_HANDLE_LIST |
PROC_THREAD_ATTRIBUTE_HANDLE_LIST |
Input |
List of handles belonging to the parent process that should be inherited by the new process. |
|
PS_CP_GROUP_AFFINITY |
PROC_THREAD_ATTRIBUTE_GROUP_AFFINITY |
Input |
Processor group(s) the thread should be allowed to run on. |
|
PS_CP_PREFERRED_NODE |
PROC_THREAD_ATTRIBUTES_PRFERRED_NODE |
Input |
Preferred (ideal) node that should be associated with the process. It affects the node on which the initial process heap and thread stack will be created. |
|
PS_CP_IDEAL_PROCESSOR |
PROC_THREAD_ATTTRIBUTE_IDEAL_PROCESSOR |
Input |
Preferred (ideal) processor that the thread should be scheduled on. |
|
PS_CP_UMS_THREAD |
PROC_THREAD_ATTRIBUTE_UMS_THREAD |
Input |
Contains the UMS attributes, completion list, and context. |
|
PS_CP_EXECUTE_OPTIONS |
PROC_THREAD_MITIGATION_POLICY |
Input |
Contains information on which mitigations (SEHOP, ATL Emulation, NX) should be enabled/disabled for the process. |
Once these steps are completed, CreateProcess performs the initial call to NtCreateUserProcess to attempt creation of the process. Because Kernel32.dll has no idea at this point whether the application image name is a real Windows application or a POSIX, 16-bit, or DOS application, the call might fail—at which point, CreateProcess looks at the error reason and attempts to correct the situation.
Stage 2: Opening the Image to Be Executed
As illustrated in Figure 5-7, the first stage in NtCreateUserProcess is to find the appropriate Windows image that will run the executable file specified by the caller and to create a section object to later map it into the address space of the new process. If the call failed for any reason, it returns to CreateProcess with a failure state (see Table 5-2) that causes CreateProcess to attempt execution again.
If the executable file specified is a Windows .exe, NtCreateUserProcess tries to open the file and create a section object for it. The object isn’t mapped into memory yet, but it is opened. Just because a section object has been successfully created doesn’t mean that the file is a valid Windows image, however; it could be a DLL or a POSIX executable. If the file is a POSIX executable, the image to be run changes to Posix.exe, and CreateProcess restarts from the beginning of Stage 1. If the file is a DLL, CreateProcess fails.
Now that NtCreateUserProcess has found a valid Windows executable image, as part of the process creation code described in Stage 3 it looks in the registry under HKLM\SOFTWARE\Microsoft \Windows NT\CurrentVersion\Image File Execution Options to see whether a subkey with the file name and extension of the executable image (but without the directory and path information—for example, Image.exe) exists there. If it does, PspAllocateProcess looks for a value named Debugger for that key. If this value is present, the image to be run becomes the string in that value and CreateProcess restarts at Stage 1.
TIP
You can take advantage of this process creation behavior and debug the startup code of Windows services processes before they start rather than attach the debugger after starting a service, which doesn’t allow you to debug the startup code.
On the other hand, if the image is not a Windows .exe (for example, if it’s an MS-DOS, a Win16, or a POSIX application), CreateProcess goes through a series of steps to find a Windows support image to run it. This process is necessary because non-Windows applications aren’t run directly—Windows instead uses one of a few special support images that, in turn, are responsible for actually running the non-Windows program. For example, if you attempt to run a POSIX application, CreateProcess identifies it as such and changes the image to be run to the Windows executable file Posix.exe. If you attempt to run an MS-DOS or a Win16 executable, the image to be run becomes the Windows executable Ntvdm.exe. In short, you can’t directly create a process that is not a Windows process. If Windows can’t find a way to resolve the activated image as a Windows process (as shown in Table 5-2), CreateProcess fails.
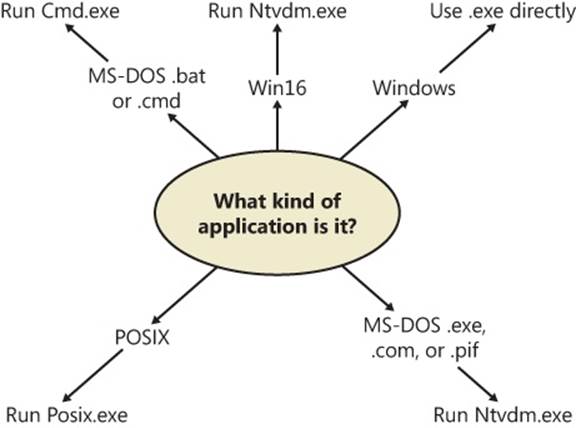
Figure 5-7. Choosing a Windows image to activate
Table 5-2. Decision Tree for Stage 1 of CreateProcess
|
If the Image . . . |
Create State Code |
This Image Will Run . . . |
. . . and This Will Happen |
|
Is a POSIX executable file |
PsCreateSuccess |
Posix.exe |
CreateProcess restarts Stage 1. |
|
Is an MS-DOS application with an .exe, .com, or .pif extension |
PsCreateFailOnSectionCreate |
Ntvdm.exe |
CreateProcess restarts Stage 1. |
|
Is a Win16 application |
PsCreateFailOnSectionCreate |
Ntvdm.exe |
CreateProcess restarts Stage 1. |
|
Is a Win64 application on a 32-bit system (or a PPC, MIPS, or Alpha Binary) |
PsCreateFailMachineMismatch |
N/A |
CreateProcess will fail. |
|
Has a Debugger key with another image name |
PsCreateFailExeName |
Name specified in the Debugger key |
CreateProcess restarts Stage 1. |
|
Is an invalid or damaged Windows EXE |
PsCreateFailExeFormat |
N/A |
CreateProcess will fail. |
|
Cannot be opened |
PsCreateFailOnFileOpen |
N/A |
CreateProcess will fail. |
|
Is a command procedure (application with a .bat or .cmd extension) |
PsCreateFailOnSectionCreate |
Cmd.exe |
CreateProcess restarts Stage 1. |
Specifically, the decision tree that CreateProcess goes through to run an image is as follows:
§ If the image is an MS-DOS application with an .exe, .com, or .pif extension, a message is sent to the Windows subsystem to check whether an MS-DOS support process (Ntvdm.exe, specified in the registry value HKLM\SYSTEM\CurrentControlSet\Control\WOW\cmdline) has already been created for this session. If a support process has been created, it is used to run the MS-DOS application. (The Windows subsystem sends the message to the VDM [Virtual DOS Machine] process to run the new image.) Then CreateProcess returns. If a support process hasn’t been created, the image to be run changes to Ntvdm.exe and CreateProcess restarts at Stage 1.
§ If the file to run has a .bat or .cmd extension, the image to be run becomes Cmd.exe, the Windows command prompt, and CreateProcess restarts at Stage 1. (The name of the batch file is passed as the first parameter to Cmd.exe.)
§ If the image is a Win16 (Windows 3.1) executable, CreateProcess must decide whether a new VDM process must be created to run it or whether it should use the default sessionwide shared VDM process (which might not yet have been created). The CreateProcess flags CREATE_SEPARATE_WOW_VDM and CREATE_SHARED_WOW_VDM control this decision. If these flags aren’t specified, the registry value HKLM\SYSTEM\CurrentControlSet\Control\WOW\DefaultSeparateVDM dictates the default behavior. If the application is to be run in a separate VDM, the image to be run changes to ntvdm.exe followed by some configuration parameters and the 16-bit process’ name and CreateProcess restarts at Stage 1. Otherwise, the Windows subsystem sends a message to see whether the shared VDM process exists and can be used. (If the VDM process is running on a different desktop or isn’t running under the same security as the caller, it can’t be used and a new VDM process must be created.) If a shared VDM process can be used, the Windows subsystem sends a message to it to run the new image and CreateProcess returns. If the VDM process hasn’t yet been created (or if it exists but can’t be used), the image to be run changes to the VDM support image and CreateProcess restarts at Stage 1.
Stage 3: Creating the Windows Executive Process Object (PspAllocateProcess)
At this point, NtCreateUserProcess has opened a valid Windows executable file and created a section object to map it into the new process address space. Next it creates a Windows executive process object to run the image by calling the internal system function PspAllocateProcess. Creating the executive process object (which is done by the creating thread) involves the following substages:
§ Setting up the EPROCESS object
§ Creating the initial process address space
§ Initializing the kernel process structure(KPROCESS)
§ Setting up the PEB
§ Concluding the setup of the process address space (which includes initializing the working set list and virtual address space descriptors and mapping the image into address space)
NOTE
The only time there won’t be a parent process is during system initialization. After that point, a parent process is always required to provide a security context for the new process.
Stage 3A: Setting Up the EPROCESS Object
This substage involves the following steps:
1. Inherit the affinity of the parent process, unless it was explicitly set during process creation (through the attribute list).
2. Choose the ideal node that was specified in the attribute list, if any.
3. Inherit the I/O and page priority from the parent process. If there is no parent process, the default page priority (5) and I/O priority (Normal) are used.
4. Set the new process’ exit status to STATUS_PENDING.
5. Choose the hard error processing mode selected by the attribute list; otherwise, inherit the parent’s processing mode if none was given. If no parent exists, use the default processing mode which is to display all errors.
6. Store the parent process’ process ID in the InheritedFromUniqueProcessId field in the new process object.
7. Query the Image File Execution Options key to check if the process should be mapped with large pages. Also, query the key to check if NTDLL has been listed as a DLL that should be mapped with large pages within this process.
8. Query the Image File Execution Options key for a specific NUMA node assignment associated with the process. The assignment can be either based on inheritance (in which the NUMA node will be propagated from the parent) or an explicit NUMA assignment, as long as this assignment does not override the initial NUMA node specified in the attribute list.
9. Disable stack randomization if ASLR was disabled on the executable containing the process.
10.Attempt to acquire all the privileges required for creating the process. Choosing the Real-time process priority class, assigning a token to the new process, mapping the process with large pages, and creating the process within a new session are all operations that require the appropriate privilege.
11.Create the process’ primary access token (a duplicate of its parent’s primary token). New processes inherit the security profile of their parents. If the CreateProcessAsUser function is being used to specify a different access token for the new process, the token is then changed appropriately. This change might happen only if the parent token’s integrity level dominates the integrity level of the access token, and if the access token is a true child or sibling of the parent token. Note that if the parent has the SeAssignPrimaryToken privilege, this will bypass these checks.
12.The session ID of the new process token is now checked to determine if this is a cross-session create—in which case, the parent process temporarily attaches to the target session to correctly process quotas and address space creation.
13.Set the new process’ quota block to the address of its parent process’ quota block, and increment the reference count for the parent’s quota block. If the process was created through CreateProcessAsUser, this step won’t occur. Instead, the default quota is created, or a quota matching the user’s profile is selected.
14.The process minimum and maximum working set sizes are set to the values of PspMinimumWorkingSet and PspMaximumWorkingSet, respectively. These values can be overridden if performance options were specified in the PerfOptions key part of Image File Execution Options—in which case, the maximum working set is taken from there. Note that the default working set limits are soft limits and are essentially hints, while the PerfOptions working set maximum is a hard limit (that is, the working set will not be allowed to grow past that number).
15.Initialize the address space of the process. (See Stage 3B.) Then detach from the target session if it was different.
16.The group affinity for the process is now chosen if group-affinity inheritance was not used. The default group affinity either will inherit from the parent, if NUMA node propagation was set earlier (the group owning the NUMA node will be used) or be assigned round-robin based on the PspProcessGroupAssignment seed. If the system is in forced group-awareness mode and group 0 was chosen by the selection algorithm, group 1 is chosen instead, as long as it exists.
17.Initialize the KPROCESS part of the process object. (See Stage 3C.)
18.The token for the process is now set.
19.The process’ priority class is set to normal, unless the parent was using idle or the Below Normal process priority class—in which case, the parent’s priority is inherited. If a process priority class was set manually through the attribute lists, it is now set.
20.The process handle table is initialized. If the inherit handles flag is set for the parent process, any inheritable handles are copied from the parent’s object handle table into the new process. (For more information about object handle tables, see Chapter 3.) A process attribute can also be used to specify only a subset of handles, which is useful when you are using CreateProcessAsUser to restrict which objects should be inherited by the child process.
21.If performance options were specified through the PerfOptions key, these are now applied. The PerfOptions key includes overrides for the working set limit, I/O priority, page priority, and CPU priority class of the process.
22.The final process priority class and the default quantum for its threads are computed and set.
23.The second stage of address space setup is completed, including the initialization of the PEB (Stage 3D/3E).
24.Mitigation options for No-Execute support are now set.
25.The process PID and creation time is set, although the PID is not yet inserted in the PID handle table, nor is the process inserted in the process lists (that is the job of the insertion stage).
Stage 3B: Creating the Initial Process Address Space
The initial process address space consists of the following pages:
§ Page directory (and it’s possible there’ll be more than one for systems with page tables more than two levels, such as x86 systems in PAE mode or 64-bit systems)
§ Hyperspace page
§ VAD bitmap page
§ Working set list
To create these three pages, the following steps are taken:
1. Page table entries are created in the appropriate page tables to map the initial pages.
2. The number of pages is deducted from the kernel variable MmTotalCommittedPages and added to MmProcessCommit.
3. The systemwide default process minimum working set size (PsMinimumWorkingSet) is deducted from MmResidentAvailablePages.
4. The page table pages for the global system space (that is, other than the process-specific pages we just described, and except session-specific memory).
Stage 3C: Creating the Kernel Process Structure
The next stage of PspAllocateProcess is the initialization of the KPROCESS structure (the Pcb member of the EPROCESS). This work is performed by KeInitializeProcess, which initializes the following:
§ The doubly-linked list which connects all threads part of the process (initially empty).
§ The initial value (or reset value) of the process default quantum (which is described in more detail in the Thread Scheduling section later in the chapter), which is hard-coded to 6 until it is initialized later (by PspComputeQuantumAndPriority).
NOTE
The default initial quantum differs between Windows client and server systems. For more information on thread quantums, turn to their discussion in the section Thread Scheduling.
§ The process’ base priority is set based on what was computed in Stage 3A.
§ The default processor affinity for the threads in the process is set, as is the group affinity. The group affinity was calculated earlier in Stage 3A or inherited from the parent.
§ The process swapping state is set to resident.
§ The thread seed is based on the ideal processor that the kernel has chosen for this process (which is based on the previously created process’ ideal processor, effectively randomizing this in a round-robin manner). Creating a new process will update the seed in KeNodeBlock (the initial NUMA node block) so that the next new process will get a different ideal processor seed.
Stage 3D: Concluding the Setup of the Process Address Space
Setting up the address space for a new process is somewhat complicated, so let’s look at what’s involved one step at a time. To get the most out of this section, you should have some familiarity with the internals of the Windows memory manager, which are described in Chapter 10 in Part 2.
1. The virtual memory manager sets the value of the process’ last trim time to the current time. The working set manager (which runs in the context of the balance set manager system thread) uses this value to determine when to initiate working set trimming.
2. The memory manager initializes the process’ working set list—page faults can now be taken.
3. The section (created when the image file was opened) is now mapped into the new process’ address space, and the process section base address is set to the base address of the image.
4. Ntdll.dll is mapped into the process; if this is a Wow64 process, the 32-bit Ntdll.dll is also mapped.
5. A new session, if requested, is now created for the process. This special step is mostly implemented for the benefit of the Session Manager (SMSS) when initializing a new session.
6. The standard handles are duplicated, and the new values are written in the process parameters structure.
7. Any memory reservations listed in the attribute list are now processed. Additionally, two flags allow the bulk reservation of the first 1 or 16 MB of the address space. These flags are used internally for mapping real-mode vectors and ROM code, for example (which must be in the low ranges of virtual address space, where normally the heap or other process structures could be located).
8. The user process parameters are written into the process, copied, and fixed up (meaning converted from absolute form to a relative form so that a single memory block is needed).
9. The affinity information is written into the PEB.
10.The MinWin API redirection set is mapped into the process.
NOTE
POSIX processes clone the address space of their parents, so they don’t have to go through these steps to create a new address space. In the case of POSIX applications, the new process’ section base address is set to that of its parent process and the parent’s PEB is cloned for the new process.
Stage 3E: Setting Up the PEB
NtCreateUserProcess calls MmCreatePeb, which first maps the systemwide national language support (NLS) tables into the process’ address space. It next calls MiCreatePebOrTeb to allocate a page for the PEB and then initializes a number of fields, most of them based on internal variables that were configured through the registry, such as MmHeap* values, MmCriticalSectionTimeout, and MmMinimumStackCommitInBytes. Some of these fields can be overridden by settings in the linked executable image, such as the Windows version in the PE header or the affinity mask in the load configuration directory of the PE header.
If the image header characteristics IMAGE_FILE_UP_SYSTEM_ONLY flag is set (indicating that the image can run only on a uniprocessor system), a single CPU (MmRotatingUniprocessorNumber) is chosen for all the threads in this new process to run on. The selection process is performed by simply cycling through the available processors—each time this type of image is run, the next processor is used. In this way, these types of images are spread evenly across the processors.
Stage 3F: Completing the Setup of the Executive Process Object (PspInsertProcess)
Before the handle to the new process can be returned, a few final setup steps must be completed, which are performed by PspInsertProcess and its helper functions:
1. If systemwide auditing of processes is enabled (either as a result of local policy settings or group policy settings from a domain controller), the process’ creation is written to the Security event log.
2. If the parent process was contained in a job, the job is recovered from the job level set of the parent and then bound to the session of the newly created process. Finally, the new process is added to the job.
3. PspInsertProcess inserts the new process object at the end of the Windows list of active processes (PsActiveProcessHead).
4. The process debug port of the parent process is copied to the new child process, unless the NoDebugInherit flag is set (which can be requested when creating the process). If a debug port was specified, it is attached to the new process at this time.
5. Because job objects can now specify restrictions on which group or groups the threads within the processes part of a job can run on, PspInsertProcess must make sure that the group affinity associated with the process would not violate the group affinity associated with the job. An interesting secondary issue to consider is if the job’s permissions grant access to modify the process’ affinity permissions, because a lesser-privileged job object might interfere with the affinity requirements of a more privileged process.
6. Finally, PspInsertProcess creates a handle for the new process by calling ObOpenObjectByPointer, and then returns this handle to the caller. Note that no process creation callback is sent until the first thread within the process is created, and the code always sends process callbacks before sending object-managed based callbacks.
Stage 4: Creating the Initial Thread and Its Stack and Context
At this point, the Windows executive process object is completely set up. It still has no thread, however, so it can’t do anything yet. It’s now time to start that work. Normally, the PspCreateThread routine is responsible for all aspects of thread creation and is called by NtCreateThreadwhen a new thread is being created. However, because the initial thread is created internally by the kernel without user-mode input, the two helper routines that PspCreateThread relies on are used instead: PspAllocateThread and PspInsertThread.
PspAllocateThread handles the actual creation and initialization of the executive thread object itself, while PspInsertThread handles the creation of the thread handle and security attributes and the call to KeStartThread to turn the executive object into a schedulable thread on the system. However, the thread won’t do anything yet—it is created in a suspended state and isn’t resumed until the process is completely initialized (as described in Stage 5).
NOTE
The thread parameter (which can’t be specified in CreateProcess but can be specified in CreateThread) is the address of the PEB. This parameter will be used by the initialization code that runs in the context of this new thread (as described in Stage 6).
PspAllocateThread performs the following steps:
1. It prevents user-mode scheduling (UMS) threads from being created in Wow64 processes, as well as preventing user-mode callers from creating threads in the system process.
2. An executive thread object is created and initialized.
3. If CPU rate limiting is enabled, the CPU quota block is initialized.
4. The various lists used by LPC, I/O Management, and the Executive are initialized.
5. The thread’s create time is set, and its thread ID (TID) is created.
6. Before the thread can execute, it needs a stack and a context in which to run, so these are set up. The stack size for the initial thread is taken from the image—there’s no way to specify another size. If this is a Wow64 process, the Wow64 thread context will also be initialized.
7. The thread environment block (TEB) is allocated for the new thread.
8. The user-mode thread start address is stored in the ETHREAD. This is the system-supplied thread startup function in Ntdll.dll (RtlUserThreadStart). The user’s specified Windows start address is stored in the ETHREAD in a different location so that debugging tools such as Process Explorer can query the information.
9. KeInitThread is called to set up the KTHREAD structure. The thread’s initial and current base priorities are set to the process’ base priority, and its affinity and quantum are set to that of the process. This function also sets the initial thread ideal processor. (See the section Ideal and Last Processor for a description of how this is chosen.) KeInitThread next allocates a kernel stack for the thread and initializes the machine-dependent hardware context for the thread, including the context, trap, and exception frames. The thread’s context is set up so that the thread will start in kernel mode in KiThreadStartup. Finally, KeInitThread sets the thread’s state to Initialized and returns to PspAllocateThread.
10.If this is a UMS thread, PspUmsInitThread is called to initialize the UMS state.
Once that work is finished, NtCreateUserProcess calls PspInsertThread to perform the following steps:
1. A check is made to ensure that the thread’s group affinity does not violate job limitations (which we already described earlier). In the process create path, this check is skipped because it was already done at the earlier stage.
2. Checks are made to ensure that the process hasn’t already been terminated, that the thread hasn’t already been terminated, or that the thread hasn’t even been able to start running. If any of these cases are true, thread creation will fail.
3. The KTHREAD part of the thread object is initialized by calling KeStartThread. This involves inheriting scheduler settings from the owner process, setting the ideal node and processor, updating the group affinity, and inserting the thread in the process list maintained by KPROCESS (a separate list from the one in EPROCESS). Additionally, on x64 systems, another systemwide list of processes, KiProcessListHead, is used by PatchGuard to maintain the integrity of the executive’s PsActiveProcessHead. Finally, the stack count of the process is incremented.
4. The thread count in the process object is incremented, and the owner process’ I/O priority and page priority are inherited. If this is the highest number of threads the process has ever had, the thread count high watermark is updated as well. If this was the second thread in the process, the primary token is frozen (that is, it can no longer be changed, unless the process is a POSIX subsystem process).
5. If the thread is a UMS thread, the count of UMS threads is incremented.
6. The thread is inserted in the process’ thread list, and the thread is suspended if the creating process requested it.
7. If CPU rate limiting is enabled, the rate control APC is initialized and the CpuThrottled bit is set in the KTHREAD.
8. The object is inserted, and any registered thread callbacks are called. If this was the first thread in the process (and therefore, the operation happened as part of the CreateProcess path), the registered kernel process callbacks are also called.
9. The handle is created with ObOpenObjectByPointer.
10.The thread is readied for execution by calling KeReadyThread. It enters the deferred ready queue, the process is paged out, and a page in is requested.
Stage 5: Performing Windows Subsystem–Specific Post-Initialization
Once NtCreateUserProcess returns with a success code, all the necessary executive process and thread objects have been created. Kernel32.dll then performs various operations related to Windows subsystem–specific operations to finish initializing the process.
First of all, various checks are made for whether Windows should allow the executable to run. These checks include validating the image version in the header and checking whether Windows application certification has blocked the process (through a group policy). On specialized editions of Windows Server 2008 R2, such as Windows Web Server 2008 R2 and Windows HPC Server 2008 R2, additional checks are made to see whether the application imports any disallowed APIs.
If software restriction policies dictate, a restricted token is created for the new process. Afterward, the application-compatibility database is queried to see whether an entry exists in either the registry or system application database for the process. Compatibility shims will not be applied at this point—the information will be stored in the PEB once the initial thread starts executing (Stage 6).
At this point, Kernel32.dll sends a message to the Windows subsystem so that it can set up SxS information (see the end of this section for more information on side-by-side assemblies) such as manifest files, DLL redirection paths, and out-of-process execution for the new process. It also initializes the Windows subsystem structures for the process and initial thread. The message includes the following information:
§ Process and thread handles
§ Entries in the creation flags
§ ID of the process’ creator
§ Flag indicating whether the process belongs to a Windows application (so that Csrss can determine whether or not to show the startup cursor)
§ UI language information
§ DLL redirection and .local flags
§ Manifest file information
The Windows subsystem performs the following steps when it receives this message:
1. CsrCreateProcess duplicates a handle for the process and thread. In this step, the usage count of the process and the thread is incremented from 1 (which was set at creation time) to 2.
2. If a process priority class isn’t specified, CsrCreateProcess sets it according to the algorithm described earlier in this section.
3. The Csrss process structure (CSR_PROCESS) is allocated.
4. The new process’ exception port is set to be the general function port for the Windows subsystem so that the Windows subsystem will receive a message when a second-chance exception occurs in the process. (For further information on exception handling, see Chapter 3.)
5. The Csrss thread structure (CSR_THREAD) is allocated and initialized.
6. CsrCreateThread inserts the thread in the list of threads for the process.
7. The count of processes in this session is incremented.
8. The process shutdown level is set to 0x280 (the default process shutdown level—see SetProcessShutdownParameters in the MSDN Library documentation for more information).
9. The new Csrss process structure is inserted into the list of Windows subsystem-wide processes.
10.The per-process data structure used by the kernel-mode part of the Windows subsystem (W32PROCESS) is allocated and initialized.
11.The application start cursor is displayed. This cursor is the familiar rolling doughnut shape—the way that Windows says to the user, “I’m starting something, but you can use the cursor in the meantime.” If the process doesn’t make a GUI call after two seconds, the cursor reverts to the standard pointer. If the process does make a GUI call in the allotted time, CsrCreateProcess waits five seconds for the application to show a window. After that time, CsrCreateProcess resets the cursor again.
After Csrss has performed these steps, CreateProcess checks whether the process was run elevated (which means it was executed through ShellExecute and elevated by the AppInfo service after the consent dialog box was shown to the user). This includes checking whether the process was a setup program. If it was, the process’ token is opened, and the virtualization flag is turned on so that the application is virtualized. (See the information on UAC and virtualization in Chapter 6.) If the application contained elevation shims or had a requested elevation level in its manifest, the process is destroyed and an elevation request is sent to the AppInfo service. (See Chapter 6 for more information on elevation.)
Note that most of these checks are not performed for protected processes; because these processes must have been designed for Windows Vista or later, there’s no reason why they should require elevation, virtualization, or application-compatibility checks and processing. Additionally, allowing mechanisms such as the shim engine to use its usual hooking and memory-patching techniques on a protected process would result in a security hole if someone could figure how to insert arbitrary shims that modify the behavior of the protected process. Additionally, because the Shim Engine is installed by the parent process, which might not have access to its child protected process, even legitimate shimming cannot work.
Stage 6: Starting Execution of the Initial Thread
At this point, the process environment has been determined, resources for its threads to use have been allocated, the process has a thread, and the Windows subsystem knows about the new process. Unless the caller specified the CREATE_ SUSPENDED flag, the initial thread is now resumed so that it can start running and perform the remainder of the process initialization work that occurs in the context of the new process (Stage 7).
Stage 7: Performing Process Initialization in the Context of the New Process
The new thread begins life running the kernel-mode thread startup routine KiThreadStartup. KiThreadStartup lowers the thread’s IRQL level from deferred procedure call (DPC)/dispatch level to APC level and then calls the system initial thread routine, PspUserThreadStartup. The user-specified thread start address is passed as a parameter to this routine.
First, this function disables the ability to swap the primary process token at runtime, which is reserved for POSIX support only (to emulate setuid behavior). It then sets the Locale ID and the ideal processor in the TEB, based on the information present in kernel-mode data structures, and then it checks whether thread creation actually failed. Next it calls DbgkCreateThread, which checks whether image notifications were sent for the new process. If they weren’t, and notifications are enabled, an image notification is sent first for the process and then for the image load of Ntdll.dll. Note that this is done in this stage rather than when the images were first mapped because the process ID (which is required for the kernel callouts) is not yet allocated at that time.
Once those checks are completed, another check is performed to see whether the process is a debuggee. If it is, PspUserThreadStartup checks whether the debugger notifications have already been sent for this process. If not, a create process message is sent through the debug object (if one is present) so that the process startup debug event (CREATE_PROCESS_DEBUG_INFO) can be sent to the appropriate debugger process. This is followed by a similar thread startup debug event and by another debug event for the image load of Ntdll.dll. DbgkCreateThreadthen waits for a reply from the debugger (via the ContinueDebugEvent function).
Now that the debugger has been notified, PspUserThreadStartup looks at the result of the initial check on the thread’s life. If it was killed on startup, the thread is terminated. This check is done after the debugger and image notifications to be sure that the kernel-mode and user-mode debuggers don’t miss information on the thread, even if the thread never got a chance to run.
Otherwise, the routine checks whether application prefetching is enabled on the system and, if so, calls the prefetcher (and Superfetch) to process the prefetch instruction file (if it exists) and prefetch pages referenced during the first 10 seconds the last time the process ran. (For details on the prefetcher and Superfetch, see Chapter 10 in Part 2.)
PspUserThreadStartup then checks whether the systemwide cookie in the SharedUserData structure has been set up yet. If it hasn’t, it generates it based on a hash of system information such as the number of interrupts processed, DPC deliveries, and page faults. This systemwide cookie is used in the internal decoding and encoding of pointers, such as in the heap manager to protect against certain classes of exploitation. (For more information on heap manager security, see Chapter 10 in Part 2.)
Finally, PspUserThreadStartup sets up the initial thunk context to run the image-loader initialization routine (LdrInitializeThunk in Ntdll.dll), as well as the systemwide thread startup stub (RtlUserThreadStart in Ntdll.dll). These steps are done by editing the context of the thread in place and then issuing an exit from system service operation, which loads the specially crafted user context. The LdrInitializeThunk routine initializes the loader, the heap manager, NLS tables, thread-local storage (TLS) and fiber-local storage (FLS) arrays, and critical section structures. It then loads any required DLLs and calls the DLL entry points with the DLL_PROCESS_ ATTACH function code.
Once the function returns, NtContinue restores the new user context and returns to user mode—thread execution now truly starts.
RtlUserThreadStart uses the address of the actual image entry point and the start parameter and calls the application’s entrypoint. These two parameters have also already been pushed onto the stack by the kernel. This complicated series of events has two purposes. First, it allows the image loader inside Ntdll.dll to set up the process internally and behind the scenes so that other user-mode code can run properly. (Otherwise, it would have no heap, no thread-local storage, and so on.)
Second, having all threads begin in a common routine allows them to be wrapped in exception handling so that when they crash, Ntdll.dll is aware of that and can call the unhandled exception filter inside Kernel32.dll. It is also able to coordinate thread exit on return from the thread’s start routine and to perform various cleanup work. Application developers can also call SetUnhandledExceptionFilter to add their own unhandled exception-handling code.
EXPERIMENT: TRACING PROCESS STARTUP
Now that we’ve looked in detail at how a process starts up and the different operations required to begin executing an application, we’re going to use Process Monitor to look at some of the file I/O and registry keys that are accessed during this process.
Although this experiment will not provide a complete picture of all the internal steps we’ve described, you’ll be able to see several parts of the system in action, notably prefetch and Superfetch, image-file execution options and other compatibility checks, and the image loader’s DLL mapping.
We’ll look at a very simple executable—Notepad.exe—and launch it from a Command Prompt window (Cmd.exe). It’s important that we look both at the operations inside Cmd.exe and those inside Notepad.exe. Recall that a lot of the user-mode work is performed by CreateProcess, which is called by the parent process before the kernel has created a new process object.
To set things up correctly, add two filters to Process Monitor: one for Cmd.exe, and one for Notepad.exe—these are the only two processes you should include. Be sure that you don’t have any currently running instances of these two processes so that you know you’re looking at the right events. The filter window should look like this:
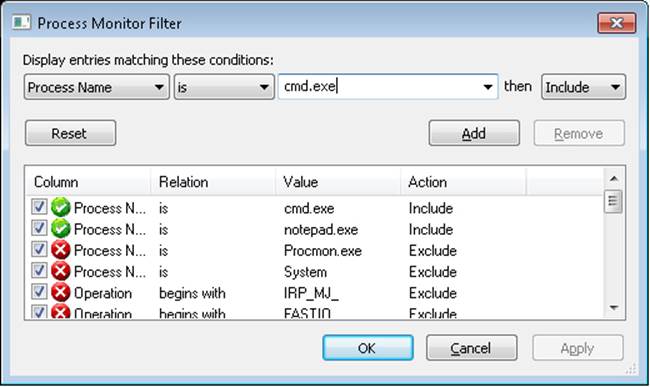
Next, make sure that event logging is currently disabled (clear File, Capture Events), and then start up the command prompt. Enable event logging (using the File menu again, or simply press CTRL+E or click the magnifying glass icon on the toolbar), and then type Notepad.exe and press Enter. On a typical Windows system, you should see anywhere between 500 and 1500 events appear. Hide the Sequence and Time Of Day columns so that you can focus your attention on the columns of interest. Your window should look similar to the one shown next.
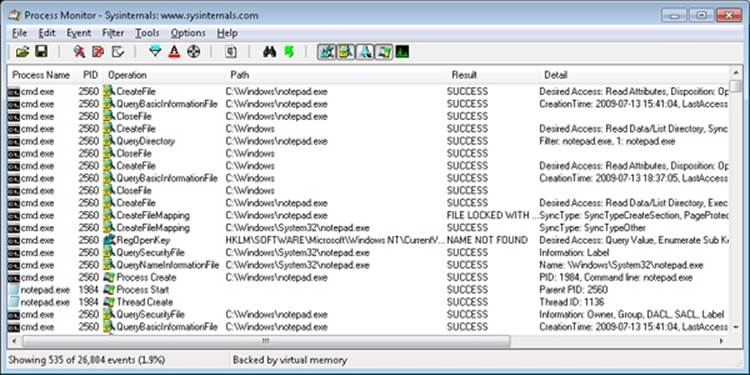
Just as described in Stage 1 of the CreateProcess flow, one of the first things to notice is that just before the process is started and the first thread is created, Cmd.exe does a registry read at HKLM\SOFTWARE\Microsoft\Windows NT\CurrentVersion\Image File Execution Options. Because there were no image-execution options associated with Notepad.exe, the process was created as is.
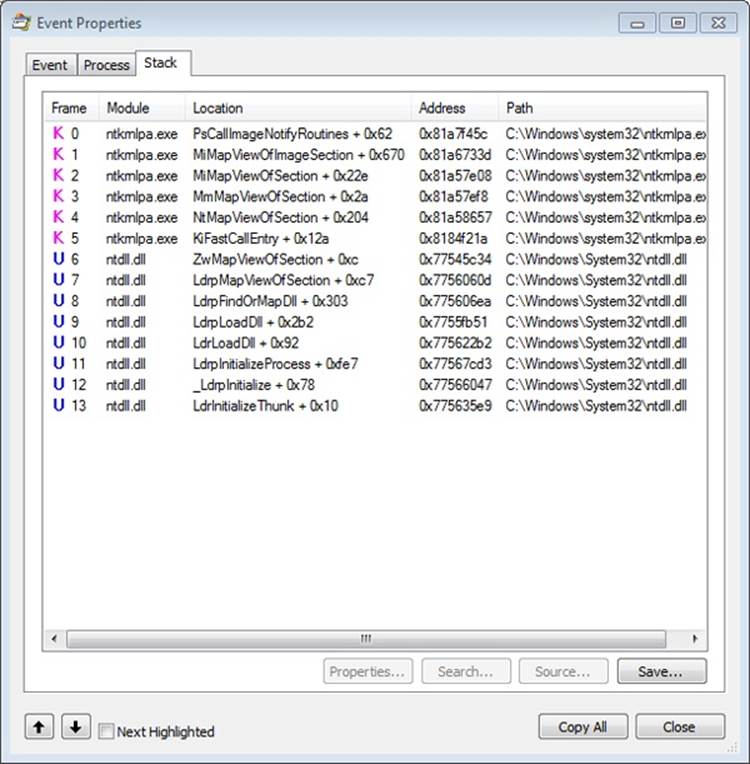
As with this and any other event in Process Monitor’s log, you have the ability to see whether each part of the process creation flow was performed in user mode or kernel mode, and by which routines, by looking at the stack of the event. To do this, double-click on the RegOpenKey event and switch to the Stack tab. The following screen shows the standard stack on a 32-bit Windows machine.
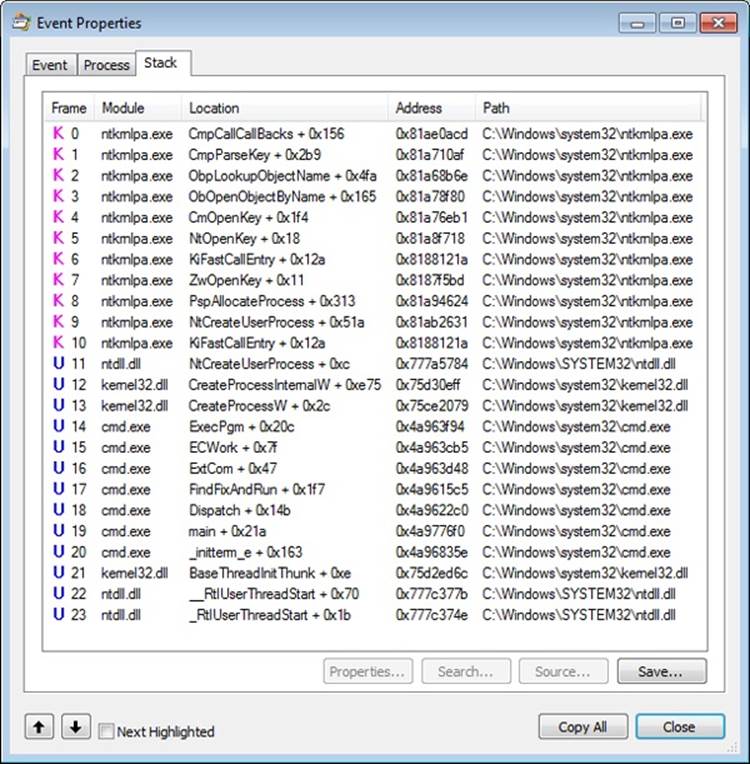
This stack shows that you already reached the part of process creation performed in kernel mode (through NtCreateUserProcess) and that the helper routine PspAllocateProcess is responsible for this check.
Going down the list of events after the thread and process have been created, you will notice three groups of events. The first is a simple check for application-compatibility flags, which will let the user-mode process creation code know if checks inside the application-compatibility database are required through the shim engine.
This check is followed by multiple reads to Side-By-Side, Manifest, and MUI/Language keys, which are part of the assembly framework mentioned earlier. Finally, you might see file I/O to one or more .sdb files, which are the application-compatibility databases on the system. This I/O is where additional checks are done to see if the shim engine needs to be invoked for this application. Because Notepad is a well-behaved Microsoft program, it doesn’t require any shims.
The following screen shows the next series of events, which happen inside the Notepad process itself. These are actions initiated by the user-mode thread startup wrapper in kernel mode, which performs the actions described earlier. The first two are the Notepad.exe and Ntdll.dll image load debug notification messages, which can be generated only now that code is running inside Notepad’s process context and not the context for the command prompt.
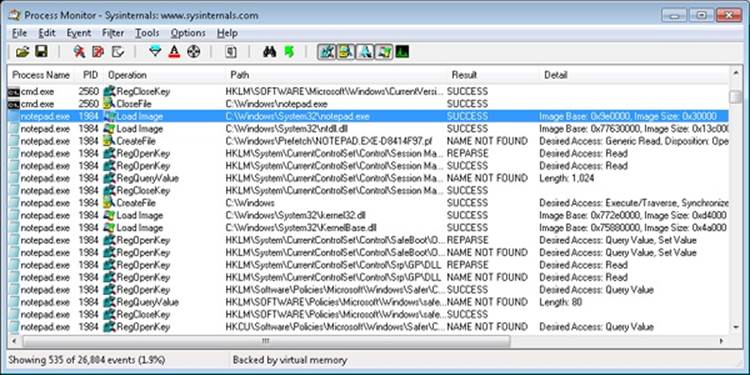
Next, the prefetcher kicks in, looking for a prefetch database file that has already been generated for Notepad. (For more information on the prefetcher, see Chapter 10 in Part 2.) On a system where Notepad has already been run at least once, this database will exist, and the prefetcher will begin executing the commands specified inside it. If this is the case, scrolling down you will see multiple DLLs being read and queried. Unlike typical DLL loading, which is done by the user-mode image loader by looking at the import tables or when an application manually loads a DLL, these events are being generated by the prefetcher, which is already aware of the libraries that Notepad will require. Typical image loading of the DLLs required happens next, and you will see events similar to the ones shown here:
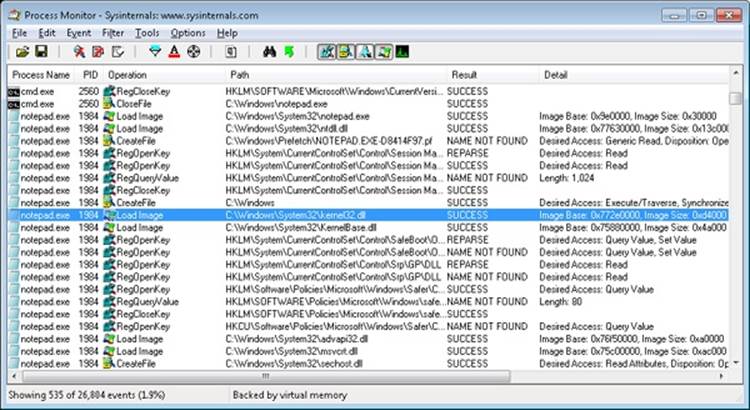
These events are now being generated from code running inside user mode, which was called once the kernel-mode wrapper function finished its work. Therefore, these are the first events coming from LdrpInitializeProcess, which we mentioned is the internal system wrapper function for any new process, before the start address wrapper is called. You can confirm this on your own by looking at the stack of these events—for example, the kernel32.dll image load event, which is shown in the next screen:
Further events are generated by this routine and its associated helper functions until you finally reach events generated by the WinMain function inside Notepad, which is where code under the developer’s control is now being executed. Describing in detail all the events and user-mode components that come into play during process execution would fill up this entire chapter, so exploration of any further events is left as an exercise for the reader.
Thread Internals
Now that we’ve dissected processes, let’s turn our attention to the structure of a thread. Unless explicitly stated otherwise, you can assume that anything in this section applies to both user-mode threads and kernel-mode system threads (which are described in Chapter 2).
Data Structures
At the operating-system level, a Windows thread is represented by an executive thread object. The executive thread object encapsulates an ETHREAD structure, which in turn contains a KTHREAD structure as its first member. These are illustrated in Figure 5-8. The ETHREAD structure and the other structures it points to exist in the system address space, with the exception of the thread environment block (TEB), which exists in the process address space (again, because user-mode components need to access it).
The Windows subsystem process (Csrss) maintains a parallel structure for each thread created in a Windows subsystem application, called the CSR_THREAD. For threads that have called a Windows subsystem USER or GDI function, the kernel-mode portion of the Windows subsystem (Win32k.sys) maintains a per-thread data structure (called the W32THREAD) that the KTHREAD structure points to.
NOTE
The fact that the executive, high-level, graphics-related, Win32k thread structure is pointed to by the KTHREAD, instead of the ETHREAD, appears to be a layer violation or oversight in the standard kernel’s abstraction architecture—the scheduler and other low-level components do not use this field.
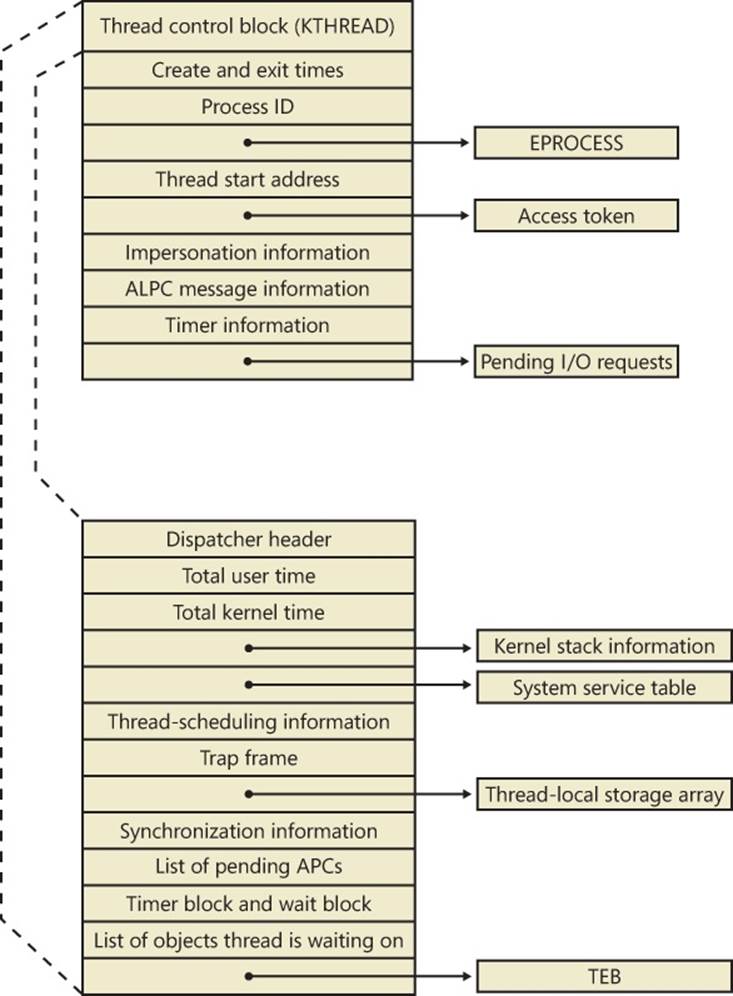
Figure 5-8. Important fields of the executive thread structure and its embedded kernel thread structure
Most of the fields illustrated in Figure 5-8 are self-explanatory. The first member of the ETHREAD is called the Tcb, for “Thread control block”; this is a structure of type KTHREAD. Following that are the thread identification information, the process identification information (including a pointer to the owning process so that its environment information can be accessed), security information in the form of a pointer to the access token and impersonation information, and finally, fields relating to Asynchronous Local Procedure Call (ALPC) messages and pending I/O requests. Some of these key fields are covered in more detail elsewhere in this book. For more details on the internal structure of an ETHREAD structure, you can use the kernel debugger dt command to display its format.
Let’s take a closer look at two of the key thread data structures referred to in the preceding text: the KTHREAD and the TEB. The KTHREAD structure (which is the Tcb member of the ETHREAD) contains information that the Windows kernel needs to perform thread scheduling, synchronization, and timekeeping functions.
EXPERIMENT: DISPLAYING ETHREAD AND KTHREAD STRUCTURES
The ETHREAD and KTHREAD structures can be displayed with the dt command in the kernel debugger. The following output shows the format of an ETHREAD on a 32-bit system:
lkd> dt nt!_ethread
nt!_ETHREAD
+0x000 Tcb : _KTHREAD
+0x1e0 CreateTime : _LARGE_INTEGER
+0x1e8 ExitTime : _LARGE_INTEGER
+0x1e8 KeyedWaitChain : _LIST_ENTRY
+0x1f0 ExitStatus : Int4B
...
+0x270 AlpcMessageId : Uint4B
+0x274 AlpcMessage : Ptr32 Void
+0x274 AlpcReceiveAttributeSet : Uint4B
+0x278 AlpcWaitListEntry : _LIST_ENTRY
+0x280 CacheManagerCount : Uint4B
The KTHREAD can be displayed with a similar command or by typing dt nt!_ETHREAD Tcb, as was shown in the EPROCESS/KPROCESS experiment earlier:
lkd> dt nt!_kthread
nt!_KTHREAD
+0x000 Header : _DISPATCHER_HEADER
+0x010 CycleTime : Uint8B
+0x018 HighCycleTime : Uint4B
+0x020 QuantumTarget : Uint8B
...
+0x05e WaitIrql : UChar
+0x05f WaitMode : Char
+0x060 WaitStatus : Int4B
EXPERIMENT: USING THE KERNEL DEBUGGER !THREAD COMMAND
The kernel debugger !thread command dumps a subset of the information in the thread data structures. Some key elements of the information the kernel debugger displays can’t be displayed by any utility, including the following information: internal structure addresses; priority details; stack information; the pending I/O request list; and, for threads in a wait state, the list of objects the thread is waiting for.
To display thread information, use either the !process command (which displays all the threads of a process after displaying the process information) or the !thread command with the address of a thread object to display a specific thread.
EXPERIMENT: VIEWING THREAD INFORMATION
The following output is the detailed display of a process produced by using the Tlist utility in the Debugging Tools for Windows. Notice that the thread list shows Win32StartAddr. This is the address passed to the CreateThread function by the application. All the other utilities, except Process Explorer, that show the thread start address show the actual start address (a function in Ntdll.dll), not the application-specified start address.
C:\Program Files\Windows Kits\8.0\Debuggers\x86>tlist winword
3232 WINWORD.EXE 648739_Chap05.docx - Microsoft Word
CWD: C:\Users\Alex Ionescu\Documents\
CmdLine: "C:\Program Files\Microsoft Office\Office14\WINWORD.EXE" /n "C:\Users\Alex
Ionescu\Documents\Chapter5.docx
VirtualSize: 531024 KB PeakVirtualSize: 585248 KB
WorkingSetSize:122484 KB PeakWorkingSetSize:181532 KB
NumberOfThreads: 12
2104 Win32StartAddr:0x2fde10ec LastErr:0x00000000 State:Waiting
2992 Win32StartAddr:0x7778fd0d LastErr:0x00000000 State:Waiting
3556 Win32StartAddr:0x3877e970 LastErr:0x00000000 State:Waiting
2436 Win32StartAddr:0x3877e875 LastErr:0x00000000 State:Waiting
3136 Win32StartAddr:0x3877e875 LastErr:0x00000000 State:Waiting
3412 Win32StartAddr:0x3877e875 LastErr:0x00000000 State:Waiting
1096 Win32StartAddr:0x3877e875 LastErr:0x00000000 State:Waiting
912 Win32StartAddr:0x74497832 LastErr:0x00000000 State:Waiting
1044 Win32StartAddr:0x389b0926 LastErr:0x00000583 State:Waiting
1972 Win32StartAddr:0x694532fb LastErr:0x00000000 State:Waiting
4056 Win32StartAddr:0x75f9c83e LastErr:0x00000000 State:Waiting
1124 Win32StartAddr:0x777903e9 LastErr:0x00000000 State:Waiting
14.0.5123.5000 shp 0x2FDE0000 C:\Program Files\Microsoft Office\Office14\WINWORD.EXE
6.1.7601.17725 shp 0x77760000 C:\Windows\SYSTEM32\ntdll.dll
6.1.7601.17651 shp 0x75CE0000 C:\Windows\system32\kernel32.dll
The TEB, illustrated in Figure 5-9, is one of the data structures explained in this section that exists in the process address space (as opposed to the system space). Internally, it is made up of a header called the TIB (Thread Information Block), which mainly existed for compatibility with OS/2 and Win9x applications. It also allows exception and stack information to be kept into a smaller structure when creating new threads by using an Initial TIB.
The TEB stores context information for the image loader and various Windows DLLs. Because these components run in user mode, they need a data structure writable from user mode. That’s why this structure exists in the process address space instead of in the system space, where it would be writable only from kernel mode. You can find the address of the TEB with the kernel debugger !thread command.
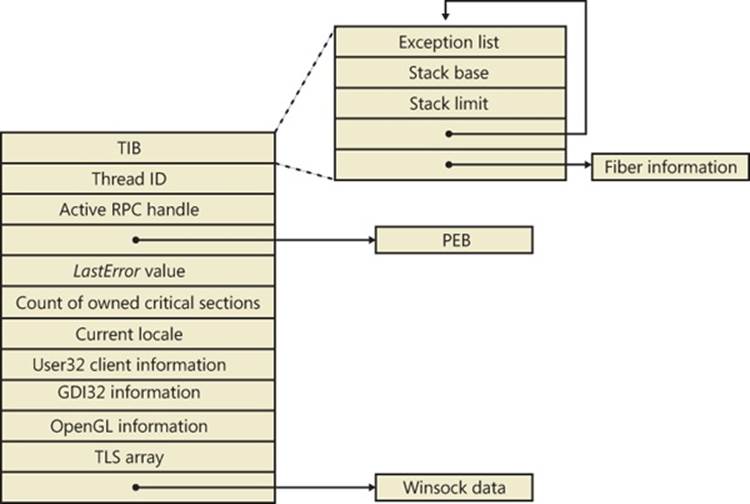
Figure 5-9. Fields of the thread environment block
EXPERIMENT: EXAMINING THE TEB
You can dump the TEB structure with the !teb command in the kernel debugger. The output looks like this:
kd> !teb
TEB at 7ffde000
ExceptionList: 019e8e44
StackBase: 019f0000
StackLimit: 019db000
SubSystemTib: 00000000
FiberData: 00001e00
...
PEB Address: 7ffd9000
LastErrorValue: 0
LastStatusValue: c0000139
Count Owned Locks: 0
HardErrorMode: 0
The CSR_THREAD, illustrated in Figure 5-10 is analogous to the data structure of CSR_PROCESS, but it’s applied to threads. As you might recall, this is maintained by each Csrss process within a session and identifies the Windows subsystem threads running within it. The CSR_THREAD stores a handle that Csrss keeps for the thread, various flags, and a pointer to the CSR_PROCESS for the thread. It also stores another copy of the thread’s creation time.
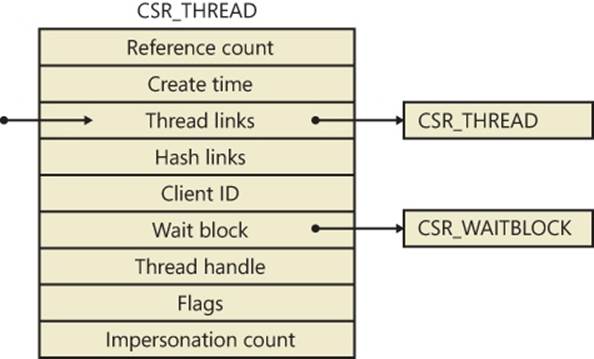
Figure 5-10. Fields of the CSR thread
EXPERIMENT: EXAMINING THE CSR_THREAD
You can dump the CSR_THREAD structure with the !dt command in the user-mode debugger while attached to a Csrss process. Follow the instructions in the CSR_PROCESS experiment from earlier to safely perform this operation. The output looks like this:
0:000> !dt v 001c7630
PCSR_THREAD @ 001c7630:
+0x000 CreateTime : _LARGE_INTEGER 0x1cb9fb6'00f90498
+0x008 Link : _LIST_ENTRY [ 0x1c0ab0 - 0x1c0f00 ]
+0x010 HashLinks : _LIST_ENTRY [ 0x75f19b38 - 0x75f19b38 ]
+0x018 ClientId : _CLIENT_ID
+0x020 Process : 0x001c0aa0 _CSR_PROCESS
+0x024 ThreadHandle : 0x000005c4
+0x028 Flags : 0
+0x02c ReferenceCount : 1
+0x030 ImpersonateCount : 0
Finally, the W32THREAD structure, illustrated in Figure 5-11, is analogous to the data structure of WIN32PROCESS, but it’s applied to threads This structure mainly contains information useful for the GDI subsystem (brushes and DC attributes) as well as for the User Mode Print Driver framework (UMPD) that vendors use to write user-mode printer drivers. Finally, it contains a rendering state useful for desktop compositing and anti-aliasing.
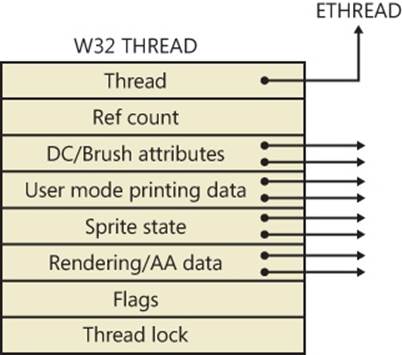
Figure 5-11. Fields of the Win32k thread
EXPERIMENT: EXAMINING THE W32THREAD
You can dump the W32THREAD structure by looking at the output of the !thread command, which gives a pointer to it in the Win32Thread output field. Alternatively, if you use the dt command, the KTHREAD block has a field called Win32Thread that contains the pointer to this structure. Recall that only a GUI thread will have a W32THREAD structure, so it’s possible that certain threads, such as background or worker threads, will not have an associated W32THREAD. Because there is no extension to view a W32THREAD, you need to use the dt command, as shown here:
dt win32k!_w32thread ffb79dd8
+0x000 pEThread : 0x83ad4b60 _ETHREAD
+0x004 RefCount : 1
+0x008 ptlW32 : (null)
+0x00c pgdiDcattr : 0x00130740
+0x010 pgdiBrushAttr : (null)
+0x014 pUMPDObjs : (null)
+0x018 pUMPDHeap : (null)
+0x01c pUMPDObj : (null)
...
+0x0a8 bEnableEngUpdateDeviceSurface : 0 ''
+0x0a9 bIncludeSprites : 0 ''
+0x0ac ulWindowSystemRendering : 0
Birth of a Thread
A thread’s life cycle starts when a program creates a new thread. The request filters down to the Windows executive, where the process manager allocates space for a thread object and calls the kernel to initialize the thread control block (KTHREAD). The steps in the following list are taken inside the Windows CreateThread function in Kernel32.dll to create a Windows thread:
1. CreateThread converts the Windows API parameters to native flags and builds a native structure describing object parameters (OBJECT_ATTRIBUTES). See Chapter 3 for more information.
2. CreateThread builds an attribute list with two entries: client ID and TEB address. This allows CreateThread to receive those values once the thread has been created. (For more information on attribute lists, see the section Flow of CreateProcess earlier in this chapter.)
3. NtCreateThreadEx is called to create the user-mode context and probe and capture the attribute list. It then calls PspCreateThread to create a suspended executive thread object. For a description of the steps performed by this function, see the descriptions of Stage 3 and Stage 5 in the section Flow of CreateProcess.
4. CreateThread allocates an activation context for the thread used by side-by-side assembly support. It then queries the activation stack to see if it requires activation, and it does so if needed. The activation stack pointer is saved in the new thread’s TEB.
5. CreateThread notifies the Windows subsystem about the new thread, and the subsystem does some setup work for the new thread.
6. The thread handle and the thread ID (generated during step 3) are returned to the caller.
7. Unless the caller created the thread with the CREATE_SUSPENDED flag set, the thread is now resumed so that it can be scheduled for execution. When the thread starts running, it executes the steps described in the earlier section Stage 7: Performing Process Initialization in the Context of the New Process before calling the actual user’s specified start address.
Examining Thread Activity
Examining thread activity is especially important if you are trying to determine why a process that is hosting multiple services is running (such as Svchost.exe, Dllhost.exe, or Lsass.exe) or why a process is hung.
There are several tools that expose various elements of the state of Windows threads: WinDbg (in user-process attach and kernel-debugging mode), Performance Monitor, and Process Explorer. (The tools that show thread-scheduling information are listed in the section Thread Scheduling.)
To view the threads in a process with Process Explorer, select a process and open the process properties (by double-clicking on the process or clicking on the Process, Properties menu item). Then click on the Threads tab. This tab shows a list of the threads in the process and four columns of information. For each thread, it shows its ID, the percentage of CPU consumed (based on the refresh interval configured), the number of cycles charged to the thread, and the thread start address. You can sort by any of these four columns.
New threads that are created are highlighted in green, and threads that exit are highlighted in red. (The highlight duration can be configured with the Options, Difference Highlight Duration menu item.) This might be helpful to discover unnecessary thread creation occurring in a process. (In general, threads should be created at process startup, not every time a request is processed inside a process.)
As you select each thread in the list, Process Explorer displays the thread ID, start time, state, CPU time counters, number of cycles charged, number of context switches, the ideal processor and its group, and the base and current priority. There is a Kill button, which will terminate an individual thread, but this should be used with extreme care. Another option is the Suspend button, which will prevent the thread from forward execution and thus prevent a runaway thread from consuming CPU time. However, this can also lead to deadlocks and should be used with the same care as the Kill button. Finally, the Permissions button allows you to view the security descriptor. (See Chapter 6, for more information on security descriptors) of the thread.
Unlike Task Manager and all other process/processor monitoring tools, Process Explorer uses the clock cycle counter designed for thread run-time accounting (as described later in this chapter), instead of the clock interval timer, so you will see a significantly different view of CPU consumption using Process Explorer. This is because many threads run for such a short amount of time that they are seldom (if ever) the currently running thread when the clock interval timer interrupt occurs, so they are not charged for much of their CPU time, leading clock-based tools to perceive a CPU usage of 0%. On the other hand, the total number of clock cycles represents the actual number of processor cycles that each thread in the process accrued. It is independent of the clock interval timer’s resolution because the count is maintained internally by the processor at each cycle and updated by Windows at each interrupt entry. (A final accumulation is done before a context switch.)
The thread start address is displayed in the form “module!function”, where module is the name of the .exe or .dll. The function name relies on access to symbol files for the module. (See EXPERIMENT: Viewing Process Details with Process Explorer in Chapter 1.) If you are unsure what the module is, click the Module button. This opens an Explorer file properties window for the module containing the thread’s start address (for example, the .exe or .dll).
NOTE
For threads created by the Windows CreateThread function, Process Explorer displays the function passed to CreateThread, not the actual thread start function. That is because all Windows threads start at a common thread startup wrapper function (RtlUserThreadStart in Ntdll.dll). If Process Explorer showed the actual start address, most threads in processes would appear to have started at the same address, which would not be helpful in trying to understand what code the thread was executing. However, if Process Explorer can’t query the user-defined startup address (such as in the case of a protected process), it will show the wrapper function, so you will see all threads starting at RtlUserThreadStart.
However, the thread start address displayed might not be enough information to pinpoint what the thread is doing and which component within the process is responsible for the CPU consumed by the thread. This is especially true if the thread start address is a generic startup function (for example, if the function name does not indicate what the thread is actually doing). In this case, examining the thread stack might answer the question. To view the stack for a thread, double-click on the thread of interest (or select it and click the Stack button). Process Explorer displays the thread’s stack (both user and kernel, if the thread was in kernel mode).
NOTE
While the user mode debuggers (WinDbg, Ntsd, and Cdb) permit you to attach to a process and display the user stack for a thread, Process Explorer shows both the user and kernel stack in one easy click of a button. You can also examine user and kernel thread stacks using WinDbg in local kernel debugging mode.
Viewing the thread stack can also help you determine why a process is hung. As an example, on one system, Microsoft Office PowerPoint was hanging for one minute on startup. To determine why it was hung, after PowerPoint was started, Process Explorer was used to examine the thread stack of the one thread in the process. The result is shown in Figure 5-12.
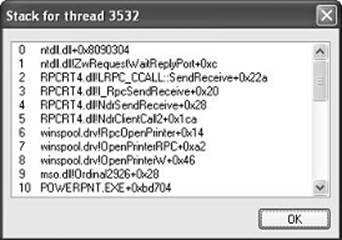
Figure 5-12. Hung thread stack in PowerPoint
This thread stack shows that PowerPoint (line 10) called a function in Mso.dll (the central Microsoft Office DLL), which called the OpenPrinterW function in Winspool.drv (a DLL used to connect to printers). Winspool.drv then dispatched to a function OpenPrinterRPC, which then called a function in the RPC runtime DLL, indicating it was sending the request to a remote printer. So, without having to understand the internals of PowerPoint, the module and function names displayed on the thread stack indicate that the thread was waiting to connect to a network printer. On this particular system, there was a network printer that was not responding, which explained the delay starting PowerPoint. (Microsoft Office applications connect to all configured printers at process startup.) The connection to that printer was deleted from the user’s system, and the problem went away.
Finally, when looking at 32-bit applications running on 64-bit systems as a Wow64 process (see Chapter 3 for more information on Wow64), Process Explorer shows both the 32-bit and 64-bit stack for threads. Because at the time of the system call proper, the thread has been switched to a 64-bit stack and context, simply looking at the thread’s 64-bit stack would reveal only half the story—the 64-bit part of the thread, with Wow64’s thunking code. So, when examining Wow64 processes, be sure to take into account both the 32-bit and 64-bit stacks. An example of a Wow64 thread inside Microsoft Office Word 2007 is shown in Figure 5-13. The highlighted stack frame and all stack frames below it are the 32-bit stack frames from the 32-bit stack. The stack frames above the highlighted frame are on the 64-bit stack.
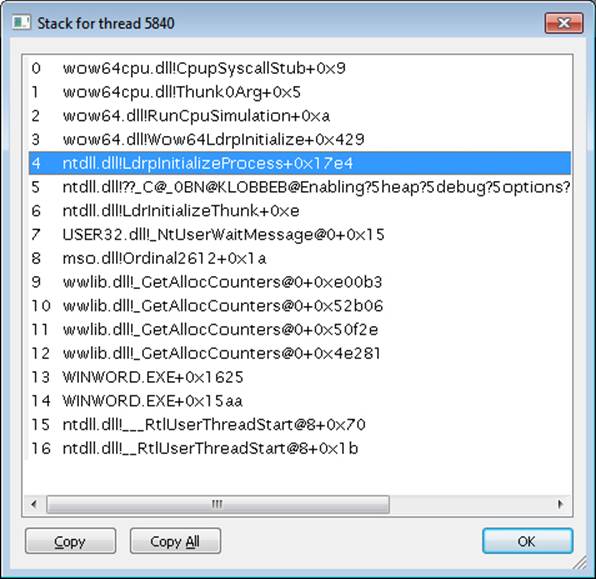
Figure 5-13. Example Wow64 stack
Limitations on Protected Process Threads
As we discussed in the process internals section, protected processes have several limitations in terms of which access rights will be granted, even to the users with the highest privileges on the system. These limitations also apply to threads inside such a process. This ensures that the actual code running inside the protected process cannot be hijacked or otherwise affected through standard Windows functions, which require access rights that are not granted for protected process threads. In fact, the only permissions granted are THREAD_SUSPEND_RESUME and THREAD_SET/QUERY_LIMITED_INFORMATION.
EXPERIMENT: VIEWING PROTECTED PROCESS THREAD INFORMATION
In the previous section, we took a look at how Process Explorer can be helpful in examining thread activity to determine the cause of potential system or application issues. This time, we’ll use Process Explorer to look at a protected process and see how the different access rights being denied affect its ability and usefulness on such a process.
Find the Audiodg.exe service inside the process list. This is a process responsible for much of the core work behind the user-mode audio stack in Windows, and it requires protection to ensure that high-definition decrypted audio content does not leak out to untrusted sources. Bring up the process properties view, and take a look at the Performance tab. Notice how the numbers for WS Private, WS Shareable, and WS Shared are 0, although the total Working Set is still displayed. This is an example of the THREAD_QUERY_INFORMATION versus THREAD_QUERY_LIMITED_INFORMATION rights.
More importantly, take a look at the Threads tab. As you can see here, Process Explorer is unable to show the Win32 thread start address and instead displays the standard thread start wrapper inside Ntdll.dll. If you try clicking the Stack button, you’ll get an error, because Process Explorer needs to read the virtual memory inside the protected process, which it can’t do.
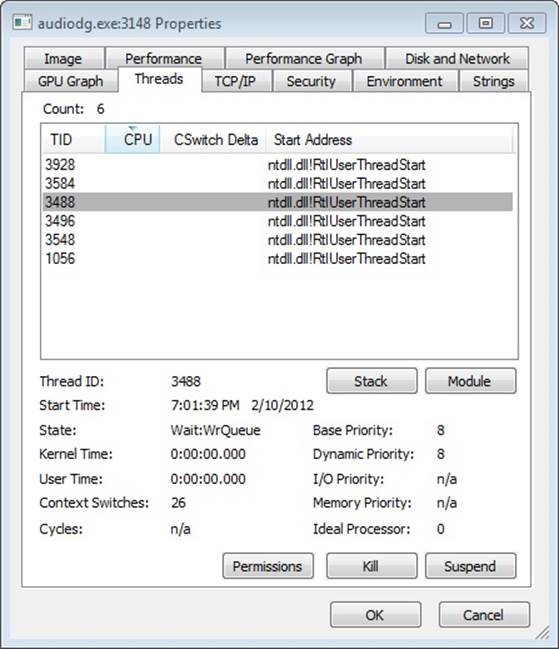
Finally, note that although the Base and Dynamic priorities are shown, the I/O and Memory priorities are not, which is another example of the limited versus full query information access right. As you try to kill a thread inside Audiodg.exe, notice yet another access denied error: recall the lack of THREAD_TERMINATE access.
Worker Factories (Thread Pools)
Worker factories refer to the internal mechanism used to implement user-mode thread pools. The legacy thread pool routines were completely implemented in user mode inside the Ntdll.dll library, and the Windows API provided various routines to call into the relevant routines, which provided waitable timers, wait callbacks, and automatic thread creation and deletion, depending on the amount of work being done.
Because the kernel can have direct control over thread scheduling, creation, and termination without the typical costs associated with doing these operations from user mode, most of the functionality required to support the user-mode thread pool implementation in Windows is now located in the kernel instead, which also simplifies the code that developers need to write. For example, creating a worker pool in a remote process can be done with a single API call, instead of the complex series of virtual memory calls this normally requires. Under this model, Ntdll.dll merely provides the interfaces and high-level APIs required for interfacing with the worker factory code.
This kernel-managed thread pool functionality in Windows is managed by an object manager type called TpWorkerFactory, as well as four native system calls for managing the factory and its workers (NtCreateWorkerFactory, NtWorkerFactoryWorkerReady,NtReleaseWorkerFactoryWorker, NtShutdownWorkerFactory), two query/set native calls (NtQueryInformationWorkerFactory and NtSetInformationWorkerFactory), and a wait call (NtWaitForWorkViaWorkerFactory).
Just like other native system calls, these calls provide user mode with a handle to the TpWorkerFactory object, which contains information such as the name and object attributes, the desired access mask, and a security descriptor. Unlike other system calls wrapped by the Windows API, however, thread-pool management is handled by Ntdll.dll’s native code, which means that developers work with an opaque descriptor (a TP_WORK pointer) owned by Ntdll.dll, in which the actual handle is stored.
As its name suggests, the worker factory implementation is responsible for allocating worker threads (and calling the given user-mode worker thread entry point), maintaining a minimum and maximum thread count (allowing for either permanent worker pools or totally dynamic pools), as well as other accounting information. This enables operations such as shutting down the thread pool to be performed with a single call to the kernel, because the kernel has been the only component responsible for thread creation and termination.
Because the kernel dynamically creates new threads as needed, based on minimum and maximum numbers provided, this also increases the scalability of applications using the new thread-pool implementation. A worker factory will create a new thread whenever all of the following conditions are met:
§ The number of available workers is lower than the maximum number of workers configured for the factory (default of 500).
§ The worker factory has bound objects (a bound object can be, for example, an ALPC port that this worker thread is waiting on) or a thread has been activated into the pool.
§ There are pending I/O request packets (IRPs; see Chapter 8, “I/O System,” in Part 2, for more information) associated with a worker thread.
§ Dynamic thread creation is enabled.
And it will terminate threads whenever they’ve become idle for more than 10 seconds (by default).
Furthermore, while developers have always been able to take advantage of as many threads as possible (based on the number of processors on the system) through the old implementation, but through support for dynamic processors in Windows Server (see the section on this topic later in this chapter), it’s now possible for applications using thread pools to automatically take advantage of new processors added at run time.
Note that the worker factory support is merely a wrapper to manage mundane tasks that would otherwise have to be performed in user mode (at a loss of performance), and much of the logic of the new thread-pool code remains in the Ntdll.dll side of this architecture. (Theoretically, by using undocumented functions, a different thread-pool implementation can be built around worker factories.) Also, it is not the worker factory code that provides the scalability, wait internals, and efficiency of work processing. Instead, it is a much older component of Windows that we already discussed—I/O completion ports, or more correctly, kernel queues (KQUEUE; see Chapter 8 in Part 2 for more information).
In fact, when creating a worker factory, an I/O completion port must have already been created by user mode, and the handle needs to be passed on. It is through this I/O completion port that the user-mode implementation will queue work and also wait for work—but by calling the worker factory system calls instead of the I/O completion port APIs. Internally, however, the “release” worker factory call (which queues work) is a wrapper around IoSetIoCompletionEx, which increases pending work, while the “wait” call is a wrapper aroundIoRemoveIoCompletion. Both these routines call into the kernel queue implementation.
Therefore, the job of the worker factory code is to manage either a persistent, static, or dynamic thread pool; wrap the I/O completion port model into interfaces that try to prevent stalled worker queues by automatically creating dynamic threads; and to simplify global cleanup and termination operations during a factory shutdown request (as well as to easily block new requests against the factory in such a scenario).
Unfortunately, the data structures used by the worker factory implementation are not in the public symbols, but it is still possible to look at some worker pools, as we’ll show in the next experiment. Additionally, the NtQueryInformationWorkerFactory API dumps almost every field in the worker factory structure.
EXPERIMENT: LOOKING AT THREAD POOLS
Because of the advantages of using the thread-pool mechanism, many core system components and applications make use of it, especially when dealing with resources such as ALPC ports (to dynamically process incoming requests at an appropriate and scalable level). One of the ways to identify which processes are using a worker factory is to look at the handle list in Process Explorer. Follow these steps to look at some details behind them:
1. Run Process Explorer, and select Show Unnamed Handles And Mappings from the View menu. Unfortunately, worker factories aren’t named by Ntdll.dll, so you need to take this step in order to see the handles.
2. Select Lsm.exe from the list of processes, and look at the handle table. Make sure that the lower pane is shown (View, Show Lower Pane) and is displaying handle table mode (View, Lower Pane View, Handles).
3. Right-click on the lower pane columns, and then click on Select Columns. Make sure that the Type column is selected to be shown, and click it to sort by type.
4. Now scroll down the handles, looking at the Type column, until you find a handle of type TpWorkerFactory. You should see something like this:
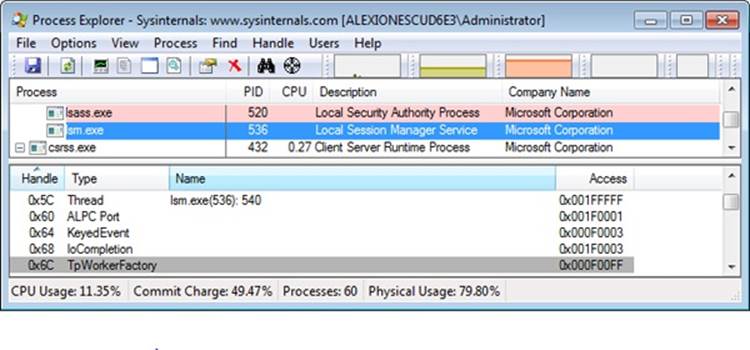
Notice how the TpWorkerFactory handle is immediately preceded by an IoCompletion handle (numerically; sort by “Handle” to see this). As was described previously, this occurs because before creating a worker factory, a handle to an I/O completion port on which work will be sent must be created.
5. Now double-click Lsm.exe in the list of processes, and click on the Threads tab. You should see something similar to the image here:
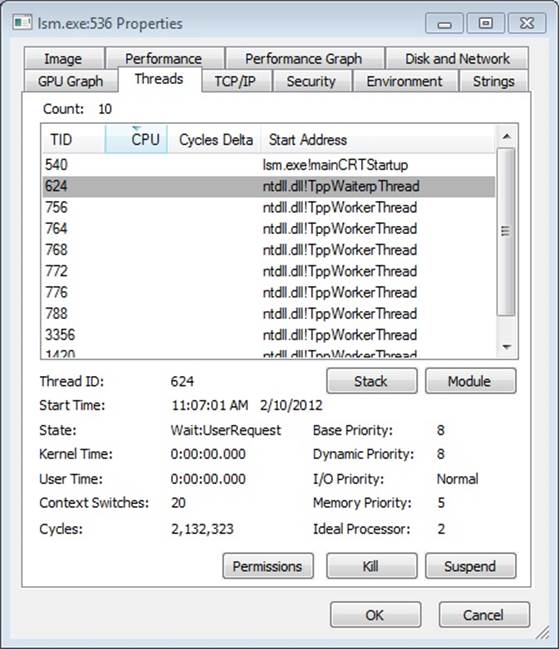
On this system (with two processors), the worker factory has created six worker threads at the request of Lsm.exe (processes can define a minimum and maximum number of threads) and based on its usage and the count of processors on the machine. These threads are identified as TppWorkerThread, which is Ntdll.dll’s worker entry point when calling the worker factory system calls.
6. Ntdll.dll is responsible for its own internal accounting inside the worker thread wrapper (TppWorkerThread) before calling the worker callback that the application has registered. By looking at the Wait reason in the State information for each thread, you can get a rough idea of what each worker thread might be doing. Double-click on one of the threads inside an LPC wait to look at its stack. Here’s an example:
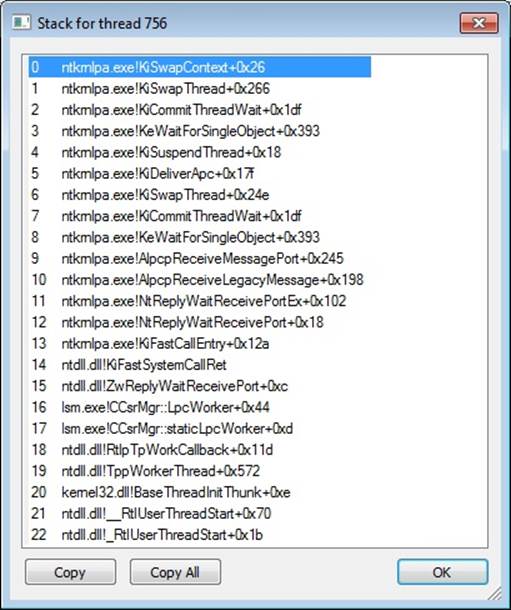
This specific worker thread is being used by Lsm.exe for LPC communication. Because the local session manager needs to communicate with other components such as Smss and Csrss through LPC, it makes sense that it would want a number of its threads to be busy replying and waiting for LPC messages. (The more threads doing this, the less stalling there is on the LPC pipeline.)
If you look at other worker threads, you’ll see some are waiting for objects such as events. A process can have multiple thread pools, and each thread pool can have a variety of threads doing completely unrelated tasks. It’s up to the developer to assign work and to call the thread pool APIs to register this work through Ntdll.dll.
Thread Scheduling
This section describes the Windows scheduling policies and algorithms. The first subsection provides a condensed description of how scheduling works on Windows and a definition of key terms. Then Windows priority levels are described from both the Windows API and the Windows kernel points of view. After a review of the relevant Windows utilities and tools that relate to scheduling, the detailed data structures and algorithms that make up the Windows scheduling system are presented, including a description of common scheduling scenarios and how thread selection, as well as processor selection, occurs.
Overview of Windows Scheduling
Windows implements a priority-driven, preemptive scheduling system—at least one of the highest-priority runnable (ready) threads always runs, with the caveat that certain high-priority threads ready to run might be limited by the processors on which they might be allowed or preferred to run on, a phenomenon called processor affinity. Processor affinity is defined based on a given processor group, which collects up to 64 processors. By default, threads can run only on any available processors within the processor group associated with the process (to maintain compatibility with older versions of Windows which supported only 64 processors), but developers can alter processor affinity by using the appropriate APIs or by setting an affinity mask in the image header, while users can use tools to change affinity at runtime or at process creation. However, although multiple threads in a process can be associated with different groups, a thread on its own can run only on the processors available within its assigned group. Additionally, developers can choose to create group-aware applications, which use extended scheduling APIs to associate logical processors on different groups with the affinity of their threads. Doing so converts the process into a multigroup process that can theoretically run its threads on any available processor within the machine.
EXPERIMENT: VIEWING READY THREADS
You can view the list of ready threads with the kernel debugger !ready command. This command displays the thread or list of threads that are ready to run at each priority level. In the following example, generated on a 32-bit machine with a dual-core processor, two threads are ready to run at priority 8 on the first logical processor, and one thread at priority 10, two threads at priority 9, and three threads at priority 8 are ready to run on the second logical processor. Determining which of these threads get to run on their respective processor is a simple matter of picking the first thread on top of the highest priority queue (thread 857d9030 for logical processor 0, and thread 857c0030 for logical processor 1), but why the queues contain the threads they do is a complex result at the end of several algorithms that the scheduler uses. We will cover this topic later in this section.
kd> !ready
Processor 0: Ready Threads at priority 8
THREAD 857d9030 Cid 0ec8.0e30 Teb: 7ffdd000 Win32Thread: 00000000 READY
THREAD 855c8300 Cid 0ec8.0eb0 Teb: 7ff9c000 Win32Thread: 00000000 READY
Processor 1: Ready Threads at priority 10
THREAD 857c0030 Cid 04c8.0378 Teb: 7ffdf000 Win32Thread: fef7f8c0 READY
Processor 1: Ready Threads at priority 9
THREAD 87fc86f0 Cid 0ec8.04c0 Teb: 7ffd3000 Win32Thread: 00000000 READY
THREAD 88696700 Cid 0ec8.0ce8 Teb: 7ffa0000 Win32Thread: 00000000 READY
Processor 1: Ready Threads at priority 8
THREAD 856e5520 Cid 0ec8.0228 Teb: 7ff98000 Win32Thread: 00000000 READY
THREAD 85609d78 Cid 0ec8.09b0 Teb: 7ffd9000 Win32Thread: 00000000 READY
THREAD 85fdeb78 Cid 0ec8.0218 Teb: 7ff72000 Win32Thread: 00000000 READY
After a thread is selected to run, it runs for an amount of time called a quantum. A quantum is the length of time a thread is allowed to run before another thread at the same priority level is given a turn to run. Quantum values can vary from system to system and process to process for any of three reasons:
§ System configuration settings (long or short quantums, variable or fixed quantums, and priority separation)
§ Foreground or background status of the process
§ Use of the job object to alter the quantum
These details are explained in more details in the Quantum section later in the chapter, as well as in the Job Objects section).
A thread might not get to complete its quantum, however, because Windows implements a preemptive scheduler: if another thread with a higher priority becomes ready to run, the currently running thread might be preempted before finishing its time slice. In fact, a thread can be selected to run next and be preempted before even beginning its quantum!
The Windows scheduling code is implemented in the kernel. There’s no single “scheduler” module or routine, however—the code is spread throughout the kernel in which scheduling-related events occur. The routines that perform these duties are collectively called the kernel’s dispatcher. The following events might require thread dispatching:
§ A thread becomes ready to execute—for example, a thread has been newly created or has just been released from the wait state.
§ A thread leaves the running state because its time quantum ends, it terminates, it yields execution, or it enters a wait state.
§ A thread’s priority changes, either because of a system service call or because Windows itself changes the priority value.
§ A thread’s processor affinity changes so that it will no longer run on the processor on which it was running.
At each of these junctions, Windows must determine which thread should run next on the logical processor that was running the thread, if applicable, or on which logical processor the thread should now run on. After a logical processor has selected a new thread to run, it eventually performs a context switch to it. A context switch is the procedure of saving the volatile processor state associated with a running thread, loading another thread’s volatile state, and starting the new thread’s execution.
As already noted, Windows schedules at the thread granularity. This approach makes sense when you consider that processes don’t run but only provide resources and a context in which their threads run. Because scheduling decisions are made strictly on a thread basis, no consideration is given to what process the thread belongs to. For example, if process A has 10 runnable threads, process B has 2 runnable threads, and all 12 threads are at the same priority, each thread would theoretically receive one-twelfth of the CPU time—Windows wouldn’t give 50 percent of the CPU to process A and 50 percent to process B.
Priority Levels
To understand the thread-scheduling algorithms, one must first understand the priority levels that Windows uses. As illustrated in Figure 5-14, internally Windows uses 32 priority levels, ranging from 0 through 31. These values divide up as follows:
§ Sixteen real-time levels (16 through 31)
§ Sixteen variable levels (0 through 15), out of which level 0 is reserved for the zero page thread
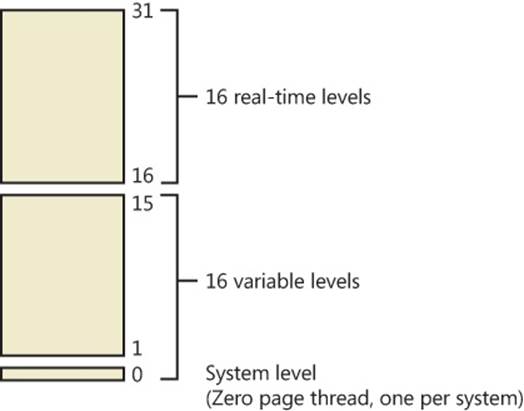
Figure 5-14. Thread priority levels
Thread priority levels are assigned from two different perspectives: those of the Windows API and those of the Windows kernel. The Windows API first organizes processes by the priority class to which they are assigned at creation (the numbers represent the internal PROCESS_PRIORITY_CLASS_ index recognized by the kernel): Real-time (4), High (3), Above Normal (7), Normal (2), Below Normal (5), and Idle (1).
It then assigns a relative priority of the individual threads within those processes. Here, the numbers represent a priority delta that is applied to the process base priority: Time-critical (15), Highest (2), Above-normal (1), Normal (0), Below-normal (–1), Lowest (–2), and Idle (–15).
Therefore, in the Windows API, each thread has a base priority that is a function of its process priority class and its relative thread priority. In the kernel, the process priority class is converted to a base priority by using the PspPriorityTable and the PROCESS_PRIORITY_CLASS indices shown earlier, which sets priorities of 4, 8, 13, 14, 6, and 10, respectively. (This is a fixed mapping that cannot be changed.) The relative thread priority is then applied as a differential to this base priority. For example, a “Highest” thread will receive a thread base priority of two levels higher than the base priority of its process.
This mapping from Windows priority to internal Windows numeric priority is shown in Table 5-3.
Table 5-3. Mapping of Windows Kernel Priorities to the Windows API
|
Priority Class Relative Priority |
Realtime |
High |
Above Normal |
Normal |
Below Normal |
Idle |
|
Time Critical (+ SATURATION) |
31 |
15 |
15 |
15 |
15 |
15 |
|
Highest (+2) |
26 |
15 |
12 |
10 |
8 |
6 |
|
Above Normal (+1) |
25 |
14 |
11 |
9 |
7 |
5 |
|
Normal (0) |
24 |
13 |
10 |
8 |
6 |
4 |
|
Below Normal (-1) |
23 |
12 |
9 |
7 |
5 |
3 |
|
Lowest (-2) |
22 |
11 |
8 |
6 |
4 |
2 |
|
Idle (- SATURATION) |
16 |
1 |
1 |
1 |
1 |
1 |
You’ll note that the Time-Critical and Idle relative thread priorities maintain their respective values regardless of the process priority class (unless it is Realtime). This is because the Windows API requests saturation of the priority from the kernel, by actually passing in 16 or -16 as the requested relative priority (instead of 15 or -15). This is then recognized by the kernel as a request for saturation, and the Saturation field in KTHREAD is set. This causes, for positive saturation, the thread to receive the highest possible priority within its priority class (dynamic or real-time), or for negative saturation, the lowest possible one. Additionally, future requests to change the base priority of the process will no longer affect the base priority of these threads, because saturated threads are skipped in the processing code.
Whereas a process has only a single base priority value, each thread has two priority values: current and base. Scheduling decisions are made based on the current priority. As explained in the following section on priority boosting, the system under certain circumstances increases the priority of threads in the dynamic range (0 through 15) for brief periods. Windows never adjusts the priority of threads in the real-time range (16 through 31), so they always have the same base and current priority.
A thread’s initial base priority is inherited from the process base priority. A process, by default, inherits its base priority from the process that created it. This behavior can be overridden on the CreateProcess function or by using the command-line start command. A process priority can also be changed after being created by using the SetPriorityClass function or various tools that expose that function, such as Task Manager and Process Explorer (by right-clicking on the process and choosing a new priority class). For example, you can lower the priority of a CPU-intensive process so that it does not interfere with normal system activities. Changing the priority of a process changes the thread priorities up or down, but their relative settings remain the same.
Normally, user applications and services start with a normal base priority, so their initial thread typically executes at priority level 8. However, some Windows system processes (such as the session manager, service control manager, and local security authentication process) have a base process priority slightly higher than the default for the Normal class (8). This higher default value ensures that the threads in these processes will all start at a higher priority than the default value of 8.
Real-Time Priorities
You can raise or lower thread priorities within the dynamic range in any application; however, you must have the increase scheduling priority privilege to enter the real-time range. Be aware that many important Windows kernel-mode system threads run in the real-time priority range, so if threads spend excessive time running in this range, they might block critical system functions (such as in the memory manager, cache manager, or other device drivers).
Using the standard Windows APIs, once a process has entered the real-time range, all of its threads (even Idle ones) must run at one of the real-time priority levels. It is thus impossible to mix real-time and dynamic threads within the same process through standard interfaces. This is because the SetThreadPriority API calls the native NtSetInformationThread API with the ThreadBasePriority information class, which allows priorities to remain only in the same range. Furthermore, this information class allows priority changes only in the recognized Windows API deltas of –2 to 2 (or real-time/idle), unless the request comes from CSRSS or a real-time process. In other words, this means that a real-time process does have the ability to pick thread priorities anywhere between 16 and 31, even though the standard Windows API relative thread priorities would seem to limit its choices based on the table that was shown earlier.
However, by calling this API with the ThreadActualBasePriority information class, the kernel base priority for the thread can be directly set, including in the dynamic range for a real-time process.
NOTE
As illustrated in Figure 5-15, which shows the interrupt request levels (IRQLs), although Windows has a set of priorities called real-time, they are not real-time in the common definition of the term. This is because Windows doesn’t provide true, real-time operating system facilities, such as guaranteed interrupt latency or a way for threads to obtain a guaranteed execution time.
Interrupt Levels vs. Priority Levels
As illustrated in Figure 5-15 of the interrupt request levels (IRQLs) for a 32-bit system, threads normally run at IRQL 0 (called passive level, because no interrupts are in process and none are blocked) or IRQL 1 (APC level). (For a description of how Windows uses interrupt levels, see Chapter 3.) User-mode code always runs at passive level. Because of this, no user-mode thread, regardless of its priority, can ever block hardware interrupts (although high-priority, real-time threads can block the execution of important system threads).
Threads running in kernel mode, although initially scheduled at passive level or APC level, can raise IRQL to higher levels—for example, while executing a system call that involves thread dispatching, memory management, or input/output. If a thread does raise IRQL to dispatch level or above, no further thread-scheduling behavior will occur on its processor until it lowers IRQL below dispatch level. A thread executing at dispatch level or above blocks the activity of the thread scheduler and prevents thread context switches on its processor.
A thread running in kernel mode can be running at APC level if it is running a special kernel APC; or it can temporarily raise IRQL to APC level to block the delivery of special kernel APCs. (For more information on APCs, see Chapter 3.) However, executing at APC level does not alter the scheduling behavior of the thread vs. other threads; it affects only the delivery of kernel APCs to that thread. In fact, a thread executing in kernel mode at APC level can be preempted in favor of a higher priority thread running in user mode at passive level.
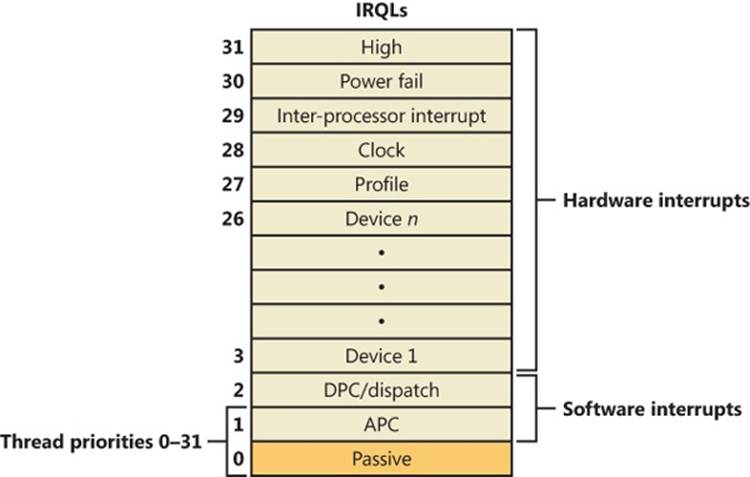
Figure 5-15. Thread priorities vs. IRQLs on an x86 system
Using Tools to Interact with Priority
You can change (and view) the base-process priority with Task Manager and Process Explorer. You can kill individual threads in a process with Process Explorer (which should be done, of course, with extreme care).
You can view individual thread priorities with the Performance Monitor, Process Explorer, or WinDbg. Although it might be useful to increase or lower the priority of a process, it typically does not make sense to adjust individual thread priorities within a process, because only a person who thoroughly understands the program (in other words, typically only the developer himself) would understand the relative importance of the threads within the process.
The only way to specify a starting priority class for a process is with the start command in the Windows command prompt. If you want to have a program start every time with a specific priority, you can define a shortcut to use the start command by beginning the command with cmd /c. This runs the command prompt, executes the command on the command line, and terminates the command prompt. For example, to run Notepad in the low-process priority, the shortcut is cmd /c start /low Notepad.exe.
EXPERIMENT: EXAMINING AND SPECIFYING PROCESS AND THREAD PRIORITIES
Try the following experiment:
1. From an elevated command prompt, type start /realtime notepad. Notepad should open.
2. Run Process Explorer, and select Notepad.exe from the list of processes. Double-click on Notepad.exe to show the process properties window, and then click on the Threads tab, as shown here. Notice that the dynamic priority of the thread in Notepad is 24. This matches the real-time value shown in the following image.
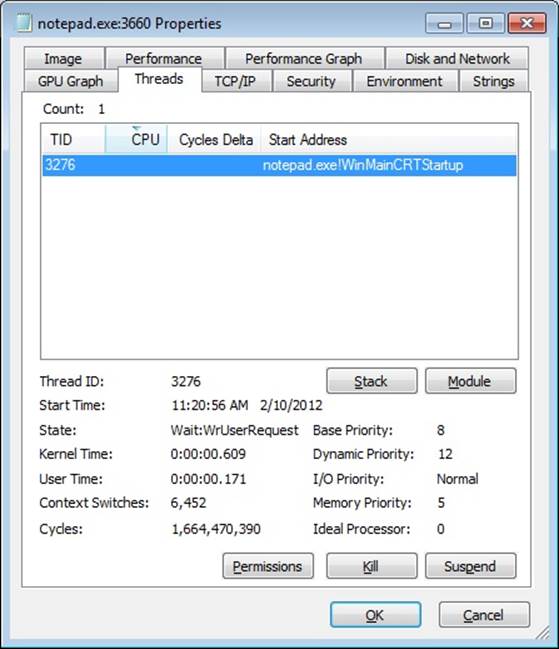
3. Task Manager can show you similar information. Press Ctrl+Shift+Esc to start Task Manager, and click on the Processes tab. Right-click on the Notepad.exe process, and select the Set Priority option. You can see that Notepad’s process priority class is Realtime, as shown in the following dialog box:
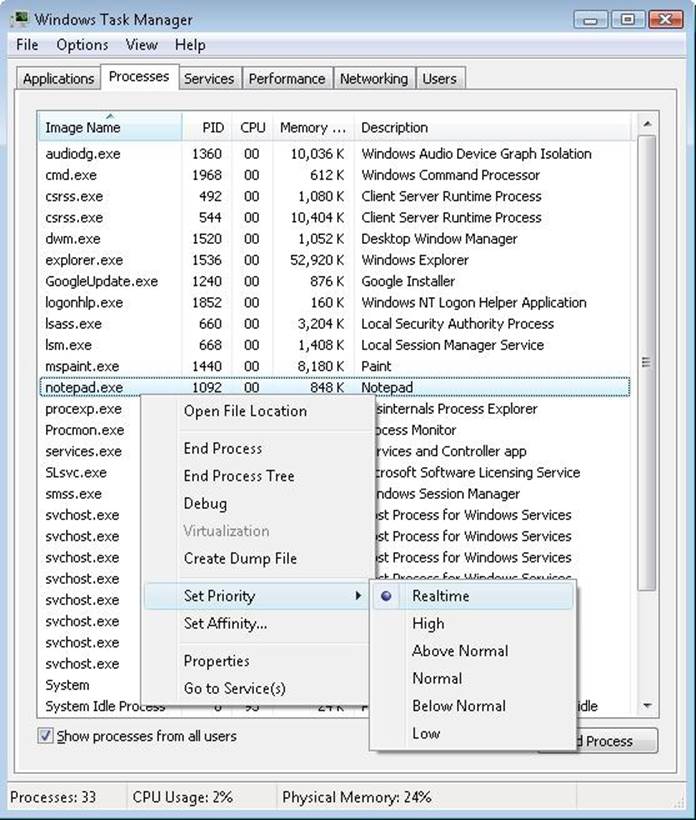
WINDOWS SYSTEM RESOURCE MANAGER
Windows Server 2008 R2 Enterprise Edition and Windows Server 2008 R2 Datacenter Edition include an optionally installable component called Windows System Resource Manager (WSRM). It permits the administrator to configure policies that specify CPU utilization, affinity settings, and memory limits (both physical and virtual) for processes. In addition, WSRM can generate resource utilization reports that can be used for accounting and verification of service-level agreements with users.
Policies can be applied for specific applications (by matching the name of the image with or without specific command-line arguments), users, or groups. The policies can be scheduled to take effect at certain periods or can be enabled all the time.
After you set a resource-allocation policy to manage specific processes, the WSRM service monitors CPU consumption of managed processes and adjusts process base priorities when those processes do not meet their target CPU allocations.
The physical memory limitation uses the function SetProcessWorkingSetSizeEx to set a hard-working set maximum. The virtual memory limit is implemented by the service checking the private virtual memory consumed by the processes. (See Chapter 10 in Part 2 for an explanation of these memory limits.) If this limit is exceeded, WSRM can be configured to either kill the processes or write an entry to the Event Log. This behavior can be used to detect a process with a memory leak before it consumes all the available committed memory on the system. Note that WSRM memory limits do not apply to Address Windowing Extensions (AWE) memory, large page memory, or kernel memory (nonpaged or paged pool).
Thread States
Before you can comprehend the thread-scheduling algorithms, you need to understand the various execution states that a thread can be in. The thread states are as follows:
§ Ready. A thread in the ready state is waiting to execute (or ready to be in-swapped after completing a wait). When looking for a thread to execute, the dispatcher considers only the pool of threads in the ready state.
§ Deferred ready. This state is used for threads that have been selected to run on a specific processor but have not actually started running there. This state exists so that the kernel can minimize the amount of time the per-processor lock on the scheduling database is held.
§ Standby. A thread in the standby state has been selected to run next on a particular processor. When the correct conditions exist, the dispatcher performs a context switch to this thread. Only one thread can be in the standby state for each processor on the system. Note that a thread can be preempted out of the standby state before it ever executes (if, for example, a higher priority thread becomes runnable before the standby thread begins execution).
§ Running. Once the dispatcher performs a context switch to a thread, the thread enters the running state and executes. The thread’s execution continues until its quantum ends (and another thread at the same priority is ready to run), it is preempted by a higher priority thread, it terminates, it yields execution, or it voluntarily enters the waiting state.
§ Waiting. A thread can enter the waiting state in several ways: a thread can voluntarily wait for an object to synchronize its execution, the operating system can wait on the thread’s behalf (such as to resolve a paging I/O), or an environment subsystem can direct the thread to suspend itself. When the thread’s wait ends, depending on the priority, the thread either begins running immediately or is moved back to the ready state.
§ Transition. A thread enters the transition state if it is ready for execution but its kernel stack is paged out of memory. Once its kernel stack is brought back into memory, the thread enters the ready state.
§ Terminated. When a thread finishes executing, it enters the terminated state. Once the thread is terminated, the executive thread object (the data structure in a nonpaged pool that describes the thread) might or might not be deallocated. (The object manager sets the policy regarding when to delete the object.)
§ Initialized. This state is used internally while a thread is being created.
Table 5-4 describes the state transitions for threads, and Figure 5-16 illustrates a simplified version. (The numeric values shown represent the value of the thread-state performance counter.) In the simplified version, the Ready, Standby, and Deferred Ready states are represented as one. This reflects the fact that the Standby and Deferred Ready states act as temporary placeholders for the scheduling routines. These states are almost always very short-lived; threads in these states always transition quickly to Ready, Running, or Waiting. More details on what happens at each transition are included later in this section.
Table 5-4. Thread States and Transitions
|
Init |
Ready |
Running |
Standby |
Terminated |
Waiting |
Transition |
Deferred Ready |
||
|
Init |
A thread becomes Initialized during the first few moments of its creation (KeStartThread). |
||||||||
|
Ready |
A thread is added in the dispatcherready database of its ideal processor. |
||||||||
|
Running |
Selected byKiSearchForNewThread |
Picked up for execution by local CPU |
Preemption after wait satisfaction |
||||||
|
Standby |
Selected byKiSelectNextThread |
Selected by KiDeferredReadyThread for remote CPU |
|||||||
|
Terminated |
Killed beforePspInsertThread finished |
Killed |
A thread can kill only itself. It must be in the Running state before entering KeTerminateThread. |
||||||
|
Waiting |
Thread enters a wait |
Only running threads can wait. |
|||||||
|
Transition |
Kernel stack no longer resident |
Only waiting threads can transition. |
|||||||
|
Deferred Ready |
Last step in PspInsertThread |
Affinity change |
Thread becomes preempted (if old processor is no longer available) |
Affinity change |
Wait satisfaction (but no preemption) |
Kernel stack swap-in completed |
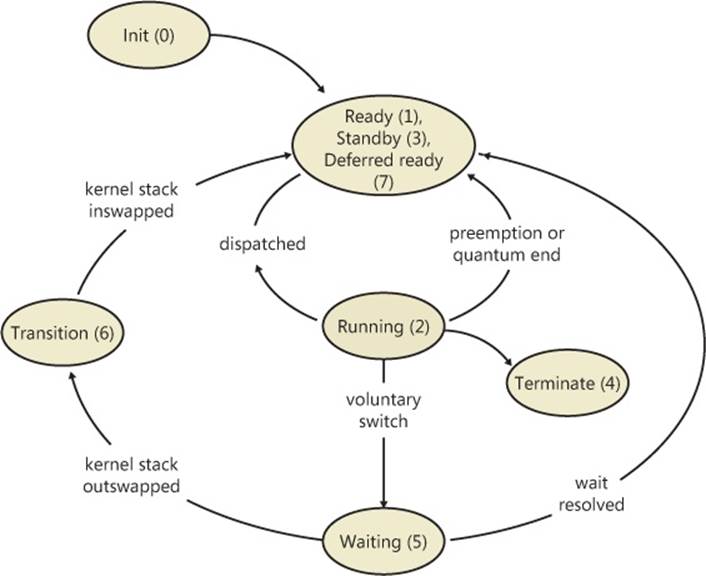
Figure 5-16. Simplified version of thread states and transitions
EXPERIMENT: THREAD-SCHEDULING STATE CHANGES
You can watch thread-scheduling state changes with the Performance tool in Windows. This utility can be useful when you’re debugging a multithreaded application and you’re unsure about the state of the threads running in the process. To watch thread-scheduling state changes by using the Performance tool, follow these steps:
1. Run Notepad (Notepad.exe).
2. Start the Performance tool by selecting All Programs from the Start menu and then selecting Performance Monitor from the Administrative Tools menu. Click on the Performance Monitor entry under Monitoring Tools.
3. Select the chart view if you’re in some other view.
4. Right-click on the graph, and choose Properties.
5. Click on the Graph tab, and change the chart vertical scale maximum to 7. (As you’ll see from the explanation text for the performance counter, thread states are numbered from 0 through 7.) Click OK.
6. Click the Add button on the toolbar to bring up the Add Counters dialog box.
7. Select the Thread performance object, and then select the Thread State counter. Select the Show Description check box to see the definition of the values:
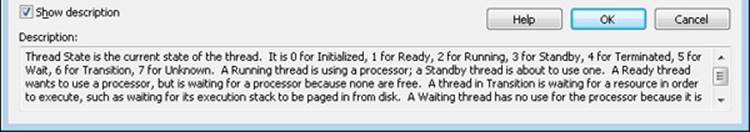
8. In the Instances box, select <All instances> and type Notepad before clicking Search. Scroll down until you see the Notepad process (notepad/0); select it, and click the Add button.
9. Scroll back up in the Instances box to the Mmc process (the Microsoft Management Console process running the System Monitor), select all the threads (mmc/0, mmc/1, and so on), and add them to the chart by clicking the Add button. Before you click Add, you should see something like the dialog box that follows.
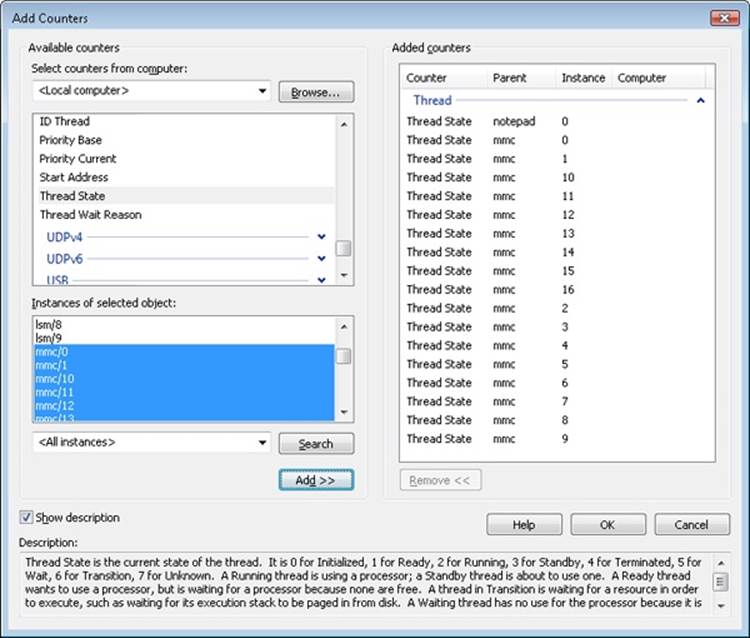
10. Now close the Add Counters dialog box by clicking OK.
11. You should see the state of the Notepad thread (the very top line in the following figure) as a 5. As shown in the explanation text you saw under step 7, this number represents the waiting state (because the thread is waiting for GUI input):
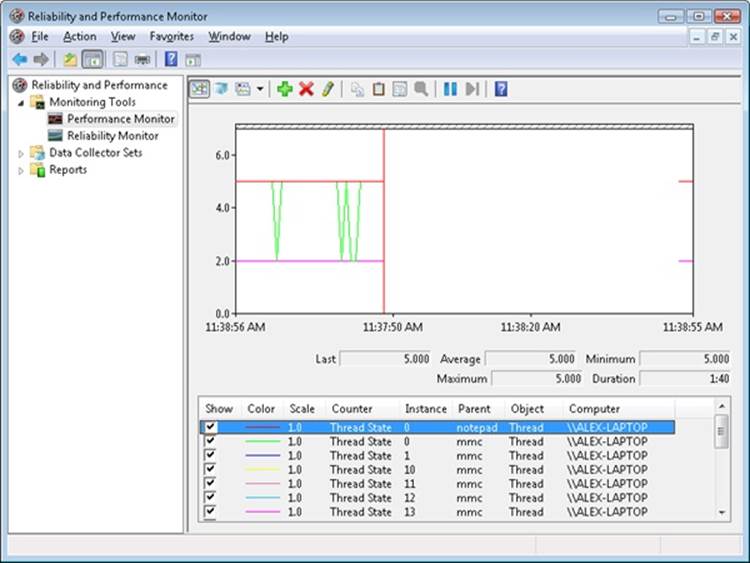
12. Notice that one thread in the Mmc process (running the Performance tool snap-in) is in the running state (number 2). This is the thread that’s querying the thread states, so it’s always displayed in the running state.
13. You’ll never see Notepad in the running state (unless you’re on a multiprocessor system) because Mmc is always in the running state when it gathers the state of the threads you’re monitoring.
Dispatcher Database
To make thread-scheduling decisions, the kernel maintains a set of data structures known collectively as the dispatcher database, illustrated in Figure 5-17. The dispatcher database keeps track of which threads are waiting to execute and which processors are executing which threads.
To improve scalability, including thread-dispatching concurrency, Windows multiprocessor systems have per-processor dispatcher ready queues, as illustrated in Figure 5-17. In this way, each CPU can check its own ready queues for the next thread to run without having to lock the systemwide ready queues.
The per-processor ready queues, as well as the per-processor ready summary, are part of the processor control block (PRCB) structure. (To see the fields in the PRCB, type dt nt!_kprcb in the kernel debugger.) The names of each component that we will talk about (in italics) are field members of the PRCB structure.
The dispatcher ready queues (DispatcherReadyListHead) contain the threads that are in the ready state, waiting to be scheduled for execution. There is one queue for each of the 32 priority levels. To speed up the selection of which thread to run or preempt, Windows maintains a 32-bit bit mask called the ready summary (ReadySummary). Each bit set indicates one or more threads in the ready queue for that priority level. (Bit 0 represents priority 0, and so on.)
Instead of scanning each ready list to see whether it is empty or not (which would make scheduling decisions dependent on the number of different priority threads), a single bit scan is performed as a native processor command to find the highest bit set. Regardless of the number of threads in the ready queue, this operation takes a constant amount of time, which is why you might sometimes see the Windows scheduling algorithm referred to as an O(1), or constant time, algorithm.
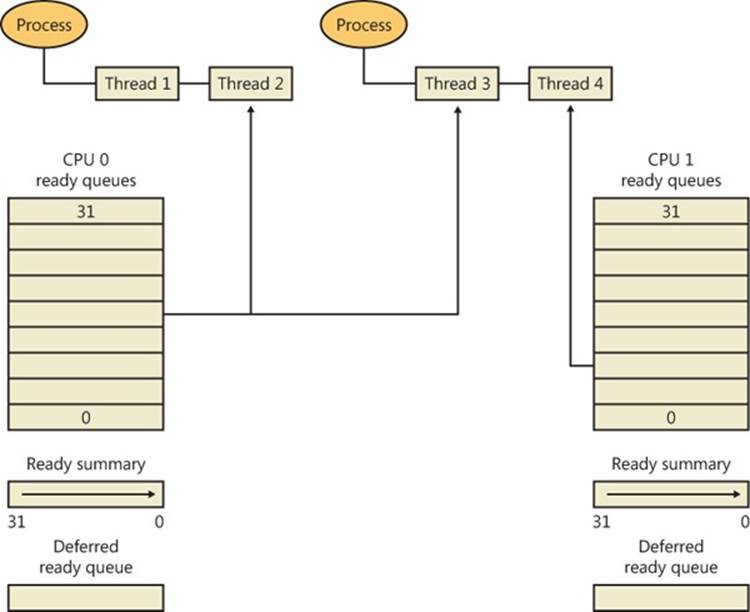
Figure 5-17. Windows multiprocessor dispatcher database
The dispatcher database is synchronized by raising IRQL to DISPATCH_LEVEL. (For an explanation of interrupt priority levels, see the Trap Dispatching section in Chapter 3.) Raising IRQL in this way prevents other threads from interrupting thread dispatching on the processor because threads normally run at IRQL 0 or 1. However, more is required than just raising IRQL, because other processors can simultaneously raise to the same IRQL and attempt to operate on their dispatcher database. How Windows synchronizes access to the dispatcher database is explained in the Multiprocessor Systems section later in the chapter.
Quantum
As mentioned earlier in the chapter, a quantum is the amount of time a thread gets to run before Windows checks to see whether another thread at the same priority is waiting to run. If a thread completes its quantum and there are no other threads at its priority, Windows permits the thread to run for another quantum.
On client versions of Windows, threads run by default for 2 clock intervals; on server systems, by default, a thread runs for 12 clock intervals. (We’ll explain how you can change these values later.) The rationale for the longer default value on server systems is to minimize context switching. By having a longer quantum, server applications that wake up as the result of a client request have a better chance of completing the request and going back into a wait state before their quantum ends.
The length of the clock interval varies according to the hardware platform. The frequency of the clock interrupts is up to the HAL, not the kernel. For example, the clock interval for most x86 uniprocessors is about 10 milliseconds (note that these machines are no longer supported by Windows and are only used here for example purposes), and for most x86 and x64 multiprocessors it is about 15 milliseconds. This clock interval is stored in the kernel variable KeMaximumIncrement as hundreds of nanoseconds.
Because thread run-time accounting is based on processor cycles, although threads still run in units of clock intervals, the system does not use the count of clock ticks as the deciding factor for how long a thread has run and whether its quantum has expired. Instead, when the system starts up, a calculation is made whose result is the number of clock cycles that each quantum is equivalent to. (This value is stored in the kernel variable KiCyclesPerClockQuantum.) This calculation is made by multiplying the processor speed in Hz (CPU clock cycles per second) with the number of seconds it takes for one clock tick to fire (based on the KeMaximumIncrement value described earlier).
The result of this accounting method is that threads do not actually run for a quantum number based on clock ticks; they instead run for a quantum target, which represents an estimate of what the number of CPU clock cycles the thread has consumed should be when its turn would be given up. This target should be equal to an equivalent number of clock interval timer ticks because, as you just saw, the calculation of clock cycles per quantum is based on the clock interval timer frequency, which you can check using the following experiment. On the other hand, because interrupt cycles are not charged to the thread, the actual clock time might be longer.
EXPERIMENT: DETERMINING THE CLOCK INTERVAL FREQUENCY
The Windows GetSystemTimeAdjustment function returns the clock interval. To determine the clock interval, download and run the Clockres program from Windows Sysinternals (www.microsoft.com/technet/sysinternals). Here’s the output from a dual-core 64-bit Windows 7 system:
C:\>clockres
ClockRes v2.0 - View the system clock resolution
Copyright (C) 2009 Mark Russinovich
SysInternals - www.sysinternals.com
Maximum timer interval: 15.600 ms
Minimum timer interval: 0.500 ms
Current timer interval: 15.600 ms
Quantum Accounting
Each process has a quantum reset value in the process control block (KPROCESS). This value is used when creating new threads inside the process and is duplicated in the thread control block (KTHREAD), which is then used when giving a thread a new quantum target. The quantum reset value is stored in terms of actual quantum units (we’ll discuss what these mean soon), which are then multiplied by the number of clock cycles per quantum, resulting in the quantum target.
As a thread runs, CPU clock cycles are charged at different events (context switches, interrupts, and certain scheduling decisions). If at a clock interval timer interrupt, the number of CPU clock cycles charged has reached (or passed) the quantum target, quantum end processing is triggered. If there is another thread at the same priority waiting to run, a context switch occurs to the next thread in the ready queue.
Internally, a quantum unit is represented as one third of a clock tick. (So one clock tick equals three quantums.) This means that on client Windows systems, threads, by default, have a quantum reset value of 6 (2 * 3), and that server systems have a quantum reset value of 36 (12 * 3). For this reason, the KiCyclesPerClockQuantum value is divided by three at the end of the calculation previously described, because the original value describes only CPU clock cycles per clock interval timer tick.
The reason a quantum was stored internally as a fraction of a clock tick rather than as an entire tick was to allow for partial quantum decay-on-wait completion on versions of Windows prior to Windows Vista. Prior versions used the clock interval timer for quantum expiration. If this adjustment were not made, it would have been possible for threads never to have their quantums reduced. For example, if a thread ran, entered a wait state, ran again, and entered another wait state but was never the currently running thread when the clock interval timer fired, it would never have its quantum charged for the time it was running. Because threads now have CPU clock cycles charged instead of quantums, and because this no longer depends on the clock interval timer, these adjustments are not required.
EXPERIMENT: DETERMINING THE CLOCK CYCLES PER QUANTUM
Windows doesn’t expose the number of clock cycles per quantum through any function, but with the calculation and description we’ve given, you should be able to determine this on your own using the following steps and a kernel debugger such as WinDbg in local debugging mode:
1. Obtain your processor frequency as Windows has detected it. You can use the value stored in the PRCB’s MHz field, which can be displayed with the !cpuinfo command. Here is a sample output of a dual-core Intel system running at 2829 MHz:
2. lkd> !cpuinfo
3. CP F/M/S Manufacturer MHz PRCB Signature MSR 8B Signature Features
4. 0 6,15,6 GenuineIntel 2829 000000c700000000 >000000c700000000<a00f3fff
5. 1 6,15,6 GenuineIntel 2829 000000c700000000 a00f3fff
6. Cached Update Signature 000000c700000000
Initial Update Signature 000000c700000000
7. Convert the number to Hertz (Hz). This is the number of CPU clock cycles that occur each second on your system. In this case, 2,829,000,000 cycles per second.
8. Obtain the clock interval on your system by using clockres. This measures how long it takes before the clock fires. On the sample system used here, this interval was 15.600100 ms.
9. Convert this number to the number of times the clock interval timer fires each second. One second is 1000 ms, so divide the number derived in step 3 by 1000. In this case, the timer fires every 0.0156001 seconds.
10. Multiply this count by the number of cycles each second that you obtained in step 2. In our case, 44,132,682.9 cycles have elapsed after each clock interval.
11. Remember that each quantum unit is one-third of a clock interval, so divide the number of cycles by three. In our example, this gives us 14,710,894, or 0xE0786E in hexadecimal. This is the number of clock cycles each quantum unit should take on a system running at 2829 MHz with a clock interval of around 15 ms.
12. To verify your calculation, dump the value of KiCyclesPerClockQuantum on your system—it should match.
13.lkd> dd nt!KiCyclesPerClockQuantum L1
81d31ae8 00e0786e
Controlling the Quantum
You can change the thread quantum for all processes, but you can choose only one of two settings: short (2 clock ticks, which is the default for client machines) or long (12 clock ticks, which is the default for server systems).
NOTE
By using the job object on a system running with long quantums, you can select other quantum values for the processes in the job. For more information on the job object, see the Job Objects section later in the chapter.
To change this setting, right-click on your Computer icon on the desktop, or in Windows Explorer, choose Properties, click the Advanced System Settings label, click on the Advanced tab, click the Settings button in the Performance section, and finally click on the Advanced tab. The dialog box displayed is shown in Figure 5-18.
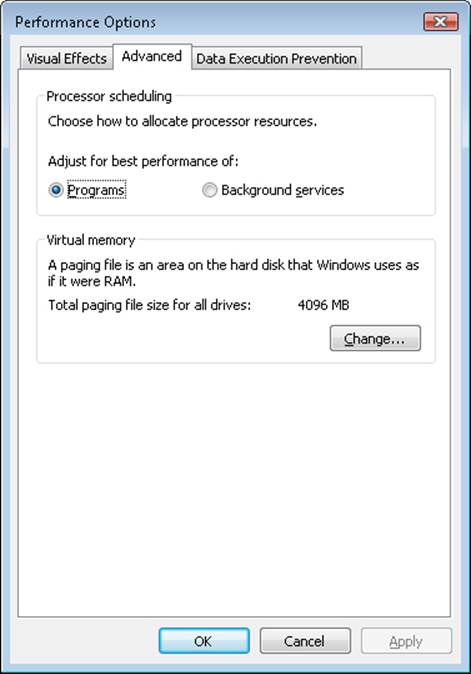
Figure 5-18. Quantum configuration in the Performance Options dialog box
The Programs setting designates the use of short, variable quantums—the default for client versions of Windows. If you install Terminal Services on a server system and configure the server as an application server, this setting is selected so that the users on the terminal server have the same quantum settings that would normally be set on a desktop or client system. You might also select this manually if you were running Windows Server as your desktop operating system.
The Background Services option designates the use of long, fixed quantums—the default for server systems. The only reason you might select this option on a workstation system is if you were using the workstation as a server system. However, because changes in this option take effect immediately, it might make sense to use it if the machine is about to run a background/server-style workload. For example, if a long-running computation, encoding or modeling simulation needs to run overnight, Background Services mode could be selected at night, and the system put back in Programs mode in the morning.
Finally, because Programs mode enables variable quantums, let us now explain what controls their variability.
Variable Quantums
When variable quantums are enabled, the variable quantum table (PspVariableQuantums) is loaded into the PspForegroundQuantum table that is used by the PspComputeQuantum function. Its algorithm will pick the appropriate quantum index based on whether or not the process is a foreground process (that is, whether it contains the thread that owns the foreground window on the desktop). If this is not the case, an index of zero is chosen, which corresponds to the default thread quantum described earlier. If it is a foreground process, the quantum index corresponds to the priority separation.
This priority separation value determines the priority boost (described in a later section of this chapter) that the scheduler will apply to foreground threads, and it is thus paired with an appropriate extension of the quantum: for each extra priority level (up to 2), another quantum is given to the thread. For example, if the thread receives a boost of one priority level, it receives an extra quantum as well. By default, Windows sets the maximum possible priority boost to foreground threads, meaning that the priority separation will be 2, therefore selecting quantum index 2 in the variable quantum table, leading to the thread receiving two extra quantums, for a total of 3 quantums.
Table 5-5 describes the exact quantum value (recall that this is stored in a unit representing 1/3rd of a clock tick) that will be selected based on the quantum index and which quantum configuration is in use.
Table 5-5. Quantum Values
|
Short Quantum Index |
Long Quantum Index |
|||||
|
Variable |
6 |
12 |
18 |
12 |
24 |
36 |
|
Fixed |
18 |
18 |
18 |
36 |
36 |
36 |
Thus, when a window is brought into the foreground on a client system, all the threads in the process containing the thread that owns the foreground window have their quantums tripled: threads in the foreground process run with a quantum of 6 clock ticks, whereas threads in other processes have the default client quantum of 2 clock ticks. In this way, when you switch away from a CPU-intensive process, the new foreground process will get proportionally more of the CPU, because when its threads run they will have a longer turn than background threads (again, assuming the thread priorities are the same in both the foreground and background processes).
Quantum Settings Registry Value
The user interface to control quantum settings described earlier modifies the registry value HKLM\SYSTEM\CurrentControlSet\Control\PriorityControl\Win32PrioritySeparation. In addition to specifying the relative length of thread quantums (short or long), this registry value also defines whether or not variable quantums should be used, as well as the priority separation (which, as you’ve seen, will determine the quantum index used when variable quantums are enabled). This value consists of 6 bits divided into the three 2-bit fields shown in Figure 5-19.
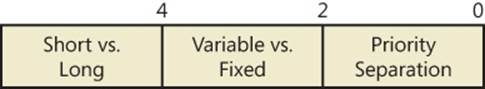
Figure 5-19. Fields of the Win32PrioritySeparation registry value
The fields shown in Figure 5-19 can be defined as follows:
§ Short vs. Long. A value of 1 specifies long quantums, and 2 specifies short ones. A setting of 0 or 3 indicates that the default appropriate for the system will be used (short for client systems, long for server systems).
§ Variable vs. Fixed. A setting of 1 means to enable the variable quantum table based on the algorithm shown in the Variable Quantums section. A setting of 0 or 3 means that the default appropriate for the system will be used (variable for client systems, fixed for server systems).
§ Priority Separation. This field (stored in the kernel variable PsPrioritySeparation) defines the priority separation (up to 2) as explained in the Variable Quantums section.
Note that when you’re using the Performance Options dialog box (which was shown in Figure 5-18), you can choose from only two combinations: short quantums with foreground quantums tripled, or long quantums with no quantum changes for foreground threads. However, you can select other combinations by modifying the Win32PrioritySeparation registry value directly.
Note that the threads part of a process running in the idle process priority class always receive a single thread quantum (2 clock ticks), ignoring any sort of quantum configuration settings, whether set by default or set through the registry.
On Windows Server systems configured as applications servers, the initial value of the Win32PrioritySeparation registry value will be hex 26, which is identical to the value set by the Optimize Performance For Programs option in the Performance Options dialog box. This selects quantum and priority boost behavior like that on Windows client systems, which is appropriate for a server primarily used to host users’ applications.
On Windows client systems and on servers not configured as application servers, the initial value of the Win32PrioritySeparation registry value will be 2. This provides values of 0 for the Short vs. Long and Variable vs. Fixed bit fields, relying on the default behavior of the system (depending on whether it is a client system or a server system) for these options, but it provides a value of 2 for the Priority Separation field. Once the registry value has been changed by use of the Performance Options dialog box, it cannot be restored to this original value other than by modifying the registry directly.
EXPERIMENT: EFFECTS OF CHANGING THE QUANTUM CONFIGURATION
Using a local debugger (Kd or WinDbg), you can see how the two quantum configuration settings, Programs and Background Services, affect the PsPrioritySeparation and PspForegroundQuantum tables, as well as modify the QuantumReset value of threads on the system. Take the following steps:
1. Open the System utility in Control Panel (or right-click on your computer name’s icon on the desktop, and choose Properties). Click the Advanced System Settings label, click on the Advanced tab, click the Settings button in the Performance section, and finally click on the Advanced tab. Select the Programs option, and click Apply. Keep this window open for the duration of the experiment.
2. Dump the values of PsPrioritySeparation and PspForegroundQuantum, as shown here. The values shown are what you should see on a Windows system after making the change in step 1. Notice how the variable, short quantum table is being used, and that a priority boost of 2 will apply to foreground applications:
3. lkd> dd PsPrioritySeparation L1
4. 81d3101c 00000002
5. lkd> db PspForegroundQuantum L3
6. 81d0946c 06 0c 12
...
7. Now take a look at the QuantumReset value of any process on the system. As described earlier, this is the default, full quantum of each thread on the system when it is replenished. This value is cached into each thread of the process, but the KPROCESS structure is easier to look at. Notice in this case it is 6, because WinDbg, like most other applications, gets the quantum set in the first entry of the PspForegroundQuantum table:
8. lkd> .process
9. Implicit process is now 85b32d90
10.lkd> dt nt!_KPROCESS 85b32d90 QuantumReset
11.nt!_KPROCESS
+0x061 QuantumReset : 6 ''
12. Now change the Performance option to Background Services in the dialog box you opened in step 1.
13. Repeat the commands shown in steps 2 and 3. You should see the values change in a manner consistent with our discussion in this section:
14.lkd> dd nt!PsPrioritySeparation L1
15.81d3101c 00000000
16.lkd> db nt!PspForegroundQuantum L3
17.81d0946c 24 24 24 $$$
18.lkd> dt nt!_KPROCESS 85b32d90 QuantumReset
19.nt!_KPROCESS
+0x061 QuantumReset : 36 '$'
Priority Boosts
The Windows scheduler periodically adjusts the current priority of threads through an internal priority-boosting mechanism. In many cases, it does so for decreasing various latencies (that is, to make threads respond faster to the events they are waiting on) and increasing responsiveness. In others, it applies these boosts to prevent inversion and starvation scenarios. Here are some of the boost scenarios that will be described in this section (and their purpose):
§ Boosts due to scheduler/dispatcher events (latency reduction)
§ Boosts due to I/O completion (latency reduction)
§ Boosts due to UI input (latency reduction/responsiveness)
§ Boosts due to a thread waiting on an executive resource for too long (starvation avoidance)
§ Boosts when a thread that’s ready to run hasn’t been running for some time (starvation and priority-inversion avoidance)
Like any scheduling algorithms, however, these adjustments aren’t perfect, and they might not benefit all applications.
NOTE
Windows never boosts the priority of threads in the real-time range (16 through 31). Therefore, scheduling is always predictable with respect to other threads in the real-time range. Windows assumes that if you’re using the real-time thread priorities, you know what you’re doing.
Client versions of Windows also include another pseudo-boosting mechanism that occurs during multimedia playback. Unlike the other priority boosts, which are applied directly by kernel code, multimedia playback boosts are actually managed by a user-mode service called the MultiMedia Class Scheduler Service (MMCSS), but they are not really boosts—the service merely sets new base priorities for the threads as needed (by calling the user-mode native API to change thread priorities). Therefore, none of the rules regarding boosts apply. We’ll first cover the typical kernel-managed priority boosts and then talk about MMCSS and the kind of “boosting” it performs.
Boosts Due to Scheduler/Dispatcher Events
Whenever a dispatch event occurs, the KiExitDispatcher routine is called, whose job it is to process the deferred ready list by calling KiProcessThreadWaitList and then call KiCheckForThreadDispatch to check whether any threads on the local processor should not be scheduled. Whenever such an event occurs, the caller can also specify which type of boost should be applied to the thread, as well as what priority increment the boost should be associated with. The following scenarios are considered as AdjustUnwait dispatch events because they deal with a dispatcher object entering a signaled state, which might cause one or more threads to wake up:
§ An APC is queued to a thread.
§ An event is set or pulsed.
§ A timer was set, or the system time was changed, and timers had to be reset.
§ A mutex was released or abandoned.
§ A process exited.
§ An entry was inserted in a queue, or the queue was flushed.
§ A semaphore was released.
§ A thread was alerted, suspended, resumed, frozen, or thawed.
§ A primary UMS thread is waiting to switch to a scheduled UMS thread.
For scheduling events associated with a public API (such as SetEvent), the boost increment applied is specified by the caller. Windows recommends certain values to be used by developers, which will be described later. For alerts, a boost of 2 is applied, because the alert API does not have a parameter allowing a caller to set a custom increment.
The scheduler also has two special AdjustBoost dispatch events, which are part of the lock ownership priority mechanism. These boosts attempt to fix situations in which a caller that owns the lock at priority X ends up releasing the lock to a waiting thread at priority <= X. In this situation, the new owner thread must wait for its turn (if running at priority X), or worse, it might not even get to run at all if its priority is lower than X. This entails the releasing thread continuing its execution, even though it should have caused the new owner thread to wake up and take control of the processor. The following two dispatcher events cause an AdjustBoost dispatcher exit:
§ An event is set through the KeSetEventBoostPriority interface, which is used by the ERESOURCE reader-writer kernel lock
§ A gate is set through the KeSignalGateBoostPriority interface, which is used by various internal mechanisms when releasing a gate lock.
Unwait Boosts
Unwait boosts attempt to decrease the latency between a thread waking up due to an object being signaled (thus entering the Ready state) and the thread actually beginning its execution to process the unwait (thus entering the Running state). Because the event that the thread is waiting on could give some sort of information about, say, the state of available memory at the moment, it is important for this state not to change behind the scenes while the thread is still stuck in the Ready state—otherwise, it might become irrelevant or incorrect once the thread does start running.
The various Windows header files specify recommended values that kernel-mode callers of APIs such as KeSetEvent and KeReleaseSemaphore should use, which correspond to definitions such as MUTANT_INCREMENT and EVENT_INCREMENT. These definitions have always been set to 1 in the headers, so it is safe to assume that most unwaits on these objects result in a boost of 1. In the user-mode API, an increment cannot be specified, nor do the native system calls such as NtSetEvent have parameters to specify such a boost. Instead, when these APIs call the underlying Ke interface, they use the default _INCREMENT definition automatically. This is also the case when mutexes are abandoned or timers are reset due to a system time change: the system uses the default boost that normally would’ve been applied when the mutex would have been released. Finally, the APC boost is completely up to the caller. Soon, you’ll see a specific usage of the APC boost related to I/O completion.
NOTE
Some dispatcher objects don’t have boosts associated with them. For example, when a timer is set or expires, or when a process is signaled, no boost is applied.
All these boosts of +1 attempt to solve the initial problem by making the assumption that both the releasing and waiting threads are running at the same priority. By boosting the waiting thread by one priority level, the waiting thread should preempt the releasing thread as soon as the operation completes. Unfortunately on uniprocessor systems, if this assumption does not hold, the boost might not do much: if the waiting thread is waiting at priority 4 vs. the releasing thread at priority 8, waiting at priority 5 won’t do much to reduce latency and force preemption. On multiprocessor systems, however, due to the stealing and balancing algorithms, this higher priority thread may have a higher chance to get picked up by another logical processor. This reality is due to a design choice made in the initial NT architecture, which is not to track lock ownership (except a few locks). That means the scheduler can’t be sure who really owns an event, and if it’s really being used as a lock. Even with lock ownership tracking, ownership is not usually passed in order to avoid convoy issues, other than in the ERESOURCE case which we’ll explain below.
However, for certain kinds of lock objects using events or gates as their underlying synchronization object, the lock ownership boost resolves the dilemma. Also, due to the processor-distribution and load-balancing schemes you’ll see later, on a multiprocessor machine, the ready thread might get picked up on another processor, and its high priority might increase the chances of it running on that secondary processor instead.
Lock Ownership Boosts
Because the executive-resource (ERESOURCE) and critical-section locks use underlying dispatcher objects, releasing these locks results in an unwait boost as described earlier. On the other hand, because the high-level implementation of these objects does track the owner of the lock, the kernel can make a more informed decision as to what kind of boost should be applied, by using the AdjustBoost reason. In these kinds of boosts, AdjustIncrement is set to the current priority of the releasing (or setting) thread, minus any GUI foreground separation boost, and before the KiExitDispatcher function is called, KiRemoveBoostThread is called by the event and gate code to return the releasing thread back to its regular priority (through the KiComputeNewPriority function). This step is needed to avoid a lock convoy situation, in which two threads repeatedly passing the lock between one another get ever-increasing boosts.
Note that pushlocks, which are unfair locks because ownership of the lock in a contended acquisition path is not predictable (rather, it’s random, just like a spinlock), do not apply priority boosts due to lock ownership. This is because doing so only contributes to preemption and priority proliferation, which isn’t required because the lock becomes immediately free as soon as it is released (bypassing the normal wait/unwait path).
Other differences between the lock ownership boost and the unwait boost will be exposed in the way that the scheduler actually applies boosting, which is the upcoming topic after this section.
Priority Boosting After I/O Completion
Windows gives temporary priority boosts upon completion of certain I/O operations so that threads that were waiting for an I/O have more of a chance to run right away and process whatever was being waited for. Although you’ll find recommended boost values in the Windows Driver Kit (WDK) header files (by searching for “#define IO” in Wdm.h or Ntddk.h), the actual value for the boost is up to the device driver. (These values are listed in Table 5-6.) It is the device driver that specifies the boost when it completes an I/O request on its call to the kernel function, IoCompleteRequest. In Table 5-6, notice that I/O requests to devices that warrant better responsiveness have higher boost values.
Table 5-6. Recommended Boost Values
|
Device |
Boost |
|
Disk, CD-ROM, parallel, video |
1 |
|
Network, mailslot, named pipe, serial |
2 |
|
Keyboard, mouse |
6 |
|
Sound |
8 |
NOTE
You might intuitively expect “better responsiveness” from your video card or disk than a boost of 1, but in fact, the kernel is trying to optimize for latency, which some devices (as well as human sensory inputs) are more sensitive to than others. To give you an idea, a sound card expects data around every 1 ms to play back music without perceptible glitches, while a video card needs to output at only 24 frames per second, or once every 40 ms, before the human eye can notice glitches.
As hinted earlier, these I/O completion boosts rely on the unwait boosts seen in the previous section. In Chapter 8 of Part 2, the mechanism of I/O completion will be shown in depth. For now, the important detail is that the kernel implements the signaling code in theIoCompleteRequest API through the use of either an APC (for asynchronous I/O) or through an event (for synchronous I/O). When a driver passes in, for example, IO_DISK_INCREMENT to IoCompleteRequest for an asynchronous disk read, the kernel calls KeInsertQueueApc with the boost parameter set to IO_DISK_INCREMENT. In turn, when the thread’s wait is broken due to the APC, it receives a boost of 1.
Be aware that the boost values given in the previous table are merely recommendations by Microsoft—driver developers are free to ignore them if they choose to do so, and certain specialized drivers can use their own values. For example, a driver handling ultrasound data from a medical device, which must notify a user-mode visualization application of new data, would probably use a boost value of 8 as well, to satisfy the same latency as a sound card.
In most cases, however, due to the way Windows driver stacks are built (again, see Chapter 8, “I/O System,” in Part 2 for more information), driver developers often write minidrivers, which call into a Microsoft-owned driver that supplies its own boost to IoCompleteRequest. For example, RAID or SATA controller card developers would typically call StorPortCompleteRequest to complete processing their requests. This call does not have any parameter for a boost value, because the Storport.sys driver fills in the right value when calling the kernel.
Additionally, in newer versions of Windows, whenever any file system driver (identified by setting its device type to FILE_DEVICE_DISK_FILE_SYSTEM or FILE_DEVICE_NETWORK_FILE_SYSTEM) completes its request, a boost of IO_DISK_INCREMENT is always applied if the driver passed in IO_NO_INCREMENT instead. So this boost value has become less of a recommendation and more of a requirement enforced by the kernel.
Boosts During Waiting on Executive Resources
When a thread attempts to acquire an executive resource (ERESOURCE; see Chapter 3 for more information on kernel-synchronization objects) that is already owned exclusively by another thread, it must enter a wait state until the other thread has released the resource. To limit the risk of deadlocks, the executive performs this wait in intervals of five seconds instead of doing an infinite wait on the resource.
At the end of these five seconds, if the resource is still owned, the executive attempts to prevent CPU starvation by acquiring the dispatcher lock, boosting the owning thread or threads to 14 (only if the original owner priority is less than the waiter’s and not already 14), resetting their quantums, and performing another wait.
Because executive resources can be either shared or exclusive, the kernel first boosts the exclusive owner and then checks for shared owners and boosts all of them. When the waiting thread enters the wait state again, the hope is that the scheduler will schedule one of the owner threads, which will have enough time to complete its work and release the resource. Note that this boosting mechanism is used only if the resource doesn’t have the Disable Boost flag set, which developers can choose to set if the priority-inversion mechanism described here works well with their usage of the resource.
Additionally, this mechanism isn’t perfect. For example, if the resource has multiple shared owners, the executive boosts all those threads to priority 14, resulting in a sudden surge of high-priority threads on the system, all with full quantums. Although the initial owner thread will run first (because it was the first to be boosted and therefore is first on the ready list), the other shared owners will run next, because the waiting thread’s priority was not boosted. Only after all the shared owners have had a chance to run and their priority has been decreased below the waiting thread will the waiting thread finally get its chance to acquire the resource. Because shared owners can promote or convert their ownership from shared to exclusive as soon as the exclusive owner releases the resource, it’s possible for this mechanism not to work as intended.
Priority Boosts for Foreground Threads After Waits
As will be shortly described, whenever a thread in the foreground process completes a wait operation on a kernel object, the kernel boosts its current (not base) priority by the current value of PsPrioritySeparation. (The windowing system is responsible for determining which process is considered to be in the foreground.) As described in the section on quantum controls, PsPrioritySeparation reflects the quantum-table index used to select quantums for the threads of foreground applications. However, in this case, it is being used as a priority boost value.
The reason for this boost is to improve the responsiveness of interactive applications—by giving the foreground application a small boost when it completes a wait, it has a better chance of running right away, especially when other processes at the same base priority might be running in the background.
EXPERIMENT: WATCHING FOREGROUND PRIORITY BOOSTS AND DECAYS
Using the CPU Stress tool (downloadable from http://live.sysinternals.com/WindowsInternals), you can watch priority boosts in action. Take the following steps:
1. Open the System utility in Control Panel (or right-click on your computer name’s icon on the desktop, and choose Properties). Click the Advanced System Settings label, click on the Advanced tab, click the Settings button in the Performance section, and finally click on the Advanced tab. Select the Programs option. This causes PsPrioritySeparation to get a value of 2.
2. Run Cpustres.exe, and change the activity of thread 1 from Low to Busy.
3. Start the Performance tool by selecting Programs from the Start menu and then selecting Performance Monitor from the Administrative Tools menu. Click on the Performance Monitor entry under Monitoring Tools.
4. Click the Add Counter toolbar button (or press Ctrl+I) to bring up the Add Counters dialog box.
5. Select the Thread object, and then select the % Processor Time counter.
6. In the Instances box, select <All Instances> and click Search. Scroll down until you see the CPUSTRES process. Select the second thread (thread 1). (The first thread is the GUI thread.) You should see something like this:
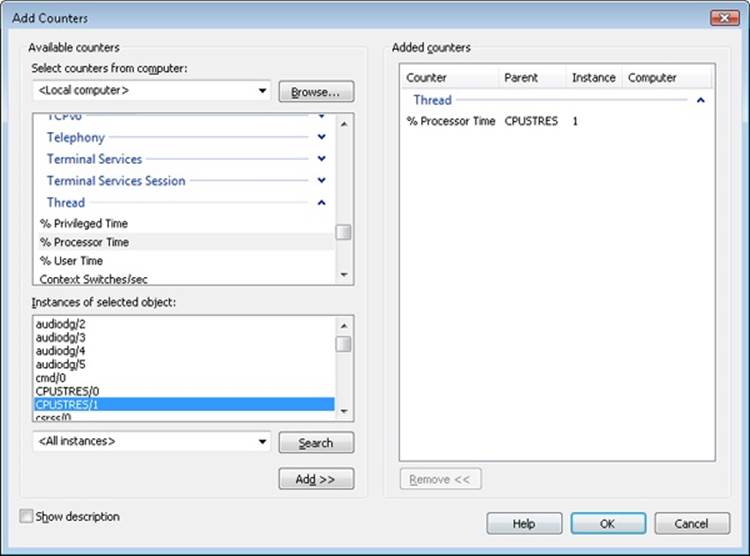
7. Click the Add button, and then click OK.
8. Select Properties from the Action menu. Change the Vertical Scale Maximum to 16 on the Graph tab, and set the interval to 1 in Sample Every box of the Graph Elements area on the General tab.
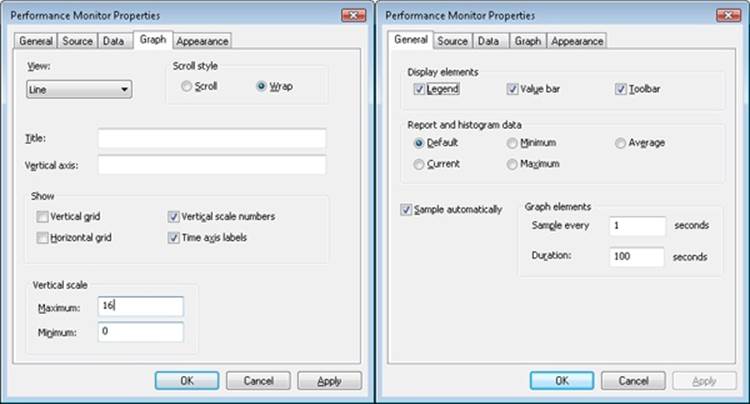
9. Now bring the CPUSTRES process to the foreground. You should see the priority of the CPUSTRES thread being boosted by 2 and then decaying back to the base priority as follows:
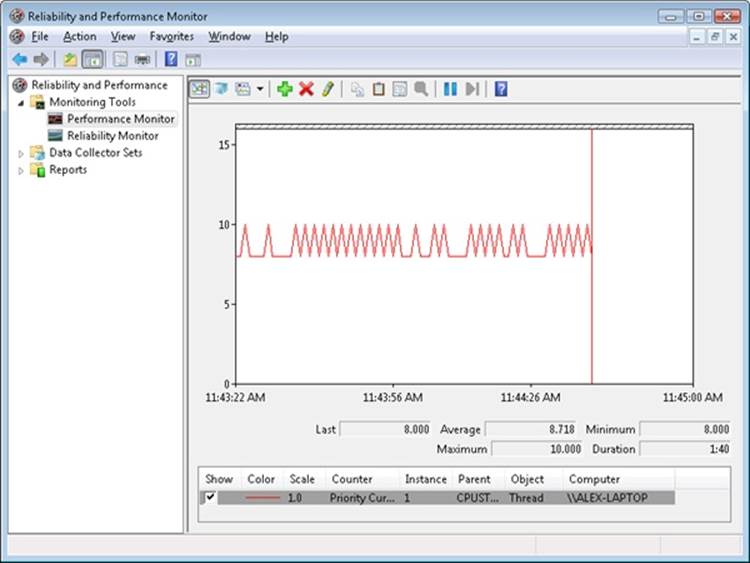
10. The reason CPUSTRES receives a boost of 2 periodically is because the thread you’re monitoring is sleeping about 25 percent of the time and then waking up. (This is the Busy Activity level). The boost is applied when the thread wakes up. If you set the Activity level to Maximum, you won’t see any boosts because Maximum in CPUSTRES puts the thread into an infinite loop. Therefore, the thread doesn’t invoke any wait functions and, as a result, doesn’t receive any boosts.
11. When you’ve finished, exit Performance Monitor and CPU Stress.
Priority Boosts After GUI Threads Wake Up
Threads that own windows receive an additional boost of 2 when they wake up because of windowing activity such as the arrival of window messages. The windowing system (Win32k.sys) applies this boost when it calls KeSetEvent to set an event used to wake up a GUI thread. The reason for this boost is similar to the previous one—to favor interactive applications.
EXPERIMENT: WATCHING PRIORITY BOOSTS ON GUI THREADS
You can also see the windowing system apply its boost of 2 for GUI threads that wake up to process window messages by monitoring the current priority of a GUI application and moving the mouse across the window. Just follow these steps:
1. Open the System utility in Control Panel (or right-click on your computer name’s icon on the desktop, and choose Properties). Click the Advanced System Settings label, click on the Advanced tab, click the Settings button in the Performance section, and finally click on the Advanced tab. Be sure that the Programs option is selected. This causes PsPrioritySeparation to get a value of 2.
2. Run Notepad from the Start menu by selecting All Programs/Accessories/Notepad.
3. Start the Performance tool by selecting Programs from the Start menu and then selecting Performance Monitor from the Administrative Tools menu. Click on the Performance Monitor entry under Monitoring Tools.
4. Click the Add Counter toolbar button (or press Ctrl+N) to bring up the Add Counters dialog box.
5. Select the Thread object, and then select the Priority Current counter.
6. In the Instances box, type Notepad, and then click Search. Scroll down until you see Notepad/0. Click it, click the Add button, and then click OK.
7. As in the previous experiment, select Properties from the Action menu. Change the Vertical Scale Maximum to 16 on the Graph tab, set the interval to 1 in Sample Every box of the Graph Elements area of the General tab, and click OK.
8. You should see the priority of thread 0 in Notepad at 8 or 10. Because Notepad entered a wait state shortly after it received the boost of 2 that threads in the foreground process receive, it might not yet have decayed from 10 to 8.
9. With Performance Monitor in the foreground, move the mouse across the Notepad window. (Make both windows visible on the desktop.) You’ll see that the priority sometimes remains at 10 and sometimes at 9, for the reasons just explained. (The reason you won’t likely catch Notepad at 8 is that it runs so little after receiving the GUI thread boost of 2 that it never experiences more than one priority level of decay before waking up again because of additional windowing activity and receiving the boost of 2 again.)
10. Now bring Notepad to the foreground. You should see the priority rise to 12 and remain there (or drop to 11, because it might experience the normal priority decay that occurs for boosted threads on the quantum end) because the thread is receiving two boosts: the boost of 2 applied to GUI threads when they wake up to process windowing input, and an additional boost of 2 because Notepad is in the foreground.
11. If you then move the mouse over Notepad (while it’s still in the foreground), you might see the priority drop to 11 (or maybe even 10) as it experiences the priority decay that normally occurs on boosted threads as they complete their turn. However, the boost of 2 that is applied because it’s the foreground process remains as long as Notepad remains in the foreground.
12. When you’ve finished, exit Performance Monitor and Notepad.
Priority Boosts for CPU Starvation
Imagine the following situation: you have a priority 7 thread that’s running, preventing a priority 4 thread from ever receiving CPU time; however, a priority 11 thread is waiting for some resource that the priority 4 thread has locked. But because the priority 7 thread in the middle is eating up all the CPU time, the priority 4 thread will never run long enough to finish whatever it’s doing and release the resource blocking the priority 11 thread. What does Windows do to address this situation?
You previously saw how the executive code responsible for executive resources manages this scenario by boosting the owner threads so that they can have a chance to run and release the resource. However, executive resources are only one of the many synchronization constructs available to developers, and the boosting technique will not apply to any other primitive. Therefore, Windows also includes a generic CPU starvation-relief mechanism as part of a thread called the balance set manager (a system thread that exists primarily to perform memory-management functions and is described in more detail in Chapter 10 of Part 2).
Once per second, this thread scans the ready queues for any threads that have been in the ready state (that is, haven’t run) for approximately 4 seconds. If it finds such a thread, the balance-set manager boosts the thread’s priority to 15 and sets the quantum target to an equivalent CPU clock cycle count of 3 quantum units. Once the quantum expires, the thread’s priority decays immediately to its original base priority. If the thread wasn’t finished and a higher priority thread is ready to run, the decayed thread returns to the ready queue, where it again becomes eligible for another boost if it remains there for another 4 seconds.
The balance-set manager doesn’t actually scan all of the ready threads every time it runs. To minimize the CPU time it uses, it scans only 16 ready threads; if there are more threads at that priority level, it remembers where it left off and picks up again on the next pass. Also, it will boost only 10 threads per pass—if it finds 10 threads meriting this particular boost (which indicates an unusually busy system), it stops the scan at that point and picks up again on the next pass.
NOTE
We mentioned earlier that scheduling decisions in Windows are not affected by the number of threads and that they are made in constant time, or O(1). Because the balance-set manager needs to scan ready queues manually, this operation depends on the number of threads on the system, and more threads will require more scanning time. However, the balance-set manager is not considered part of the scheduler or its algorithms and is simply an extended mechanism to increase reliability. Additionally, because of the cap on threads and queues to scan, the performance impact is minimized and predictable in a worst-case scenario.
Will this algorithm always solve the priority-inversion issue? No—it’s not perfect by any means. But over time, CPU-starved threads should get enough CPU time to finish whatever processing they were doing and re-enter a wait state.
EXPERIMENT: WATCHING PRIORITY BOOSTS FOR CPU STARVATION
Using the CPU Stress tool, you can watch priority boosts in action. In this experiment, you’ll see CPU usage change when a thread’s priority is boosted. Take the following steps:
1. Run Cpustres.exe. Change the activity level of the active thread (by default, Thread 1) from Low to Maximum. Change the thread priority from Normal to Below Normal. The screen should look like this:
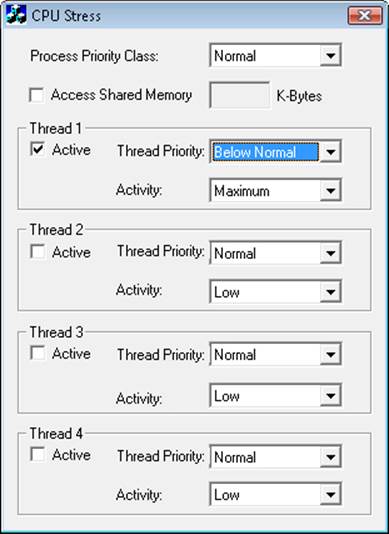
2. Start the Performance tool by selecting Programs from the Start menu and then selecting Performance Monitor from the Administrative Tools menu. Click on the Performance Monitor entry under Monitoring Tools.
3. Click the Add Counter toolbar button (or press Ctrl+N) to bring up the Add Counters dialog box.
4. Select the Thread object, and then select the Priority Current counter.
5. In the Instances box, type CPUSTRES, and then click Search. Scroll down until you see the second thread (thread 1). (The first thread is the GUI thread.) You should see something like this:
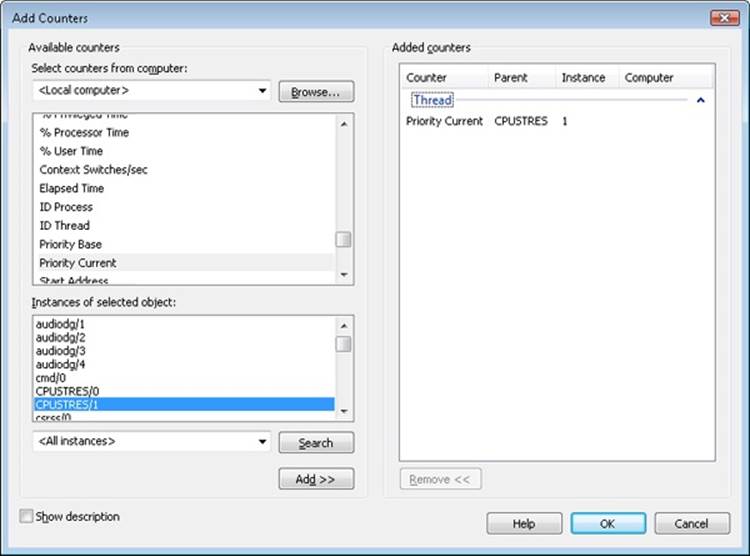
6. Click the Add button, and then click OK.
7. Raise the priority of Performance Monitor to real time by running Task Manager, clicking on the Processes tab, and selecting the Mmc.exe process. Right-click the process, select Set Priority, and then select Realtime. (If you receive a Task Manager Warning message box warning you of system instability, click the Yes button.) If you have a multiprocessor system, you also need to change the affinity of the process: right-click and select Set Affinity. Then clear all other CPUs except for CPU 0.
8. Run another copy of CPU Stress. In this copy, change the activity level of Thread 1 from Low to Maximum.
9. Now switch back to Performance Monitor. You should see CPU activity every six or so seconds because the thread is boosted to priority 15. You can force updates to occur more frequently than every second by pausing the display with Ctrl+F, and then pressing Ctrl+U, which forces a manual update of the counters. Keep Ctrl+U pressed for continual refreshes.
When you’ve finished, exit Performance Monitor and the two copies of CPU Stress.
EXPERIMENT: “LISTENING” TO PRIORITY BOOSTING
To “hear” the effect of priority boosting for CPU starvation, perform the following steps on a system with a sound card:
1. Because of MMCSS’ priority boosts (which we will describe in the next subsection), you need to stop the MultiMedia Class Scheduler Service by opening the Services management interface (Start, Programs, Administrative Tools, Services).
2. Run Windows Media Player (or some other audio-playback program), and begin playing some audio content.
3. Run Cpustres, and set the activity level of Thread 1 to Maximum.
4. Use Task Manager to set the affinities of both Windows Media Player and Cpustres to a single CPU.
5. Raise the priority of Thread 1 of Cpustres from Normal to Time Critical.
6. You should hear the music playback stop as the computer-bound thread begins consuming all available CPU time.
7. Every so often, you should hear bits of sound as the starved thread in the audio playback process gets boosted to 15 and runs enough to send more data to the sound card.
8. Stop Cpustres and Windows Media Player, and start the MMCSS service again.
Applying Boosts
Back in KiExitDispatcher, you saw that KiProcessThreadWaitList is called to process any threads in the deferred ready list. It is here that the boost information passed by the caller is processed. This is done by looping through each DeferredReady thread, unlinking its wait blocks (only Active and Bypassed blocks are unlinked), and then setting two key values in the kernel’s thread control block: AdjustReason and AdjustIncrement. The reason is one of the two Adjust possibilities seen earlier, and the increment corresponds to the boost value.KiDeferredReadyThread is then called, which makes the thread ready for execution, by running two algorithms: the quantum and priority selection algorithm, which you are about to see in two parts, and the processor selection algorithm, which is shown in its respective section later in this topic.
Let’s first look at when the algorithm applies boosts, which happens only in the cases where a thread is not in the real-time priority range.
For an AdjustUnwait boost, it will be applied only if the thread is not already experiencing an unusual boost and only if the thread has not disabled boosting by calling SetThreadPriorityBoost, which sets the DisableBoost flag in the KTHREAD. Another situation that can disable boosting in this case is if the kernel has realized that the thread actually exhausted its quantum (but the clock interrupt did not fire to consume it) and the thread came out of a wait that lasted less than two clock ticks.
If these situations are not currently true, the new priority of the thread will be computed by adding the AdjustIncrement to the thread’s current base priority. Additionally, if the thread is known to be part of a foreground process (meaning that the memory priority is set to MEMORY_PRIORITY_FOREGROUND, which is configured by Win32k.sys when focus changes), this is where the priorityseparation boost (PsPrioritySeparation) is applied by adding its value on top of the new priority. This is also known as the Foreground Priority boost, which was explained earlier.
Finally, the kernel checks whether this newly computed priority is higher than the current priority of the thread, and it limits this value to an upper bound of 15 to avoid crossing into the real-time range. It then sets this value as the thread’s new current priority. If any foreground separation boost was applied, it sets this value in the ForegroundBoost field of the KTHREAD, which results in a PriorityDecrement equal to the separation boost.
For AdjustBoost boosts, the kernel checks whether the thread’s current priority is lower than the AdjustIncrement (recall this is the priority of the setting thread) and whether the thread’s current priority is below 13. If so, and priority boosts have not been disabled for the thread, theAdjustIncrement priority is used as the new current priority, limited to a maximum of 13. Meanwhile, the UnusualBoost field of the KTHREAD contains the boost value, which results in a PriorityDecrement equal to the lock ownership boost.
In all cases where a PriorityDecrement is present, the quantum of the thread is also recomputed to be the equivalent of only one clock tick, based on the value of KiLockQuantumTarget. This ensures that foreground and unusual boosts will be lost after one clock tick instead of the usual two (or other configured value), as will be shown in the next section. This also happens when an AdjustBoost is requested but the thread is running at priority 13 or 14 or with boosts disabled.
After this work is complete, AdjustReason is now set to AdjustNone.
Removing Boosts
Removing boosts is done in KiDeferredReadyThread just as boosts and quantum recomputations are being applied (as shown in the previous section). The algorithm first begins by checking the type of adjustment being done.
For an AdjustNone scenario, which means the thread became ready due to perhaps a preemption, the thread’s quantum will be recomputed if it already hit its target but the clock interrupt has not yet noticed, as long as the thread was running at a dynamic priority level. Additionally, the thread’s priority will be recomputed. For an AdjustUnwait or AdjustBoost scenario on a non-real-time thread, the kernel checks whether the thread silently exhausted its quantum (just as in the prior section). If it did, or if the thread was running with a base priority of 14 or higher, or if no PriorityDecrement is present and the thread has completed a wait that lasted longer than two clock ticks, the quantum of the thread is recomputed, as is its priority.
Priority recomputation happens on non-real-time threads, and it’s done by taking the thread’s current priority, subtracting its foreground boost, subtracting is unusual boost (the combination of these last two items is the PriorityDecrement), and finally subtracting one. Finally, this new priority is bounded with the base priority as the lowest bound, and any existing priority decrement is zeroed out (clearing unusual and foreground boosts). This means that in the case of a lock ownership boost, or any of the unusual boosts explained, the entire boost value is now lost. On the other hand, for a regular AdjustUnwait boost, the priority naturally trickles down by one due to the subtraction by one. This lowering eventually stops when the base priority is hit due to the lower bound check.
There is another instance where boosts must be removed, which goes through the KiRemoveBoostThread function. This is a special-case boost removal, which occurs due to the lock-ownership boost rule, which specifies that the setting thread must lose its boost when donating its current priority to the waking thread (to avoid a lock convoy). It is also used to undo the boost due to targeted DPC-calls as well as the boost against ERESOURCE lock-starvation boost. The only special detail about this routine is that when computing the new priority, it takes special care to separate the ForegroundBoost vs. UnusualBoost components of the PriorityDecrement in order to maintain any GUI foreground-separation boost that the thread accumulated. This behavior, new to Windows 7, ensures that threads relying on the lock-ownership boost do not behave erratically when running in the foreground, or vice-versa.
Figure 5-20 displays an example of how normal boosts are removed from a thread as it experiences quantum end.
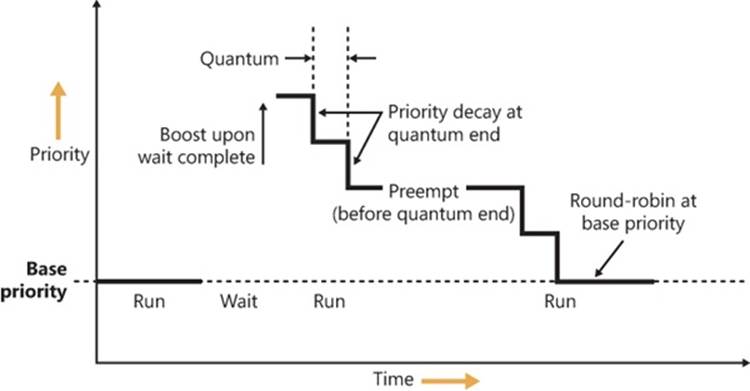
Figure 5-20. Priority boosting and decay
Priority Boosts for Multimedia Applications and Games
As you just saw in the last experiment, although Windows’ CPU-starvation priority boosts might be enough to get a thread out of an abnormally long wait state or potential deadlock, they simply cannot deal with the resource requirements imposed by a CPU-intensive application such as Windows Media Player or a 3D computer game.
Skipping and other audio glitches have been a common source of irritation among Windows users in the past, and the user-mode audio stack in Windows makes the situation worse because it offers even more chances for preemption. To address this, client versions of Windows incorporate a service (called MMCSS, described earlier in this chapter) whose purpose is to ensure glitch-free multimedia playback for applications that register with it.
MMCSS works by defining several tasks, including the following:
§ Audio
§ Capture
§ Distribution
§ Games
§ Playback
§ Pro Audio
§ Window Manager
NOTE
You can find the settings for MMCSS, including a lists of tasks (which can be modified by OEMs to include other specific tasks as appropriate) in the registry keys under HKLM\SOFTWARE\Microsoft\Windows NT\CurrentVersion\Multimedia\SystemProfile. Additionally, the SystemResponsiveness value allows you to fine-tune how much CPU usage MMCSS guarantees to low-priority threads.
In turn, each of these tasks includes information about the various properties that differentiate them. The most important one for scheduling is called the Scheduling Category, which is the primary factor determining the priority of threads registered with MMCSS. Table 5-7 shows the various scheduling categories.
Table 5-7. Scheduling Categories
|
Category |
Priority |
Description |
|
High |
23-26 |
Pro Audio threads running at a higher priority than any other thread on the system except for critical system threads |
|
Medium |
16-22 |
The threads part of a foreground application such as Windows Media Player |
|
Low |
8-15 |
All other threads that are not part of the previous categories |
|
Exhausted |
1-7 |
Threads that have exhausted their share of the CPU and will continue running only if no other higher priority threads are ready to run |
The main mechanism behind MMCSS boosts the priority of threads inside a registered process to the priority level matching their scheduling category and relative priority within this category for a guaranteed period of time. It then lowers those threads to the Exhausted category so that other, nonmultimedia threads on the system can also get a chance to execute.
By default, multimedia threads get 80 percent of the CPU time available, while other threads receive 20 percent (based on a sample of 10 ms; in other words, 8 ms and 2 ms, respectively). MMCSS itself runs at priority 27 because it needs to preempt any Pro Audio threads in order to lower their priority to the Exhausted category.
Keep in mind that the kernel still does the actual boosting of the values inside the KTHREAD (MMCSS simply makes the same kind of system call any other application would), and the scheduler is still in control of these threads. It is simply their high priority that makes them run almost uninterrupted on a machine, because they are in the real-time range and well above threads that most user applications run in.
As was discussed earlier, changing the relative thread priorities within a process does not usually make sense, and no tool allows this because only developers understand the importance of the various threads in their programs. On the other hand, because applications must manually register with MMCSS and provide it with information about what kind of thread this is, MMCSS does have the necessary data to change these relative thread priorities (and developers are well aware that this will be happening).
EXPERIMENT: “LISTENING” TO MMCSS PRIORITY BOOSTING
You’ll now perform the same experiment as the prior one but without disabling the MMCSS service. In addition, you’ll look at the Performance tool to check the priority of the Windows Media Player threads.
1. Run Windows Media Player (because other playback programs might not yet take advantage of the API calls required to register with MMCSS), and begin playing some audio content.
2. If you have a multiprocessor machine, be sure to set the affinity of the Wmplayer.exe process so that it runs on only one CPU (because you’ll use only one CPUSTRES worker thread).
3. Start the Performance tool by selecting Programs from the Start menu and then selecting Performance Monitor from the Administrative Tools menu. Click on the Performance Monitor entry under Monitoring Tools.
4. Click the Add Counter toolbar button (or press Ctrl+N) to bring up the Add Counters dialog box.
5. Select the Thread object, and then select the Priority Current.
6. In the Instances box, type Wmplayer, click Search, and then select all its threads. Click the Add button, and then click OK.
7. As in the previous experiment, select Properties from the Action menu. Change the Vertical Scale Maximum to 31 on the Graph tab, set the interval to 1 in Sample Every Seconds of the Graph Elements area on the General tab, and click OK.
You should see one or more priority 21 threads inside Wmplayer, which will be constantly running unless there is a higher-priority thread requiring the CPU after they are dropped to the Exhausted category.
8. Run Cpustres, and set the activity level of Thread 1 to Maximum.
9. Raise the priority of Thread 1 from Normal to Time Critical.
10. You should notice the system slowing down considerably, but the music playback will continue. Every so often, you’ll be able to get back some responsiveness from the rest of the system. Use this time to stop Cpustres.
11. If the Performance tool was unable to capture data during the time Cpustres ran, run it again, but use Highest instead of Time Critical. This change will slow down the system less, but it still requires boosting from MMCSS. Because once the multimedia thread is put in the Exhausted category there will always be a higher priority thread requesting the CPU (CPUSTRES), you should notice Wmplayer’s priority 21 thread drop every so often, as shown here:
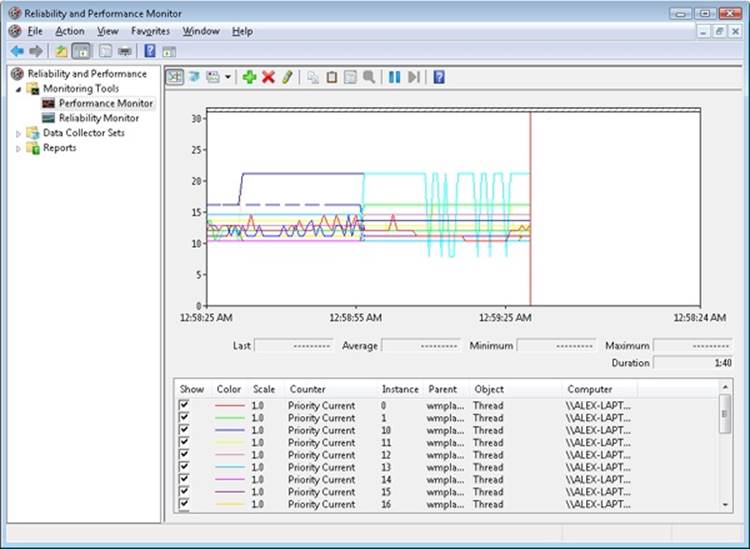
MMCSS’ functionality does not stop at simple priority boosting, however. Because of the nature of network drivers on Windows and the NDIS stack, deferred procedure calls (DPCs) are quite common mechanisms for delaying work after an interrupt has been received from the network card. Because DPCs run at an IRQL level higher than user-mode code (see Chapter 3 for more information on DPCs and IRQLs), long-running network card driver code can still interrupt media playback during network transfers or when playing a game, for example.
Therefore, MMCSS also sends a special command to the network stack, telling it to throttle network packets during the duration of the media playback. This throttling is designed to maximize playback performance, at the cost of some small loss in network throughput (which would not be noticeable for network operations usually performed during playback, such as playing an online game). The exact mechanisms behind it do not belong to any area of the scheduler, so we’ll leave them out of this description.
NOTE
The original implementation of the network throttling code had some design issues that caused significant network throughput loss on machines with 1000 Mbit network adapters, especially if multiple adapters were present on the system (a common feature of midrange motherboards). This issue was analyzed by the MMCSS and networking teams at Microsoft and later fixed.
Context Switching
A thread’s context and the procedure for context switching vary depending on the processor’s architecture. A typical context switch requires saving and reloading the following data:
§ Instruction pointer
§ Kernel stack pointer
§ A pointer to the address space in which the thread runs (the process’ page table directory)
The kernel saves this information from the old thread by pushing it onto the current (old thread’s) kernel-mode stack, updating the stack pointer, and saving the stack pointer in the old thread’s KTHREAD structure. The kernel stack pointer is then set to the new thread’s kernel stack, and the new thread’s context is loaded. If the new thread is in a different process, it loads the address of its page table directory into a special processor register so that its address space is available. (See the description of address translation in Chapter 10 in Part 2.) If a kernel APC that needs to be delivered is pending, an interrupt at IRQL 1 is requested. (For more information on APCs, see Chapter 3.) Otherwise, control passes to the new thread’s restored instruction pointer and the new thread resumes execution.
Scheduling Scenarios
Windows bases the question of “Who gets the CPU?” on thread priority, but how does this approach work in practice? The following sections illustrate just how priority-driven preemptive multitasking works on the thread level.
Voluntary Switch
First a thread might voluntarily relinquish use of the processor by entering a wait state on some object (such as an event, a mutex, a semaphore, an I/O completion port, a process, a thread, a window message, and so on) by calling one of the Windows wait functions (such asWaitForSingleObject or WaitForMultipleObjects). Waiting for objects is described in more detail in Chapter 3.
Figure 5-21 illustrates a thread entering a wait state and Windows selecting a new thread to run. In Figure 5-21, the top block (thread) is voluntarily relinquishing the processor so that the next thread in the ready queue can run (as represented by the halo it has when in the Running column). Although it might appear from this figure that the relinquishing thread’s priority is being reduced, it’s not—it’s just being moved to the wait queue of the objects the thread is waiting for.
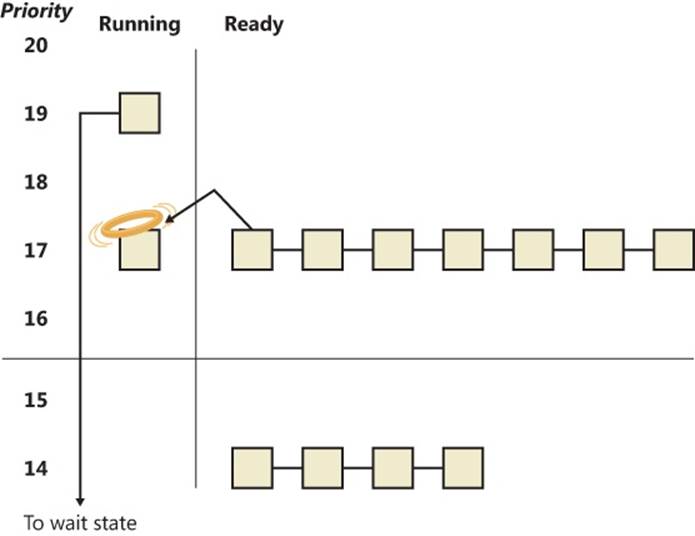
Figure 5-21. Voluntary switching
Preemption
In this scheduling scenario, a lower-priority thread is preempted when a higher-priority thread becomes ready to run. This situation might occur for a couple of reasons:
§ A higher-priority thread’s wait completes. (The event that the other thread was waiting for has occurred.)
§ A thread priority is increased or decreased.
In either of these cases, Windows must determine whether the currently running thread should still continue to run or whether it should be preempted to allow a higher-priority thread to run.
NOTE
Threads running in user mode can preempt threads running in kernel mode—the mode in which the thread is running doesn’t matter. The thread priority is the determining factor.
When a thread is preempted, it is put at the head of the ready queue for the priority it was running at. Figure 5-22 illustrates this situation.
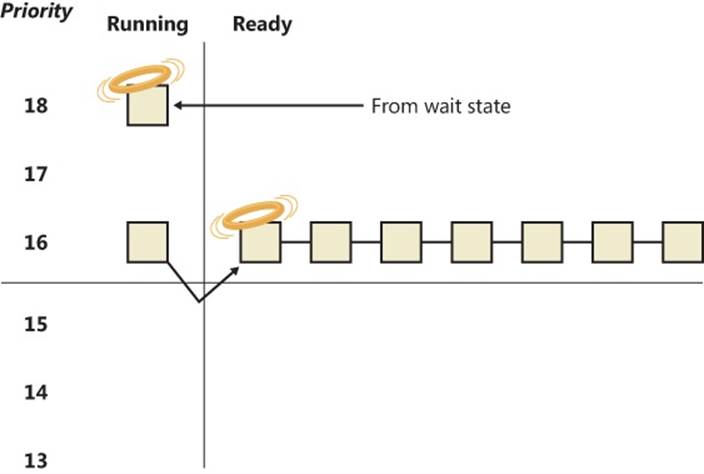
Figure 5-22. Preemptive thread scheduling
In Figure 5-22, a thread with priority 18 emerges from a wait state and repossesses the CPU, causing the thread that had been running (at priority 16) to be bumped to the head of the ready queue. Notice that the bumped thread isn’t going to the end of the queue but to the beginning; when the preempting thread has finished running, the bumped thread can complete its quantum.
Quantum End
When the running thread exhausts its CPU quantum, Windows must determine whether the thread’s priority should be decremented and then whether another thread should be scheduled on the processor.
If the thread priority is reduced, Windows looks for a more appropriate thread to schedule. (For example, a more appropriate thread would be a thread in a ready queue with a higher priority than the new priority for the currently running thread.) If the thread priority isn’t reduced and there are other threads in the ready queue at the same priority level, Windows selects the next thread in the ready queue at that same priority level and moves the previously running thread to the tail of that queue (giving it a new quantum value and changing its state from running to ready). This case is illustrated in Figure 5-23. If no other thread of the same priority is ready to run, the thread gets to run for another quantum.
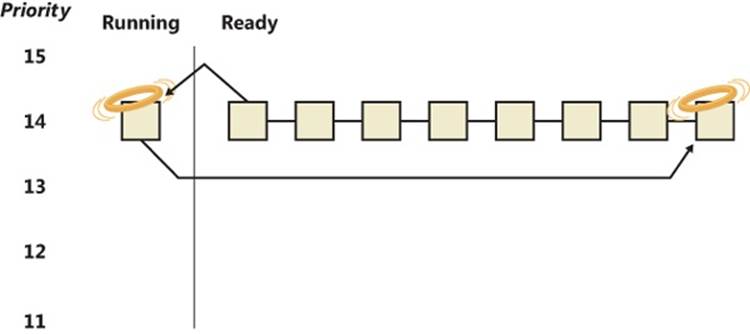
Figure 5-23. Quantum end thread scheduling
As you saw, instead of simply relying on a clock interval timer–based quantum to schedule threads, Windows uses an accurate CPU clock cycle count to maintain quantum targets. One factor we haven’t yet mentioned is that Windows also uses this count to determine whether quantum end is currently appropriate for the thread—something that might have happened previously and is important to discuss.
Using a scheduling model that relies only on the clock interval timer, the following situation can occur:
§ Threads A and B become ready to run during the middle of an interval. (Scheduling code runs not just at each clock interval, so this is often the case.)
§ Thread A starts running but is interrupted for a while. The time spent handling the interrupt is charged to the thread.
§ Interrupt processing finishes and thread A starts running again, but it quickly hits the next clock interval. The scheduler can assume only that thread A had been running all this time and now switches to thread B.
§ Thread B starts running and has a chance to run for a full clock interval (barring pre-emption or interrupt handling).
In this scenario, thread A was unfairly penalized in two different ways. First, the time it spent handling a device interrupt was accounted to its own CPU time, even though the thread probably had nothing to do with the interrupt. (Recall that interrupts are handled in the context of whichever thread was running at the time.) It was also unfairly penalized for the time the system was idling inside that clock interval before it was scheduled.
Figure 5-24 represents this scenario.
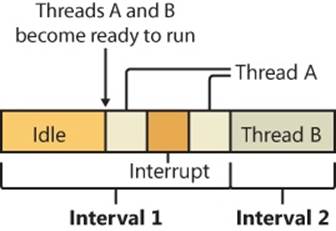
Figure 5-24. Unfair time slicing in previous versions of Windows
Because Windows keeps an accurate count of the exact number of CPU clock cycles spent doing work that the thread was scheduled to do (which means excluding interrupts), and because it keeps a quantum target of clock cycles that should have been spent by the thread at the end of its quantum, both of the unfair decisions that would have been made against thread A will not happen in Windows.
Instead, the following situation occurs:
§ Threads A and B become ready to run during the middle of an interval.
§ Thread A starts running but is interrupted for a while. The CPU clock cycles spent handling the interrupt are not charged to the thread.
§ Interrupt processing finishes and thread A starts running again, but it quickly hits the next clock interval. The scheduler looks at the number of CPU clock cycles charged to the thread and compares them to the expected CPU clock cycles that should have been charged at quantum end.
§ Because the former number is much smaller than it should be, the scheduler assumes that thread A started running in the middle of a clock interval and might have been additionally interrupted.
§ Thread A gets its quantum increased by another clock interval, and the quantum target is recalculated. Thread A now has its chance to run for a full clock interval.
§ At the next clock interval, thread A has finished its quantum, and thread B now gets a chance to run.
Figure 5-25 represents this scenario.
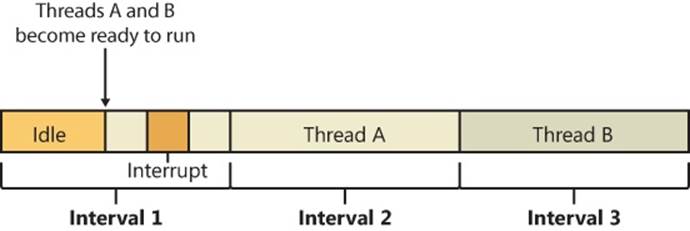
Figure 5-25. Fair time slicing in current versions of Windows
Termination
When a thread finishes running (either because it returned from its main routine, called ExitThread, or was killed with TerminateThread), it moves from the running state to the terminated state. If there are no handles open on the thread object, the thread is removed from the process thread list and the associated data structures are deallocated and released.
Idle Threads
When no runnable thread exists on a CPU, Windows dispatches that CPU’s idle thread. Each CPU has its own dedicated idle thread, because on a multiprocessor system one CPU can be executing a thread while other CPUs might have no threads to execute. Each CPU’s idle thread is found via a pointer in that CPU’s PRCB.
All of the idle threads belong to the idle process. The idle process and idle threads are special cases in many ways. They are, of course, represented by EPROCESS/KPROCESS and ETHREAD/KTHREAD structures, but they are not executive manager processes and thread objects. Nor is the idle process on the system process list. (This is why it does not appear in the output of the kernel debugger’s !process 0 0 command.) However, the idle thread or threads and their process can be found in other ways.
EXPERIMENT: DISPLAYING THE STRUCTURES OF THE IDLE THREADS AND IDLE PROCESS
The idle thread and process structures can be found in the kernel debugger via the !pcr command. “PCR” is short for “processor control region.” This command displays a subset of information from the PCR and also from the associated PRCB (processor control block). !pcr takes a single numeric argument, which is the number of the CPU whose PCR is to be displayed. The boot processor is processor number 0, and it is always present, so !pcr 0 should always work. The following output shows the results of this command from a memory dump taken from a 64-bit, four-processor system:
3: kd> !pcr 0
KPCR for Processor 0 at fffff800039fdd00:
Major 1 Minor 1
NtTib.ExceptionList: fffff80000b95000
NtTib.StackBase: fffff80000b96080
NtTib.StackLimit: 000000000008e2d8
NtTib.SubSystemTib: fffff800039fdd00
NtTib.Version: 00000000039fde80
NtTib.UserPointer: fffff800039fe4f0
NtTib.SelfTib: 000000007efdb000
SelfPcr: 0000000000000000
Prcb: fffff800039fde80
Irql: 0000000000000000
IRR: 0000000000000000
IDR: 0000000000000000
InterruptMode: 0000000000000000
IDT: 0000000000000000
GDT: 0000000000000000
TSS: 0000000000000000
CurrentThread: fffffa8007aa8060
NextThread: 0000000000000000
IdleThread: fffff80003a0bcc0
DpcQueue:
This output shows that CPU 0 was executing a thread other than its idle thread at the time the memory dump was obtained, because the CurrentThread and IdleThread pointers are different. (If you have a multi-CPU system you can try !pcr 1, !pcr 2, and so on, until you run out; observe that each IdleThread pointer is different.)
Now use the !thread command on the indicated idle thread address:
3: kd> !thread fffff80003a0bcc0
THREAD fffff80003a0bcc0 Cid 0000.0000 Teb: 0000000000000000 Win32Thread:
0000000000000000
RUNNING on processor 0
Not impersonating
DeviceMap fffff8a000008aa0
Owning Process fffff80003a0c1c0 Image: Idle
Attached Process fffffa800792a040 Image: System
Wait Start TickCount 50774016 Ticks: 12213 (0:00:03:10.828)
Context Switch Count 1147613282
UserTime 00:00:00.000
KernelTime 8 Days 07:21:56.656
Win32 Start Address nt!KiIdleLoop (0xfffff8000387f910)
Stack Init fffff80000b9cdb0 Current fffff80000b9cd40
Base fffff80000b9d000 Limit fffff80000b97000 Call 0
Priority 16 BasePriority 0 UnusualBoost 0 ForegroundBoost 0 IoPriority 0 PagePriority 0
Child-SP RetAddr : Args to Child [...]: Call Site
fffff800'00b9cd80 00000000'00000000 : fffff800'00b9d000 [...]: nt!KiIdleLoop+0x10d
Finally, use the !process command on the “Owning Process” shown in the preceding output. For brevity, we’ll add a second parameter value of 3, which causes !process to emit only minimal information for each thread:
3: kd> !process fffff80003a0c1c0 3
PROCESS fffff80003a0c1c0
SessionId: none Cid: 0000 Peb: 00000000 ParentCid: 0000
DirBase: 00187000 ObjectTable: fffff8a000001630 HandleCount: 1338.
Image: Idle
VadRoot fffffa8007846c00 Vads 1 Clone 0 Private 1. Modified 0. Locked 0.
DeviceMap 0000000000000000
Token fffff8a000004a40
ElapsedTime 00:00:00.000
UserTime 00:00:00.000
KernelTime 00:00:00.000
QuotaPoolUsage[PagedPool] 0
QuotaPoolUsage[NonPagedPool] 0
Working Set Sizes (now,min,max) (6, 50, 450) (24KB, 200KB, 1800KB)
PeakWorkingSetSize 6
VirtualSize 0 Mb
PeakVirtualSize 0 Mb
PageFaultCount 1
MemoryPriority BACKGROUND
BasePriority 0
CommitCharge 0
THREAD fffff80003a0bcc0 Cid 0000.0000 Teb: 0000000000000000 Win32Thread:
0000000000000000
RUNNING on processor 0
THREAD fffff8800310afc0 Cid 0000.0000 Teb: 0000000000000000 Win32Thread:
0000000000000000
RUNNING on processor 1
THREAD fffff8800317bfc0 Cid 0000.0000 Teb: 0000000000000000 Win32Thread:
0000000000000000
RUNNING on processor 2
THREAD fffff880031ecfc0 Cid 0000.0000 Teb: 0000000000000000 Win32Thread:
0000000000000000
RUNNING on processor 3
These process and thread addresses can be used with dt nt!_EPROCESS, dt nt!_KTHREAD, and other such commands as well.
The preceding experiment shows some of the anomalies associated with the idle process and its threads. The debugger indicates an “Image” name of “Idle” (which comes from the EPROCESS structure’s ImageFileName member), but various Windows utilities report the idle process using different names. Task Manager and Process Explorer call it System Idle Process, while Tlist calls it System Processes. The process ID and thread IDs (the “client IDs”, or “Cid” in the debugger’s output) are zero, as are the PEB and TEB pointers, and there are many other fields in the idle process or its threads that might be reported as 0. This occurs because the idle process has no user-mode address space and its threads execute no user-mode code, so they have no need of the various data needed to manage a user-mode environment. Also, the idle process is not an object-manager process object, and its idle threads are not object-manager thread objects. Instead, the initial idle thread and idle process structures are statically allocated and used to bootstrap the system before the process manager and the object manager are initialized. Subsequent idle thread structures are allocated dynamically (as simple allocations from nonpaged pool, bypassing the object manager) as additional processors are brought online. Once process management initializes, it uses the special variable PsIdleProcess to refer to the idle process.
Perhaps the most interesting anomaly regarding the idle process is that Windows reports the priority of the idle threads as 0 (16 on x64 systems, as shown earlier). In reality, however, the values of the idle threads’ priority members are irrelevant, because these threads are selected for dispatching only when there are no other threads to run. Their priority is never compared with that of any other thread, nor are they used to put an idle thread on a ready queue; idle threads are never part of any ready queues. (Remember, only one thread per Windows system is actually running at priority 0—the zero page thread, explained in Chapter 10 in Part 2.)
Just as the idle threads are special cases in terms of selection for execution, they are also special cases for preemption. The idle thread’s routine, KiIdleLoop, performs a number of operations that preclude its being preempted by another thread in the usual fashion. When no non-idle threads are available to run on a processor, that processor is marked as idle in its PRCB. After that, if a thread is selected for execution on the idle processor, the thread’s address is stored in the NextThread pointer of the idle processor’s PRCB. The idle thread checks this pointer on each pass through its loop.
Although some details of the flow vary between architectures, the basic sequence of operations of the idle thread is as follows:
1. Enables interrupts briefly, allowing any pending interrupts to be delivered, and then disables them again (using the STI and CLI instructions on x86 and x64 processors). This is desirable because significant parts of the idle thread execute with interrupts disabled.
2. On the debug build on some architectures, checks whether there is a kernel debugger trying to break into the system and, if so, gives it access.
3. Checks whether any DPCs (described in Chapter 3) are pending on the processor. DPCs could be pending if a DPC interrupt was not generated when they were queued. If DPCs are pending, the idle loop calls KiRetireDpcList to deliver them. This will also perform timer expiration, as well as deferred ready processing; the latter is explained in the upcoming multiprocessor scheduling section. KiRetireDpcList must be entered with interrupts disabled, which is why interrupts are left disabled at the end of step 1. KiRetireDpcList exits with interrupts disabled as well.
4. Checks whether a thread has been selected to run next on the processor and, if so, dispatches that thread. This could be the case if, for example, a DPC or timer expiration processed in step 3 resolved the wait of a waiting thread, or if another processor selected a thread for this processor to run while it was already in the idle loop.
5. If requested, checks for threads ready to run on other processors and, if possible, schedules one of them locally. (This operation is explained in the upcoming Idle Scheduler section.)
6. Calls the registered power management processor idle routine (in case any power management functions need to be performed), which is either in the processor power driver (such as intelppm.sys) or in the HAL if such a driver is unavailable.
Thread Selection
Whenever a logical processor needs to pick the next thread to run, it calls the KiSelectNextThread scheduler function. This can happen in a variety of scenarios:
§ A hard affinity change has occurred, making the currently running or standby thread ineligible for execution on its selected logical processor, so another must be chosen.
§ The currently running thread reached its quantum end, and the SMT set it was currently running on has now become busy, while other SMT sets within the ideal node are fully idle. (SMT is the abbreviation for Symmetric Multi-Threading, the technical name for the Hyperthreading technology described in Chapter 2.) The scheduler performs a quantum end migration of the current thread, so another must be chosen.
§ A wait operation has completed, and there were pending scheduling operations in the wait status register (in other words, the Priority and/or Affinity bits were set).
In these scenarios, the behavior of the scheduler is as follows:
§ Call KiSelectReadyThread to find the next ready thread that the processor should run, and check whether one was found.
§ If a ready thread was not found, the idle scheduler is enabled, and the idle thread is selected for execution.
§ Or, if a ready thread was found, it is put in the Standby state and set as the NextThread in the KPRCB of the logical processor.
The KiSelectNextThread operation is performed only when the logical processor needs to pick, but not yet run, the next schedulable thread (which is why the thread will enter Standby). Other times, however, the logical processor is interested in immediately running the next ready thread or performing another action if one is not available (instead of going idle), such as when the following occurs:
§ A priority change has occurred, making the current standby or running thread no longer the highest priority ready thread on its selected logical processor, so a higher priority ready thread must now run.
§ The thread has explicitly yielded with YieldProcessor or NtYieldExecution, and another thread might be ready for execution.
§ The quantum of the current thread has expired, and other threads at the same priority level need their chance to run as well
§ A thread has lost its priority boost, causing a similar priority change to the scenario just described.
§ The idle scheduler is running and needs to check whether a ready thread has not appeared in the interval between which idle scheduling was requested and the idle scheduler ran.
A simple way to remember the difference between which routine runs is to check whether or not the logical processor must run a different thread (in which case KiSelectNextThread is called) or if it should, if possible, run a different thread (in which case KiSelectReadyThread is called).
In either case, because each processor has its own database of threads that are ready to run (the dispatcher database’s ready queues in the KPRCB), KiSelectReadyThread can simply check the current LP’s queues, removing the first highest priority thread that it finds, unless this priority is lower than the one of the currently running thread (depending on whether the current thread is still allowed to run, which would not be the case in the KiSelectNextThread scenario). If there is no higher priority thread (or no threads are ready at all), no thread is returned.
Idle Scheduler
Whenever the idle thread runs, it checks whether idle scheduling has been enabled, such as in one of the scenarios described in the previous section. If so, the idle thread then begins scanning other processor’s ready queues for threads it can run by calling KiSearchForNewThread. Note that the runtime costs associated with this operation are not charged as idle thread time, but are instead charged as interrupt and DPC time (charged to the processor), so idle scheduling time is considered system time. The KiSearchForNewThread algorithm, which is based on the functions seen in the Thread Selection section earlier, will be explained in the upcoming section.
Multiprocessor Systems
On a uniprocessor system, scheduling is relatively simple: the highest-priority thread that wants to run is always running. On a multiprocessor system, it is more complex, because Windows attempts to schedule threads on the most optimal processor for the thread, taking into account the thread’s preferred and previous processors, as well as the configuration of the multiprocessor system. Therefore, although Windows attempts to schedule the highest-priority runnable threads on all available CPUs, it guarantees only to be running one of the highest-priority threads somewhere.
Before we describe the specific algorithms used to choose which threads run where and when, let’s examine the additional information Windows maintains to track thread and processor state on multiprocessor systems and the three different types of multiprocessor systems supported by Windows (SMT, multicore, and NUMA).
Package Sets and SMT Sets
Windows uses five fields in the KPRCB to determine correct scheduling decisions when dealing with logical processor topologies. The first field, CoresPerPhysicalProcessor, determines whether this logical processor is part of a multicore package, and it’s computed from the CPUID returned by the processor and rounded to a power of two. The second field, LogicalProcessorsPerCore determines whether the logical processor is part of an SMT set, such as on an Intel processor with HyperThreading enabled, and is also queried through CPUID and rounded. Multiplying these two numbers yields the number of logical processors per package, or an actual physical processor that fits into a socket. With these numbers, each PRCB can then populate its PackageProcessorSet value, which is the affinity mask describing which other logical processors within this group (because packages are constrained to a group) belong to the same physical processor. Similarly, the CoreProcessorSet value connects other logical processors to the same core, also called an SMT set. Finally, the GroupSetMember value defines which bit mask, within the current processor group, identifies this very logical processor. For example, the logical processor 3 normally has a GroupSetMember of 8 (2^3).
EXPERIMENT: VIEWING LOGICAL PROCESSOR INFORMATION
You can examine the information Windows maintains for SMT processors using the !smt command in the kernel debugger. The following output is from a dual-core Intel Core i5 system with SMT (four logical processors):
SMT Summary:
KeActiveProcessors:
****------------------------------------------------------------ (000000000000000f)
KiIdleSummary:
-*-*------------------------------------------------------------ (000000000000000a)
---------------------------------------------------------------- (0000000000000000)
---------------------------------------------------------------- (0000000000000000)
---------------------------------------------------------------- (0000000000000000)
No PRCB SMT Set APIC Id
0 fffff8000324ae80 **--------------------------------------------------------------
(0000000000000003) 0x00000000
1 fffff880009e5180 **--------------------------------------------------------------
(0000000000000003) 0x00000001
2 fffff88002f65180 --**------------------------------------------------------------
(000000000000000c) 0x00000002
3 fffff88002fd7180 --**------------------------------------------------------------
(000000000000000c) 0x00000003
Maximum cores per physical processor: 8
Maximum logical processors per core: 2
NUMA Systems
Another type of multiprocessor system supported by Windows is one with a nonuniform memory access (NUMA) architecture. In a NUMA system, processors are grouped together in smaller units called nodes. Each node has its own processors and memory and is connected to the larger system through a cache-coherent interconnect bus. These systems are called “nonuniform” because each node has its own local high-speed memory. Although any processor in any node can access all of memory, node-local memory is much faster to access.
The kernel maintains information about each node in a NUMA system in a data structure called KNODE. The kernel variable KeNodeBlock is an array of pointers to the KNODE structures for each node. The format of the KNODE structure can be shown using the dt command in the kernel debugger, as shown here:
lkd> dt nt!_KNODE
+0x000 PagedPoolSListHead : _SLIST_HEADER
+0x008 NonPagedPoolSListHead : [3] _SLIST_HEADER
+0x020 Affinity : _GROUP_AFFINITY
+0x02c ProximityId : Uint4B
+0x030 NodeNumber : Uint2B
...
+0x060 ParkLock : Int4B
+0x064 NodePad1 : Uint4B
EXPERIMENT: VIEWING NUMA INFORMATION
You can examine the information Windows maintains for each node in a NUMA system using the !numa command in the kernel debugger. The following partial output is from a 64-processor NUMA system from Hewlett-Packard with four processors per node:
26: kd> !numa
NUMA Summary:
------------
Number of NUMA nodes : 16
Number of Processors : 64
MmAvailablePages : 0x03F55E67
KeActiveProcessors : ****************************************************************
(ffffffffffffffff)
NODE 0 (E000000084261900):
ProcessorMask : ****------------------------------------------------------------
...
NODE 1 (E0000145FF992200):
ProcessorMask : ----****--------------------------------------------------------
...
Applications that want to gain the most performance out of NUMA systems can set the affinity mask to restrict a process to the processors in a specific node, although Windows already restricts nearly all threads to a single NUMA node due to its NUMA-aware scheduling algorithms.
How the scheduling algorithms take into account NUMA systems will be covered in the upcoming section Processor Selection (and the optimizations in the memory manager to take advantage of node-local memory are covered in Chapter 10 in Part 2).
Processor Group Assignment
While querying the topology of the system to build the various relationships between logical processors, SMT sets, multicore packages and physical sockets, Windows assigns processors to an appropriate group that will describe their affinity (through the extended affinity mask seen earlier). This work is done by the KePerformGroupConfiguration routine, which is called during initialization before any other Phase 1 work is done. Note that regardless of the group assignment steps below, NUMA node 0 is always assigned to group 0, no matter what.
First, the function queries all detected nodes (KeNumberNodes) and computes the capacity of each node (that is, how many logical processors can be part of the node). This value is stored as the MaximumProcessors in the KeNodeBlock, which identifies all NUMA nodes on the system. If the system supports NUMA Proximity IDs, the proximity ID is queried for each node as well and saved in the node block. Second, the NUMA distance array is allocated (KeNodeDistance), and the distance between each NUMA node is computed as was described inChapter 3.
The next series of steps deal with specific user-configuration options that override default NUMA assignments. For example, on a system with Hyper-V installed (and the hypervisor configured to auto-start), only one processor group will be enabled, and all NUMA nodes (that can fit) will be associated with group 0. This means that Hyper-V scenarios cannot take advantage of machines with over 64 processors at the moment.
Next, the function checks whether any static group assignment data was passed by the loader (and thus configured by the user). This data specifies the proximity information and group assignment for each NUMA node.
NOTE
Users dealing with large NUMA servers that might need custom control of proximity information and group assignments for testing or validation purposes can input this data through the Group Assignment and Node Distance registry values in the HKLM\SYSTEM \CurrentControlSet\Control\NUMA registry key. The exact format of this data includes a count, followed by an array of proximity IDs and group assignments, which are all 32-bit values.
Before treating this data as valid, the kernel queries the proximity ID to match the node number and then associates group numbers as requested. It then makes sure that NUMA node 0 is associated with group 0, and that the capacity for all NUMA nodes is consistent with the group size. Finally, the function checks how many groups still have remaining capacity.
Next, the kernel dynamically attempts to assign NUMA nodes to groups, while respecting any statically configured nodes if passed-in as we just described. Normally, the kernel tries to minimize the number of groups created, combining as many NUMA nodes as possible per group. However, if this behavior is not desired, it can be configured differently with the /MAXGROUP loader parameter, which is configured through the maxgroup BCD option. Turning this value on overrides the default behavior and causes the algorithm to spread as many NUMA nodes as possible into as many groups as possible (while respecting that the currently implemented group limit is 4). If there is only one node, or if all nodes can fit into a single group (and maxgroup is off), the system performs the default setting of assigning all nodes to group 0.
If there is more than one node, Windows checks the static NUMA node distances (if any), and then sorts all the nodes by their capacity so that the largest nodes come first. In the group-minimization mode, by adding up all the capacities, the kernel figures out how many maximum processors there can be. By dividing that by the number of processors per group, the kernel assumes there will be this many total groups on the machine (limited to a maximum of 4). In the group-maximization mode, the initial estimate is that there will be as many groups as nodes (limited again to 4).
Now the kernel begins the final assignment process. All fixed assignments from earlier are now committed, and groups are created for those assignments. Next, all the NUMA nodes are reshuffled to minimize the distance between the different nodes within a group. In other words, closer nodes are put in the same group and sorted by distance. Next, the same process is performed for any dynamically configured node to group assignments. Finally, any remaining empty nodes are assigned to group 0.
Logical Processors per Group
Generally, Windows assigns 64 processors per group as explained earlier, but this configuration can also be customized by using different load options, such as the /GROUPSIZE option, which is configured through the groupsize BCD element. By specifying a number that is a power of two, groups can be forced to contain fewer processors than normal, for purposes such as testing group awareness in the system (for example, a system with 8 logical processors can be made to appear to have 1, 2, or 4 groups). To force the issue, the /FORCEGROUPAWARE option (BCD element groupaware) furthermore makes the kernel avoid group 0 whenever possible, assigning the highest group number available in actions such as thread and DPC affinity selection and process group assignment. Avoid setting a group size of 1, because this will force almost all applications on the system to behave as if they’re running on a uniprocessor machine, because the kernel sets the affinity mask of a given process to span only one group until the application requests otherwise (which most applications today will not do).
Note that in the edge case where the number of logical processors in a package cannot fit into a single group, Windows adjusts these numbers so that a package can fit into a single group, shrinking the CoresPerPhysicalProcessor number, and if the SMT cannot fit either, doing this as well for LogicalProcessorsPerCore. The exception to this rule is if the system actually contains multiple NUMA nodes within a single package. Although this is not a possibility as of this writing, future Multiple-Chip Modules (MCMs, an extension of multicore packages) are due to ship from processor manufacturers in the future. In these modules, two sets of cores as well as two memory controllers are on the same die/package. If the ACPI SRAT table defines the MCM as having two NUMA nodes, depending on group configuration algorithms, Windows might associate the two nodes with two different groups. In this scenario, the MCM package would span more than one group.
Other than causing significant driver and application compatibility problems (which they are designed to identify and root out, when used by developers), these options have an even greater impact on the machine: they will force NUMA behaviors even on a non-NUMA machine. This is because Windows will never allow a NUMA node to span multiple groups, as was shown in the assignment algorithms. So, if the kernel is creating artificially small groups, those two groups must each have their own NUMA node. For example, on a quad-core processor with a group size of two, this will create two groups, and thus two NUMA nodes, which will be subnodes of the main node. This will affect scheduling and memory-management policies in the same way a true NUMA system would, which can be useful for testing.
Logical Processor State
In addition to the ready queues and the ready summary, Windows maintains two bitmasks that track the state of the processors on the system. (How these bitmasks are used is explained in the upcoming section Processor Selection.) Following are the bitmasks that Windows maintains.
The first one is the active processor mask (KeActiveProcessors), which has a bit set for each usable processor on the system. This might be fewer than the number of actual processors if the licensing limits of the version of Windows running supports fewer than the number of available physical processors. To check this, use the variable KeRegisteredProcessors to see how many processors are actually licensed on the machine. In this instance, “processors” refers to physical packages. The KeMaximumProcessors variable, on the other hand, is the maximum number of logical processors, including all future possible dynamic processor additions, bounded within the licensing limit, and any platform limitations that are queried by calling the HAL and checking with the ACPI SRAT table, if any.
The idle summary (KiIdleSummary) is actually an array of two extended bitmasks. In the first entry, called CpuSet, each set bit represents an idle processor, while in the second entry, SMTSet, each bit describes an idle SMT set.
The nonparked summary (KiNonParkedSummary) defines each nonparked logical processor through a bit.
Scheduler Scalability
Because on a multiprocessor system one processor might need to modify another processor’s per-CPU scheduling data structures (such as inserting a thread that would like to run on a certain processor), these structures are synchronized by using a per-PRCB queued spinlock, which is held at DISPATCH_LEVEL. Thus, thread selection can occur while locking only an individual processor’s PRCB. If needed, up to one more processor’s PRCB can also be locked, such as in scenarios of thread stealing, which will be described later. Thread context switching is also synchronized by using a finer-grained per-thread spinlock.
There is also a per-CPU list of threads in the deferred ready state. These represent threads that are ready to run but have not yet been readied for execution; the actual ready operation has been deferred to a more appropriate time. Because each processor manipulates only its own per-processor deferred ready list, this list is not synchronized by the PRCB spinlock. The deferred ready thread list is processed by KiProcessDeferredReadyList after a function has already done modifications to process or thread affinity, priority (including due to priority boosting), or quantum values.
This function calls KiDeferredReadyThread for each thread on the list, which performs the algorithm shown later in the Processor Selection section, which could either cause the thread to run immediately; to be put on the ready list of the processor; or if the processor is unavailable, to be potentially put on a different processor’s deferred ready list, in a standby state, or immediately executed. This property is used by the Core Parking engine when parking a core: all threads are put into the deferred ready list, and it is then processed. Because KiDeferredReadyThreadskips parked cores (as will be shown), it causes all of this processor’s threads to wind up on other processors.
Affinity
Each thread has an affinity mask that specifies the processors on which the thread is allowed to run. The thread affinity mask is inherited from the process affinity mask. By default, all processes (and therefore all threads) begin with an affinity mask that is equal to the set of all active processors on their assigned group—in other words, the system is free to schedule all threads on any available processor within the group associated with the process.
However, to optimize throughput, partition workloads to a specific set of processors, or both, applications can choose to change the affinity mask for a thread. This can be done at several levels:
§ Calling the SetThreadAffinityMask function to set the affinity for an individual thread.
§ Calling the SetProcessAffinityMask function to set the affinity for all the threads in a process. Task Manager and Process Explorer provide a GUI to this function if you right-click a process and choose Set Affinity. The Psexec tool (from Sysinternals) provides a command-line interface to this function. (See the –a switch in its help output.)
§ By making a process a member of a job that has a jobwide affinity mask set using the SetInformationJobObject function. (Jobs are described in the upcoming Job Objects section.)
§ By specifying an affinity mask in the image header when compiling the application. (For more information on the detailed format of Windows images, search for “Portable Executable and Common Object File Format Specification” on www.microsoft.com.)
An image can also have the “uniprocessor” flag set at link time. If this flag is set, the system chooses a single processor at process creation time (MmRotatingProcessorNumber) and assigns that as the process affinity mask, starting with the first processor and then going round-robin across all the processors within the group. For example, on a dual-processor system, the first time an image marked as uniprocessor is launched, it is assigned to CPU 0; the second time, CPU 1; the third time, CPU 0; the fourth time, CPU 1; and so on. This flag can be useful as a temporary workaround for programs that have multithreaded synchronization bugs that, as a result of race conditions, surface on multiprocessor systems but that don’t occur on uniprocessor systems. If an image exhibits such symptoms and is unsigned, the flag can be manually added by editing the image header with a tool such as Imagecfg.exe. A better solution, also compatible with signed executables, is to use the Microsoft Application Compatibility Toolkit and add a shim to force the compatibility database to mark the image as uniprocessor-only at launch time.
EXPERIMENT: VIEWING AND CHANGING PROCESS AFFINITY
In this experiment, you will modify the affinity settings for a process and see that process affinity is inherited by new processes:
1. Run the command prompt (Cmd.exe).
2. Run Task Manager or Process Explorer, and find the Cmd.exe process in the process list.
3. Right-click the process, and select Set Affinity. A list of processors should be displayed. For example, on a dual-processor system you will see this:
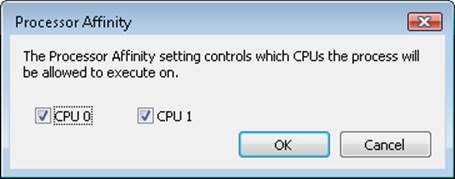
4. Select a subset of the available processors on the system, and click OK. The process’ threads are now restricted to run on the processors you just selected.
5. Now run Notepad.exe from the command prompt (by typing Notepad.exe).
6. Go back to Task Manager or Process Explorer and find the new Notepad process. Right-click it, and choose Affinity. You should see the same list of processors you chose for the command-prompt process. This is because processes inherit their affinity settings from their parent.
Windows won’t move a running thread that could run on a different processor from one CPU to a second processor to permit a thread with an affinity for the first processor to run on the first processor. For example, consider this scenario: CPU 0 is running a priority 8 thread that can run on any processor, and CPU 1 is running a priority 4 thread that can run on any processor. A priority 6 thread that can run on only CPU 0 becomes ready. What happens? Windows won’t move the priority 8 thread from CPU 0 to CPU 1 (preempting the priority 4 thread) so that the priority 6 thread can run; the priority 6 thread has to stay in the ready state.
Therefore, changing the affinity mask for a process or a thread can result in threads getting less CPU time than they normally would, because Windows is restricted from running the thread on certain processors. Therefore, setting affinity should be done with extreme care—in most cases, it is optimal to let Windows decide which threads run where.
Extended Affinity Mask
To support more than 64 processors, which is the limit enforced by the affinity mask structure (composed of 64 bits on a 64-bit system), Windows uses an extended affinity mask (KAFFINITY_EX) that is an array of affinity masks, one for each supported processor group (currently defined to 4). When the scheduler needs to refer to a processor in the extended affinity masks, it first de-references the correct bitmask by using its group number and then accesses the resulting affinity directly. In the kernel API, extended affinity masks are not exposed; instead, the caller of the API inputs the group number as a parameter, and receives the legacy affinity mask for that group. In the Windows API, on the other hand, only information about a single group can usually be queried, which is the group of the currently running thread (which is fixed).
The extended affinity mask and its underlying functionality are also how a process can escape the boundaries of its original assigned processor group. By using the extended affinity APIs, threads in a process can choose affinity masks on other processor groups. For example, if a process has 4 threads and the machine has 256 processors, thread 1 can run on processor 4, thread 2 can run on processor 68, thread 3 on processor 132, and thread 4 on processor 196, if each thread set an affinity mask of 0x10 (0b10000 in binary) on groups 0, 1, 2, and 3. Alternatively, the threads can each set an affinity of 0xFFFFFFFF for their given group, and the process then can execute its threads on any available processor on the system (with the limitation, that each thread is restricted to running within its own group only).
Taking advantage of extended affinity must be done at creation time, by specifying a group number in the thread attribute list when creating a new thread. (See the previous topic on thread creation for more information on attribute lists.)
System Affinity Mask
Because Windows drivers usually execute in the context of the calling thread or in the context of an arbitrary thread (that is, not in the safe confines of the System process), currently running driver code might be subject to affinity rules set by the application developer, which are not currently relevant to the driver code and might even prevent correct processing of interrupts and other queued work. Driver developers therefore have a mechanism to temporarily bypass user thread affinity settings, by using the APIsKeSetSystemAffinityThread(Ex)/KeSetSystemGroupAffinityThread and KeRevertToUserAffinityThread(Ex)/KeRevertToUserGroupAffinityThread.
Ideal and Last Processor
Each thread has three CPU numbers stored in the kernel thread control block:
§ Ideal processor, or the preferred processor that this thread should run on
§ Last processor, or the processor on which the thread last ran
§ Next processor, or the processor that the thread will be, or is already, running on
The ideal processor for a thread is chosen when a thread is created using a seed in the process control block. The seed is incremented each time a thread is created so that the ideal processor for each new thread in the process rotates through the available processors on the system. For example, the first thread in the first process on the system is assigned an ideal processor of 0. The second thread in that process is assigned an ideal processor of 1. However, the next process in the system has its first thread’s ideal processor set to 1, the second to 2, and so on. In that way, the threads within each process are spread across the processors.
Note that this assumes the threads within a process are doing an equal amount of work. This is typically not the case in a multithreaded process, which normally has one or more housekeeping threads and then a number of worker threads. Therefore, a multithreaded application that wants to take full advantage of the platform might find it advantageous to specify the ideal processor numbers for its threads by using the SetThreadIdealProcessor function. To take advantage of processor groups, developers should call SetThreadIdealProcessorEx instead, which allows selection of a group number for the affinity.
64-bit Windows uses the Stride field in the KPRCB to balance the assignment of newly created threads within a process. The stride is a scalar number that represents the number of affinity bits within a given NUMA node that must be skipped to attain a new independent logical processor slice, where “independent” means on another core (if dealing with an SMT system) or another package (if dealing with a non-SMT but multicore system). Because 32-bit Windows doesn’t support large processor configuration systems, it doesn’t use a stride, and it simply selects the next processor number, trying to avoid sharing the same SMT set if possible. For example, on a dual-processor SMT system with four logical processors, if the ideal processor for the first thread is assigned to logical processor 0, the second thread would be assigned to logical processor 2, the third thread to logical processor 1, the fourth thread to logical process 3, and so forth. In this way, the threads are spread evenly across the physical processors.
Ideal Node
On NUMA systems, when a process is created, an ideal node for the process is selected. The first process is assigned to node 0, the second process to node 1, and so on. Then the ideal processors for the threads in the process are chosen from the process’ ideal node. The ideal processor for the first thread in a process is assigned to the first processor in the node. As additional threads are created in processes with the same ideal node, the next processor is used for the next thread’s ideal processor, and so on.
Thread Selection on Multiprocessor Systems
Before covering multiprocessor systems in more detail, I should summarize the algorithms discussed in the Thread Selection section. They either continued executing the current thread (if no new candidate was found) or started running the idle thread (if the current thread had to block). However, there is a third algorithm for thread selection, which was hinted at in the Idle Scheduler section earlier, called KiSearchForNewThread. This algorithm is called in one specific instance: when the current thread is about to block due to a wait on an object, including when doing an NtDelayExecutionThread call, also known as the Sleep API in Windows.
NOTE
This shows a subtle difference between the commonly used Sleep(1) call, which makes the current thread block until the next timer tick, and the SwitchToThread() call, which was shown earlier. The “sleep” will use the algorithm about to be described, while the “yield” uses the previously shown logic.
KiSearchForNewThread initially checks whether there is already a thread that was selected for this processor (by reading the NextThread field); if so, it dispatches this thread immediately in the Running state. Otherwise, it calls the KiSelectReadyThread routine and, if a thread was found, performs the same steps.
If a thread was not found, however, the processor is marked as idle (even though the idle thread is not yet executing) and a scan of other logical processors queues is initiated (unlike the other standard algorithms, which would now give up). Also, because the processor is now considered idle, if the Distributed Fair Share Scheduling mode (described in the next topic) is enabled, a thread will be released from the idle-only queue if possible and scheduled instead. On the other hand, if the processor core is now parked, the algorithm will not attempt to check other logical processors, as it is preferable to allow the core to enter the parking state instead keeping it busy with new work.
Barring these two scenarios, the work-stealing loop now runs. This code looks at the current NUMA node and removes any idle processors (because they shouldn’t have threads that need stealing). Then, starting from the highest numbered processor, the loop calls KiFindReadyThreadbut points it to the remote KPRCB instead of the current one, causing this processor to find the best ready thread from the other processor’s queue. If this is unsuccessful and Distributed Fair Share Scheduler is enabled, a thread from the idle-only queue of the remote logical processor is released on the current processor instead, if possible.
If no candidate ready thread is found, the next lower numbered logical processor is attempted, and so on, until all logical processors have been exhausted on the current NUMA node. In this case, the algorithm keeps searching for the next closest node, and so on, until all nodes in the current group have been exhausted. (Recall that Windows allows a given thread to have affinity only on a single group.) If this process fails to find any candidates, the function returns NULL and the processor enters the idle thread in the case of a wait (which will skip idle scheduling). If this work was already being done from the idle scheduler, the processor enters a sleep state.
Processor Selection
Up until now, we’ve described how Windows picks a thread when a logical processor needs to make a selection (or when a selection must be made for a given logical processor) and assumed the various scheduling routines have an existing database of ready threads to choose from. Now we’ll see how this database gets populated in the first place—in other words, how Windows chooses which LP’s ready queues a given ready thread will be associated with. Having described the types of multiprocessor systems supported by Windows as well as the thread affinity and ideal processor settings, we’re now ready to examine how this information is used for this purpose.
Choosing a Processor for a Thread When There Are Idle Processors
When a thread becomes ready to run, the KiDeferredReadyThread scheduler function is called, causing Windows to perform two tasks: adjust priorities and refresh quantums as needed, as was explained in the Priority Boosts section, and then pick the best logical processor for the thread. Windows first looks up the thread’s ideal processor, and then it computes the set of idle processors within the thread’s hard affinity mask. This set is then pruned as follows:
§ Any idle logical processors that have been parked by the Core Parking mechanism are removed. (See Chapter 9, “Storage Management,” in Part 2 for more information on Core Parking.) If this causes no idle processors to remain, idle processor selection is aborted, and the scheduler behaves as if no idle processors were available (which is described in the upcoming section)
§ Any idle logical processors that are not on the ideal node (defined as the node containing the ideal processor) are removed, unless this would cause all idle processors to be eliminated.
§ On an SMT system, any non-idle SMT sets are removed, even if this might cause the elimination of the ideal processor itself. In other words, Windows prioritizes a non-ideal, idle SMT set over an ideal processor.
§ Windows then checks whether the ideal processor is among the remaining set of idle processors. If it isn’t, it must then find the most appropriate idle processor. It does so by first checking whether the processor that the thread last ran on is part of the remaining idle set. If so, this processor is considered to be a temporary ideal processor and chosen. (Recall that the ideal processor attempts to maximize processor cache hits, and picking the last processor a thread ran on is a good way of doing so.)
§ If the last processor is not part of the remaining idle set, Windows next checks whether the current processor (that is, the processor currently executing this scheduling code) is part of this set; if so, it applies the same logic as in the prior step.
§ If neither the last nor the current processor is idle, Windows performs one more pruning operation, by removing any idle logical processors that are not on the same SMT set as the ideal processor. If there are none left, Windows instead removes any processors not on the SMT set of the current processor, unless this, too, eliminates all idle processors. In other words, Windows prefers idle processors that share the same SMT set as the unavailable ideal processor and/or last processor it would’ve liked to pick in the first place. Because SMT implementations share the cache on the core, this has nearly the same effect as picking the ideal or last processor from the caching perspective.
§ Finally, if this last step results in more than one processor remaining in the idle set, Windows picks the lowest numbered processor as the thread’s current processor.
Once a processor has been selected for the thread to run on, that thread is put in the standby state and the idle processor’s PRCB is updated to point to this thread. If the processor is idle, but not halted, a DPC interrupt is sent so that the processor handles the scheduling operation immediately.
Whenever such a scheduling operation is initiated, KiCheckForThreadDispatch is called, which will realize that a new thread has been scheduled on the processor and cause an immediate context switch if possible (as well as pending APC deliveries), or it will cause a DPC interrupt to be sent.
Choosing a Processor for a Thread When There Are No Idle Processors
If there are no idle processors when a thread wants to run, or if the only idle processors were eliminated by the first pruning (which got rid of parked idle processors), Windows first checks whether the latter situation has occurred. In this scenario, the scheduler callsKiSelectCandidateProcessor to ask the Core Parking engine for the best candidate processor. The Core Parking engine selects the highest-numbered processor that is unparked within the ideal node. If there are no such processors, the engine forcefully overrides the park state of the ideal processor and causes it to be unparked. Upon returning to the scheduler, it will check whether the candidate it received is idle; if so, it will pick this processor for the thread, following the same last steps as in the previous scenario.
If this fails, Windows compares the priority of the thread running (or the one in the standby state) on the thread’s ideal processor to determine whether it should preempt that thread.
If the thread’s ideal processor already has a thread selected to run next (waiting in the standby state to be scheduled) and that thread’s priority is less than the priority of the thread being readied for execution, the new thread preempts that first thread out of the standby state and becomes the next thread for that CPU. If there is already a thread running on that CPU, Windows checks whether the priority of the currently running thread is less than the thread being readied for execution. If so, the currently running thread is marked to be preempted, and Windows queues a DPC interrupt to the target processor to preempt the currently running thread in favor of this new thread.
If the ready thread cannot be run right away, it is moved into the ready state on the priority queue appropriate to its thread priority, where it will await its turn to run. As seen in the scheduling scenarios earlier, the thread will be inserted either at the head or the tail of the queue, based on whether it entered the ready state due to preemption.
As such, regardless of the underlying scenario and various possibilities, note that threads are always put on their ideal processor’s per-processor ready queues, guaranteeing the consistency of the algorithms that determine how a logical processor picks a thread to run.
Processor Share-Based Scheduling
In the previous section, the standard thread-based scheduling implementation of Windows was described, which has served general user and server scenarios reliably since its appearance in the first Windows NT release (with scalability improvements done throughout each release). However, because thread-based scheduling attempts to fairly share the processor or processors only among competing threads of same priority, it does not take into account higher-level requirements such as the distribution of threads to users and the potential for certain users to benefit from more overall CPU time at the expense of other users. This kind of behavior, as it turns out, is highly sought after in terminal-services environments, where dozens of users can be competing for CPU time and a single high-priority thread from a given user has the potential to starve threads from all users on the machine if only thread-based scheduling is used.
Distributed Fair Share Scheduling
In this section, two alternative scheduling modes implemented by recent versions of Windows will be described: the session-based Distributed Fair Share Scheduler (DFSS) and an older, legacy SID-based CPU Rate Limit implementation.
DFSS Initialization
During the very last parts of system initialization, as the SOFTWARE hive is initialized by Smss, the process manager initiates the final post-boot initialization in PsBootPhaseComplete, which calls PsInitializeCpuQuota. It is here that the system decides which of the two CPU quota mechanisms (DFSS or legacy) will be employed. For DFSS to be enabled, the EnableCpuQuota registry value must be set to 1 in both of the two quota keys: HKLM\SOFTWARE\Policies\Microsoft\Windows\Session Manager\Quota System for the policy-based setting (that can be configured through the Group Policy Editor under Computer Configuration\Administrative Templates\Windows Components \Remote Desktop Services\Remote Desktop Session Host\Connections - Turn off Fair Share CPU Scheduling), as well as under the system key HKLM\SYSTEM\CurrentControlSet\Control\Session Manager\Quota System, which determines if the system supports the functionality (which, by default, is set to TRUE on Windows Server with the Remote Desktop role).
NOTE
Due to a bug (which you can learn more about at http://technet.microsoft.com/en-us/library/ee808941(WS.10).aspx), the group policy setting to turn off DFSS is not honored. The system setting must be manually turned off.
If DFSS is enabled, the PsCpuFairShareEnabled variable is set to true, which will instruct the kernel, through various scheduling code paths, to behave differently and/or to call into the DFSS engine. Additionally, the default quota is set up to 150 milliseconds for each DFSS cycle, a number called credit that will be explained in more detail shortly.
Once DFSS is enabled, the global PspCpuQuotaControl data structure is used to maintain DFSS information, such as the list of per-session CPU quota blocks (as well as a spinlock and count) and the total weight of all sessions on the system. It also stores an array of per-processor DFSS data structures, which you’ll see next.
Per-Session CPU Quota Blocks
After DFSS is enabled, whenever a new session is created (other than Session 0), MiSessionCreate calls PsAllocateCpuQuotaBlock to set up the per-session CPU quota block. The first time this happens on the system (for example, for Session 1), this calls PspLazyInitializeCpuQuotato finalize the initialization of DFSS.
This results in the allocation of per-CPU DFSS data structures mentioned in the previous sections, which contain the DPC used for managing the quota (PspCpuQuotaDpcRoutine, seen later) and the total number of cycles credited as well as accumulated. This structure also keeps the block generation a monotonically increasing sequence to guarantee atomicity, as well as keeping the idle-only queue lock protecting the list of the same name, which is a central element of the DFSS mechanism yet to be described. Each per-CPU DFSS data structure, in turn, is connected through a sorted doubly-linked list to the various per-session CPU quota blocks that were mentioned at the beginning of this discussion.
When the first-time initialization of DFSS is complete, PsAllocateCpuQuotaBlock can continue, first by allocating the actual CPU quota block for this session. This structure maintains overall accounting information on the session, as well as per-CPU tracking—including the cycles remaining and initially allocated, as well as the idle-only queue itself, in a per-CPU quota entry structure.
To begin with, the session ID is stored, and the CPU share weight is set to its default of 5. You’ll see shortly what a weight is, how it can be computed, and its effects on the DFSS engine. Because the quota block has just been created, the initial cycle values are all set to their maximum value for now. Next, this new per-session CPU block must be visible to the system. Therefore, the PspCpuQuotaControl data structure is updated with the new total weight of all sessions (by adding this weight), and the quota block is inserted into the block list (sorted by session ID). Finally, PspCalculateCpuQuotaBlockCycleCredits enumerates every other session’s quota block and captures the new total weight of the system.
Once this is done, the per-session CPU quota block is finalized, and the memory manager sets it in the CpuQuotaBlock field of the MM_SESSION_SPACE structure for this session. Likewise, the current EPROCESS (part of this new session’s CpuQuotaBlock field) is also updated to point to this session’s CPU quota block. Now that the process has received a CPU quota block as soon as it became part of the session, future threads created by this process (including the first thread itself) will be allocated with an extra structure after their typical ETHREAD—a per-process CPU Quota APC structure. Additionally, the ETHREAD’s RateApcState field will be set to PsRateApcContained, indicating that this is an embedded Quota APC, as used by the DFSS mechanism (rather than the pool-allocated legacy APC). Finally, the CpuThrottled bit is set in the KTHREAD’s ThreadControlFlags.
At this point, the global quota-control structure contains a pointer to the DFSS per-CPU data structure array, which itself is linked to all the per-session CPU blocks that have been created for each session and associated with the EPROCESS structure of the member processes. In turn, each thread part of such a process has CPU throttling turned on. There is a per-CPU DPC ready to execute, as well as per-thread APCs for each throttled thread.
When the last process in the session loses all its references, PsDeleteCpuQuotaBlock is called. It removes the block from the list, refreshes the total weights, and calls PspCalculateCpuQuotaBlockCycleCredits to update all other per-session CPU quota blocks.
Charging of Cycles to Throttled Threads
After everything is set up, the entire DFSS mechanism is triggered by the consumption of CPU cycles—something that was already explained in the earlier sections. In other words, not only are consumed cycles used for quantum accounting and providing finer-grained information to thread APIs, but they also can be “charged” against the thread (and thus against its quota). This operation is done by the PsChargeProcessCpuCycles function that is called whenever a thread has completed the accumulation of cycles in its current execution timeline.
The first operation involves accumulating the additional cycles to the per-CPU DFSS data structure for this processor, increasing the TotalCyclesAccumulated value. If this accumulation has reached the total credit, the quota DPC is immediately queued. Once the DPC ultimately executes, it calls PspStartNewFairShareInterval, which updates the generation, resets the cycles accumulated, and resets the credit to 150 ms. Finally, the idle-only queue is flushed on each processor associated with a given session. (You’ll see what this queue is and what flushing it entails, later.) This part of the algorithm manages the 150-ms interval that controls DFSS.
A second possibility is that the generation of the per-CPU quota entry contained in the current process’ CPU quota block (owned by the session) does not manage the generation of the current per-CPU DFSS data structure. This generation mismatch suggests that a new interval has been reached and no cycle limits have yet been set, so PspReplenishCycleCredit is called to do the work. This reads the per-CPU weight and the total weight that were captured earlier in PspCalculateCpuQuotaBlockCycleCredits, and it uses them to set the base cycle allowance for the current per-CPU data inside the process’ CPU quota block. To do this, it uses a simple formula: the process receives the equivalent of its cycle credit (150 ms) divided by the total weight of all sessions on the system. Then the amount of cycles it will be permitted to run for (CyclesRemaining) is set to the base cycle allowance multiplied by the weight of this particular session. In other words, the process runs for a fairly-divided chunk of time based on the number of other sessions on the system, calculated as a percentage based on its relative weight compared to the overall system weight. When the computation is completed, the generation is set to match.
In all other cases, PsChargeProcessCpuCycles merely subtracts the amount of cycles from CyclesRemaining and then calls PsCheckThreadCpuQuota to see whether these cycles have been exhausted (reaching zero). Note that this function can sometimes also be called directly from the context switch code when control is about to pass to a thread that has CPU throttling enabled.
PsCheckThreadCpuQuota recovers the CPU quota block for this process (that is, for the session), and then further extracts the precise per-CPU information out of it. Once again, it checks whether the generation does not match, which would indicate this is the first charge for this 150-ms credit cycle, and then it calls PspReplenishCycleCredit. Next, it checks whether the CPU quota block for the process indicates there are no more cycles remaining. If cycles still remain, the function returns; otherwise, it prepares to suspend the thread’s execution.
Before stopping execution, the function extracts the per-CPU DPC, making sure that it (or the associated per-thread APC) is not already running. If this operation is happening due to the context-switch scenario brought up earlier, the per-thread APC is queued, which will preempt the thread’s execution as soon as the context switch completes. Otherwise, if this is occurring as result of cycle charging (which happens at DISPATCH_LEVEL or higher), the per-CPU DPC is queued instead, which will later queue the per-thread APC. (This forces a near-immediate response to the CPU quota restriction.) In case further cycle accumulation has occurred past the 150-ms cycle credit, the DPC also calls PspStartNewFairShareInterval, which was explained earlier.
CPU Throttling and Quota Enforcement
So far, you’ve seen how DFSS initializes, how CPU quota blocks are created for each session (and then associated with member processes), and how threads running with the CPU throttling bit (implying they are part of processes that are members of a session with DFSS enabled) will consume cycles out of their total weight-relative allowance, resetting every 150 ms. You also saw how, eventually, an APC is queued in all cases where a thread has exhausted its allowed cycles. You’ll now see how the APC enforces the CPU quota restriction.
The APC first enters an infinite loop, creating a stack-allocated Quota Wait Block that contains the current thread being restricted, as well as a resume event. It is this event that ultimately allows the thread to continue its execution. Next, the APC gets the per-CPU DFSS data structure pointer and acquires the idle-only queue lock referenced earlier. It then checks whether the idle-only queue on the current processor (which comes from the per-CPU quota entry contained in the process’ CPU quota block) is empty. If the list is empty, it implies that this CPU has never been inserted in the sorted block list that is contained in the per-CPU DFSS data structure (part of the PspCpuQuotaControl global array). The PspInsertQuotaBlockCpuEntry function is thus called to rectify the situation.
Because the DFSS scheduler itself (which has yet to be described) uses this data structure, it must be inserted in the most optimal way—in this case, sorted by the base cycle allowance of each per-CPU data contained within the per-process CPU quota block. Recall that the base cycle allowance is initially the 150-ms credit cycle divided by the total weight of the system (that is, a full allowance), but you’ll see how the allowance can be later modified by the DFSS scheduler.
Next, now that the per-CPU Quota Entry is in the sorted block list (or it might already have been if the idle-only queue was not empty), this thread is inserted at the end of the idle-only queue, and it’s connected by a linked list entry that’s present in the Quota Wait Block. Because this wait block contains the resume event initialized earlier, the DFSS scheduler is able to control the thread when needed.
Finally, the APC enters a wait on this resume event, with the wait reason WrCpuRateControl. By using a tool such as Sysinternals PsList, or Process Explorer—all of which display wait reasons (as well as a kernel debugger)—you can see such threads intermittently blocked on a DFSS system.
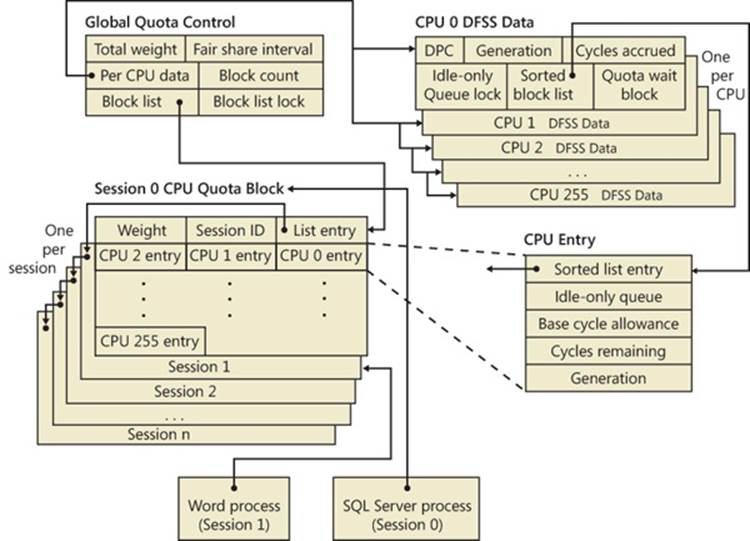
Resuming Execution
With more and more threads possibly hitting their CPU quota restrictions and block on their respective idle-queues, how will they eventually resume execution? One of the possibilities is that a new 150-ms interval has started. Recall from the earlier discussion thatPspStartNewFairShareInterval was said to “flush the idle-only queue.” This operation, performed by PspFlushProcessorIdleOnlyQueue, essentially scans every per-CPU quota entry for this processor (which is located in the sorted block list), and then scans the idle-only queue of each such processor. Picking every thread in the list, the function removes the thread and manually sets the resume event. Thus, any blocked thread on the current CPU gets to resume execution after 150 ms.
Obviously, flushing is not the usual mechanism through which the idle-only queue threads are managed. This work typically is done by the DFSS scheduler itself, which provides the PsReleaseThreadFromIdleOnlyQueue routine as a callback that the regular thread scheduler, when the system is about to go idle, can use whenever DFSS-related work is required. Specifically, it is the KiSearchForNewThread function, thoroughly described earlier, that calls DFSS in the following two scenarios:
§ If KiSelectReadyThread, which is called initially, has not found a new thread for the current processor, before it checks other processors’ dispatcher ready queues, KiSearchForNewThread will ask DFSS to release a thread from the idle-only queue.
§ Otherwise, as each CPU’s dispatcher ready queues are scanned (by looping KiSelectReadyThread calls on each PRCB), if once again no thread is found, the DFSS scheduler is called to release a thread from the idle-only queue on the target processor as well.
Finally, you’ll see what work PsReleaseThreadFromIdleOnlyQueue actually does and how the DFSS scheduler is implemented.
DFSS Idle-Only Queue Scheduling
PsReleaseThreadFromIdleOnlyQueue initially checks whether the sorted block list is empty (which would imply there aren’t even any valid per-CPU quota entries), and it exits if this is the case. Otherwise, it acquires the idle-only queue spinlock from the per-CPU DFSS data structure and calls PspFindHighestPriorityThreadToRun. This function scans the sorted block list, recovering every per-CPU quota entry, and then scans every entry (which, if you recall, points to the Quota Wait Block for the thread). Unfortunately, because threads are not inserted by priority (such as real dispatcher ready queues), the entire idle-only queue must be scanned, and the highest priority found to this point is recorded in each iteration. (Because the lock is acquired, no new per-CPU quota entries or idle-only queue threads can be inserted during the scan.)
NOTE
Because DFSS is not truly integrated with the regular thread scheduler, the reason the threads are not sorted by priority is obvious: DFSS is not aware of priority changes after idle-only queue threads have been inserted in its lists. A user could still modify the priority, and because the thread scheduler does not notify DFSS of this, an incorrect thread would be picked.
Additionally, affinity is carefully checked to ensure only correctly affinitized threads are scanned. Although each idle-only queue contains only threads for the current processor, scenario #2 in the preceding section showed how remote processor idle-only queues can also be scanned. DFSS must ensure that the current CPU will run an appropriate remote-CPU, idle-only thread.
Once the highest priority thread has been found on the current per-CPU quota entry, it is removed from the idle-only queue and returned to the caller. Additionally, if this was the last thread on the idle-only queue, the per-CPU entry is removed from the sorted block list. Therefore, note that the other per-CPU quota entries are not checked unless a runnable highest-priority thread was not found on the first per-CPU quota entry (that is, the one with the highest base cycle allowance).
Once the thread is found, PsReleaseThreadFromIdleOnlyQueue resumes its execution and once more queues the DPC responsible for eventually launching the per-thread APC from earlier (after making sure the DPC is not already running). Thus, the APC is never directly queued in this case, because this function runs as part of the thread scheduler, already at DISPATCH_LEVEL. Additionally, it wouldn’t make sense to queue another per-thread APC just to notify the original APC; instead, the DPC itself will wake up the thread.
This is done by a special check in the DPC routine that checks whether the ThreadWaitBlockForRelease field in the per-CPU DFSS data structure is set. If so, the DPC knows that this is a wake-up, not a stop, request, and it sets the resume event associated with the Quota Wait Block. Additionally, it forces the Idle Scheduler on the current CPU to run, by setting the IdleSchedule field in the KPRCB that was brought up in the earlier idle scheduler section.
One detail has been glossed over, however: once the idle-only thread is picked, as soon as a context switch is initiated, the cycle accumulation once again detects that the thread has exhausted its cycles, and it re-inserts the thread in the idle-only queue. Therefore,PsReleaseThreadFromIdleOnlyQueue must update the cycles remaining for the current per-CPU quota entry, allowing this CPU to run the thread for a little bit longer. How much longer exactly is determined by the value of KiCyclesPerClockQuantum, which was shown in the earlierQuantum section. Therefore, this CPU is allowed to run the current thread for an entire quantum, at most.
Additionally, the base cycle allowance for this entry must be updated, because the quota for the CPU is actually exhausted and no longer working on a 150-ms cycle credit. Therefore, the allowance is now updated to include an extra KiCyclesPerClockQuantum divided by the weight of the session cycle. Because the base cycle allowance has changed, the sorted block list is reparsed, and the entries are re-sorted correctly to account for this change. Thus, this block will now migrate to the front of the list and have a higher chance to be picked once a future idle-only thread (within this interval) needs to be picked.
Session Weight Configuration
So far, the weight associated to sessions has been described as its default value of 5. However, this weight can be set to anywhere between 1 and 9, and DFSS provides two internal APIs for managing weight information: PsQueryCpuInformation and its Set equivalent.
Given an array of session handles (to session objects) and associated weights, the Set API sets the new weight for each session, as well as updating the total weight stored in the PspCpuQuotaControl global. By calling PspCalculateCpuQuotaBlockCycleCredits again, the new settings will be propagated. Likewise, the Query API returns an array of weights and session IDs. The SeIncreaseQuotaPrivilege is required in both cases, as well as SESSION_MODIFY_ACCESS for each session whose weight is being modified. Accessing these APIs is done through the native API function NtQuerySystemInformation, with the SystemCpuQuotaInformation call.
This API, although not provided by the Windows API directly, is what the Windows System Resource Manager uses when the administrator assigns different priorities to different users when the Weighted_Remote_Sessions policy is enabled. The three priorities—Premium, Standard, and Basic—map to the 1, 5, and 9 weights in the internal DFSS scheduler mechanism, respectively.
CPU Rate Limits
As part of the hard quota management system in Windows (based on the original soft-limit quota support present since the first version of Windows NT), support for limiting CPU usage exists in the system in three different ways: per-session, per-user, or per-system. Unfortunately, there is no tool that is part of the operating system that allows you to set these limits—you must modify the registry settings manually. Because all the quotas—save one—are memory quotas, we will cover those in Chapter 10 in Part 2, which deals with the memory manager, and instead focus our attention here on the CPU rate limit.
NOTE
See the topic “CPU rate limits in Windows Server 2008 R2 and Windows 7” in the Microsoft Technet Knowledge Articles at http://technet.microsoft.com/en-us/library/ff384148(WS.10).aspx for further documentation and examples on when to use CPU rate limits.
The new quota system can be accessed through the registry key HKLM\SYSTEM\CurrentControlSet\Control\Session Manager\QuotaSystem, as well as through the standard NtSetInformationProcess system call. CPU rate limits can therefore be set in one of three ways:
§ By creating a new DWORD value called CpuRateLimit and entering the rate information.
§ By creating a new key with the security ID (SID) of the account you want to limit, and creating a CpuRateLimit DWORD value inside that key.
§ By calling NtSetInformationProcess and giving it the process handle of the process to limit and the CPU rate limiting information, if the process is tied to the system quota block.
In all three cases, the CPU rate limit data is a straightforward value; it is simply a rate limit expressed as a percentage. For example, to limit a user’s applications to consume at most 10% of CPU time, you set CpuRateLimit to 10. The process manager, which is responsible for enforcing the CPU rate limit, uses various system mechanisms to do its job. First, rate limiting works reliably because of the CPU cycle count improvements discussed earlier, which allow the process manager to accurately determine how much CPU time a process has taken and know whether the limit should be enforced. It then uses a combination of DPC and APC routines to throttle down DPC and APC CPU usage, which are outside the direct control of user-mode developers but still result in CPU usage in the system (in the case of a systemwide CPU rate limit).
Finally, the main mechanism through which rate limiting works is by creating an artificial wait on an event object (making the thread uniquely bound to this object and putting it in a wait state, which does not consume CPU cycles). Threads that are artificially waiting because of CPU rate limits can be observed because their wait reason code is set to WrCpuRateControl. This mechanism operates through the normal routine of an APC object queued to the thread or threads inside the process currently responsible for the work. The event is eventually signaled by the DPC routine associated with a timer (firing every half a second) responsible for replenishing systemwide CPU usage requests.
Dynamic Processor Addition and Replacement
As you’ve seen, developers can fine-tune which threads are allowed to (and in the case of the ideal processor, should) run on which processor. This works fine on systems that have a constant number of processors during their run time. (For example, desktop machines require shutting down the computer to make any sort of hardware changes to the processor or their count.)
Today’s server systems, however, cannot afford the downtime that CPU replacement or addition normally requires. In fact, one example of when adding a CPU is required for a server is at times of high load that is above what the machine can support at its current level of performance. Having to shut down the server during a period of peak usage would defeat the purpose. To meet this requirement, the latest generation of server motherboards and systems support the addition of processors (as well as their replacement) while the machine is still running. The ACPI BIOS and related hardware on the machine have been specifically built to allow and be aware of this need, but operating system participation is required for full support.
Dynamic processor support is provided through the HAL, which notifies the kernel of a new processor on the system through the function KeStartDynamicProcessor. This routine does similar work to that performed when the system detects more than one processor at startup and needs to initialize the structures related to them. When a dynamic processor is added, various system components perform some additional work. For example, the memory manager allocates new pages and memory structures optimized for the CPU. It also initializes a new DPC kernel stack while the kernel initializes the global descriptor table (GDT), the interrupt Dispatch table (IDT), the processor control region (PCR), the process control block (PRCB), and other related structures for the processor.
Other executive parts of the kernel are also called, mostly to initialize the per-processor look-aside lists for the processor that was added. For example, the I/O manager, executive look-aside list code, cache manager, and object manager all use per-processor look-aside lists for their frequently allocated structures.
Finally, the kernel initializes threaded DPC support for the processor and adjusts exported kernel variables to report the new processor. Different memory-manager masks and process seeds based on processor counts are also updated, and processor features need to be updated for the new processor to match the rest of the system (for example, enabling virtualization support on the newly added processor). The initialization sequence completes with the notification to the Windows Hardware Error Architecture (WHEA) component that a new processor is online.
The HAL is also involved in this process. It is called once to start the dynamic processor after the kernel is aware of it, and it is called again after the kernel has finished initialization of the processor. However, these notifications and callbacks only make the kernel aware and respond to processor changes. Although an additional processor increases the throughput of the kernel, it does nothing to help drivers.
To handle drivers, the system has a new default executive callback object, the ProcessorAdd callback, that drivers can register with for notifications. Similar to the callbacks that notify drivers of power state or system time changes, this callback allows driver code to, for example, create a new worker thread if desirable so that it can handle more work at the same time.
Once drivers are notified, the final kernel component called is the Plug and Play manager, which adds the processor to the system’s device node and rebalances interrupts so that the new processor can handle interrupts that were already registered for other processors. CPU-hungry applications are also able to take advantage of newer processors as well.
However, a sudden change of affinity can have potentially breaking changes for a running application (especially when going from a single-processor to a multiprocessor environment) through the appearance of potential race conditions or simply misdistribution of work (because the process might have calculated the perfect ratios at startup, based on the number of CPUs it was aware of). As a result, applications do not take advantage of a dynamically added processor by default—they must request it.
The Windows APIs SetProcessAffinityUpdateMode and QueryProcessAffinityMode (which use the undocumented NtSet/QueryInformationProcess system call) tell the process manager that these applications should have their affinity updated (by setting the AffinityUpdateEnable flag in EPROCESS), or that they do not want to deal with affinity updates (by setting the AffinityPermanent flag in EPROCESS). Once an application has told the system that its affinity is permanent, it cannot later change its mind and request affinity updates, so this is a one-time change.
As part of KeStartDynamicProcessor, a new step has been added after interrupts are rebalanced, which is to call the process manager to perform affinity updates through PsUpdateActiveProcessAffinity. Some Windows core processes and services already have affinity updates enabled, while third-party software will need to be recompiled to take advantage of the new API call. The System process, Svchost processes, and Smss are all compatible with dynamic processor addition.
Job Objects
A job object is a nameable, securable, shareable kernel object that allows control of one or more processes as a group. A job object’s basic function is to allow groups of processes to be managed and manipulated as a unit. A process can be a member of only one job object. By default, its association with the job object can’t be broken and all processes created by the process and its descendants are associated with the same job object as well. The job object also records basic accounting information for all processes associated with the job and for all processes that were associated with the job but have since terminated.
Jobs can also be associated with an I/O completion port object, which other threads might be waiting for, with the Windows GetQueuedCompletionStatus function. This allows interested parties (typically, the job creator) to monitor for limit violation and events that could affect the job’s security (such as a new process being created or a process abnormally exiting).
Job Limits
The following are some of the CPU-related and memory-related limits you can specify for a job:
§ Maximum number of active processes. Limits the number of concurrently existing processes in the job.
§ Jobwide user-mode CPU time limit. Limits the maximum amount of user-mode CPU time that the processes in the job can consume (including processes that have run and exited). Once this limit is reached, by default all the processes in the job are terminated with an error code and no new processes can be created in the job (unless the limit is reset). The job object is signaled, so any threads waiting for the job will be released. You can change this default behavior with a call to SetInformationJobObject to set the EndOfJobTimeAction information class and request a notification to be sent through the job’s completion port instead.
§ Per-process user-mode CPU time limit. Allows each process in the job to accumulate only a fixed maximum amount of user-mode CPU time. When the maximum is reached, the process terminates (with no chance to clean up).
§ Job processor affinity. Sets the processor affinity mask for each process in the job. (Individual threads can alter their affinity to any subset of the job affinity, but processes can’t alter their process affinity setting.)
§ Job group affinity. Sets a list of groups to which the processes in the job can be assigned to. Any affinity changes are then subject to the group selection imposed by the limit. This is treated as a group-aware version of the job processor affinity limit (legacy), and prevents that limit from being used.
§ Job process priority class. Sets the priority class for each process in the job. Threads can’t increase their priority relative to the class (as they normally can). Attempts to increase thread priority are ignored. (No error is returned on calls to SetThreadPriority, but the increase doesn’t occur.)
§ Default working set minimum and maximum. Defines the specified working set minimum and maximum for each process in the job. (This setting isn’t jobwide—each process has its own working set with the same minimum and maximum values.)
§ Process and job committed virtual memory limit. Defines the maximum amount of virtual address space that can be committed by either a single process or the entire job.
You can also place security limits on processes in a job. You can set a job so that each process runs under the same jobwide access token. You can then create a job to restrict processes from impersonating or creating processes that have access tokens that contain the local administrator’s group. In addition, you can apply security filters so that when threads in processes contained in a job impersonate client threads, certain privileges and security IDs (SIDs) can be eliminated from the impersonation token.
Finally, you can also place user-interface limits on processes in a job. Such limits include being able to restrict processes from opening handles to windows owned by threads outside the job, reading and/or writing to the clipboard, and changing the many user-interface system parameters via the Windows SystemParametersInfo function. These user-interface limits are managed by the Windows subsystem GDI/USER driver, Win32k.sys, and are enforced through one of the special callouts that it registers with the process manager, the job callout.
Job Sets
The job implementation also allows for finer grained control of which job object a given process will be associated with by enabling the creation of job sets. A job set is an array that associates a job member level with each job object that was created by the caller. Later, when the process manager attempts to associate a process with a job, it picks the correct job object from the set based on the job member level that was associated with the newly created process (which must be higher than or equal to the parent’s job member level. This allows the parent process to have created multiple job objects, and for its children to pick the appropriate one depending on which limits the parent might want to enforce.
EXPERIMENT: VIEWING THE JOB OBJECT
You can view named job objects with the Performance tool. (See the Job Object and Job Object Details performance objects.) You can view unnamed jobs with the kernel debugger !job or dt nt!_ejob command.
To see whether a process is associated with a job, you can use the kernel debugger !process command or Process Explorer. Follow these steps to create and view an unnamed job object:
1. From the command prompt, use the runas command to create a process running the command prompt (Cmd.exe). For example, type runas /user:<domain>\< username> cmd. You’ll be prompted for your password. Enter your password, and a Command Prompt window will appear. The Windows service that executes runas commands creates an unnamed job to contain all processes (so that it can terminate these processes at logoff time).
2. From the command prompt, run Notepad.exe.
3. Then run Process Explorer, and notice that the Cmd.exe and Notepad.exe processes are highlighted as part of a job. (You can configure the colors used to highlight processes that are members of a job by clicking Options, Configure Colors.) Here is a screen shot showing these two processes:
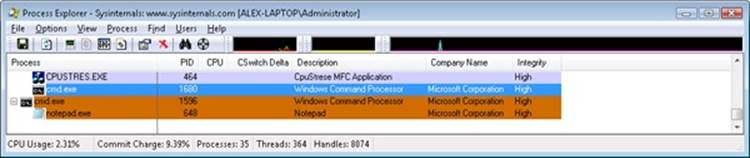
4. Double-click either the Cmd.exe or Notepad.exe process to bring up the process properties. You will see a Job tab in the process properties dialog box.
5. Click the Job tab to view the details about the job. In this case, there are no quotas associated with the job, but there are two member processes:
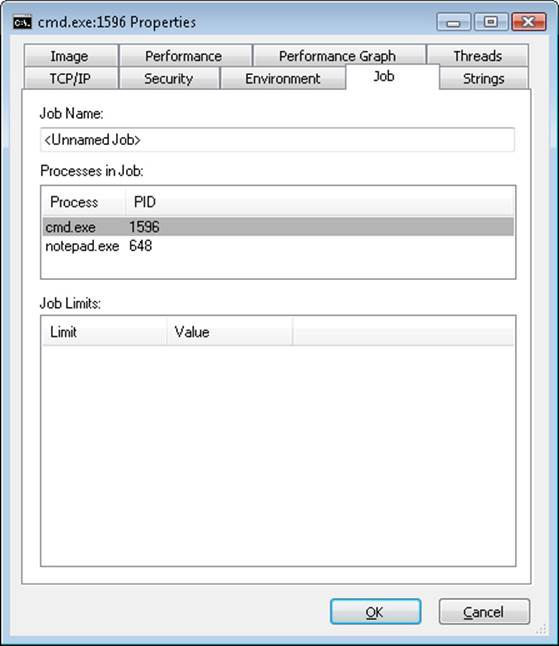
6. Now run the kernel debugger on the live system, display the process list with !process, and find the recently created process running Cmd.exe. Then display the process by using !process <process ID>, find the address of the job object, and finally display the job object with the !job command. Here’s some partial debugger output of these commands on a live system:
7. lkd> !process 0 1 cmd.exe
8. PROCESS 8567b758 SessionId: 1 Cid: 0fc4 Peb: 7ffdf000 ParentCid: 00b0
9. DirBase: 1b3fb000 ObjectTable: e18dd7d0 HandleCount: 19.
10. Image: Cmd.exe
11....
12. BasePriority 8
13. CommitCharge 636
14.... Job 85557988
15.
16.lkd> !job 85557988
17.Job at 85557988
18. TotalPageFaultCount 0
19. TotalProcesses 2
20. ActiveProcesses 2
21. TotalTerminatedProcesses 0
22. LimitFlags 0
...
23. You can also use the dt command to display the job object and see the additional fields shown about the job, such as its member level, if it is part of a job set:
24.lkd> dt nt!_ejob 85557988
25.nt!_EJOB
26. +0x000 Event : _KEVENT
27....
28. +0x0b8 EndOfJobTimeAction : 0
29. +0x0bc CompletionPort : 0x87e3d2e8
30. +0x0c0 CompletionKey : 0x07a89508
31. +0x0c4 SessionId : 1
32. +0x0c8 SchedulingClass : 5
33....
34. +0x120 MemberLevel : 0
+0x124 JobFlags : 0
35. Finally, if the job has UI limits, you can use the dt command to display the Win32k job structure (tagW32JOB). To do this, you must first obtain the W32PROCESS structure pointer as shown in the experiment at the beginning of this chapter, and then display the pW32Job field within it.
For example, here is the Win32k job structure for a process using the Block Access To Global Atom Table UI limitation. The structure shows the local atom table this process is using in pAtomTable. You can further explore this structure with the dt nt!_RTL_ATOM_TABLE command and see which atoms are defined:
lkd> ?? ((win32k!tagPROCESSINFO*)(((nt!_EPROCESS*)0x847c4740)->Win32Process))->pW32Job
struct tagW32JOB * 0xfd573300
+0x000 pNext : 0xff87c5d8 tagW32JOB
+0x004 Job : 0x8356ab90 _EJOB
+0x008 pAtomTable : 0x8e03eb18
+0x00c restrictions : 0xff
+0x010 uProcessCount : 1
+0x014 uMaxProcesses : 4
+0x018 ppiTable : 0xfe5072c0 -> 0xff97db18 tagPROCESSINFO
+0x01c ughCrt : 0
+0x020 ughMax : 0
+0x024 pgh : (null)
Conclusion
In this chapter, we examined the structure of processes and threads and jobs, saw how they are created, and looked at how Windows decides which threads should run and for how long, and on which processor or processors.
In the next chapter, we’ll look at a part of the system that sometimes receives more attention than anything else: the Windows security reference monitor.
All materials on the site are licensed Creative Commons Attribution-Sharealike 3.0 Unported CC BY-SA 3.0 & GNU Free Documentation License (GFDL)
If you are the copyright holder of any material contained on our site and intend to remove it, please contact our site administrator for approval.
© 2016-2026 All site design rights belong to S.Y.A.