Windows Internals, Sixth Edition, Part 2 (2012)
Chapter 10. Memory Management
In this chapter, you’ll learn how Windows implements virtual memory and how it manages the subset of virtual memory kept in physical memory. We’ll also describe the internal structure and components that make up the memory manager, including key data structures and algorithms. Before examining these mechanisms, we’ll review the basic services provided by the memory manager and key concepts such as reserved memory versus committed memory and shared memory.
Introduction to the Memory Manager
By default, the virtual size of a process on 32-bit Windows is 2 GB. If the image is marked specifically as large address space aware, and the system is booted with a special option (described later in this chapter), a 32-bit process can grow to be 3 GB on 32-bit Windows and to 4 GB on 64-bit Windows. The process virtual address space size on 64-bit Windows is 7,152 GB on IA64 systems and 8,192 GB on x64 systems. (This value could be increased in future releases.)
As you saw in Chapter 2, “System Architecture,” in Part 1 (specifically in Table 2-2), the maximum amount of physical memory currently supported by Windows ranges from 2 GB to 2,048 GB, depending on which version and edition of Windows you are running. Because the virtual address space might be larger or smaller than the physical memory on the machine, the memory manager has two primary tasks:
§ Translating, or mapping, a process’s virtual address space into physical memory so that when a thread running in the context of that process reads or writes to the virtual address space, the correct physical address is referenced. (The subset of a process’s virtual address space that is physically resident is called the working set. Working sets are described in more detail later in this chapter.)
§ Paging some of the contents of memory to disk when it becomes overcommitted—that is, when running threads or system code try to use more physical memory than is currently available—and bringing the contents back into physical memory when needed.
In addition to providing virtual memory management, the memory manager provides a core set of services on which the various Windows environment subsystems are built. These services include memory mapped files (internally called section objects), copy-on-write memory, and support for applications using large, sparse address spaces. In addition, the memory manager provides a way for a process to allocate and use larger amounts of physical memory than can be mapped into the process virtual address space at one time (for example, on 32-bit systems with more than 3 GB of physical memory). This is explained in the section Address Windowing Extensions later in this chapter.
NOTE
There is a Control Panel applet that provides control over the size, number, and locations of the paging files, and its nomenclature suggests that “virtual memory” is the same thing as the paging file. This is not the case. The paging file is only one aspect of virtual memory. In fact, even if you run with no page file at all, Windows will still be using virtual memory. This distinction is explained in more detail later in this chapter.
Memory Manager Components
The memory manager is part of the Windows executive and therefore exists in the file Ntoskrnl.exe. No parts of the memory manager exist in the HAL. The memory manager consists of the following components:
§ A set of executive system services for allocating, deallocating, and managing virtual memory, most of which are exposed through the Windows API or kernel-mode device driver interfaces
§ A translation-not-valid and access fault trap handler for resolving hardware-detected memory management exceptions and making virtual pages resident on behalf of a process
§ Six key top-level routines, each running in one of six different kernel-mode threads in the System process (see the experiment “Mapping a System Thread to a Device Driver,” which shows how to identify system threads, in Chapter 2 in Part 1):
§ The balance set manager (KeBalanceSetManager, priority 16). It calls an inner routine, the working set manager (MmWorkingSetManager), once per second as well as when free memory falls below a certain threshold. The working set manager drives the overall memory management policies, such as working set trimming, aging, and modified page writing.
§ The process/stack swapper (KeSwapProcessOrStack, priority 23) performs both process and kernel thread stack inswapping and outswapping. The balance set manager and the thread-scheduling code in the kernel awaken this thread when an inswap or outswap operation needs to take place.
§ The modified page writer (MiModifiedPageWriter, priority 17) writes dirty pages on the modified list back to the appropriate paging files. This thread is awakened when the size of the modified list needs to be reduced.
§ The mapped page writer (MiMappedPageWriter, priority 17) writes dirty pages in mapped files to disk (or remote storage). It is awakened when the size of the modified list needs to be reduced or if pages for mapped files have been on the modified list for more than 5 minutes. This second modified page writer thread is necessary because it can generate page faults that result in requests for free pages. If there were no free pages and there was only one modified page writer thread, the system could deadlock waiting for free pages.
§ The segment dereference thread (MiDereferenceSegmentThread, priority 18) is responsible for cache reduction as well as for page file growth and shrinkage. (For example, if there is no virtual address space for paged pool growth, this thread trims the page cache so that the paged pool used to anchor it can be freed for reuse.)
§ The zero page thread (MmZeroPageThread, base priority 0) zeroes out pages on the free list so that a cache of zero pages is available to satisfy future demand-zero page faults. Unlike the other routines described here, this routine is not a top-level thread function but is called by the top-level thread routine Phase1Initialization. MmZeroPageThread never returns to its caller, so in effect the Phase 1 Initialization thread becomes the zero page thread by calling this routine. Memory zeroing in some cases is done by a faster function called MiZeroInParallel. See the note in the section Page List Dynamics later in this chapter.
Each of these components is covered in more detail later in the chapter.
Internal Synchronization
Like all other components of the Windows executive, the memory manager is fully reentrant and supports simultaneous execution on multiprocessor systems—that is, it allows two threads to acquire resources in such a way that they don’t corrupt each other’s data. To accomplish the goal of being fully reentrant, the memory manager uses several different internal synchronization mechanisms, such as spinlocks, to control access to its own internal data structures. (Synchronization objects are discussed in Chapter 3, “System Mechanisms,” in Part 1.)
Some of the systemwide resources to which the memory manager must synchronize access include:
§ Dynamically allocated portions of the system virtual address space
§ System working sets
§ Kernel memory pools
§ The list of loaded drivers
§ The list of paging files
§ Physical memory lists
§ Image base randomization (ASLR) structures
§ Each individual entry in the page frame number (PFN) database
Per-process memory management data structures that require synchronization include the working set lock (held while changes are being made to the working set list) and the address space lock (held whenever the address space is being changed). Both these locks are implemented using pushlocks.
Examining Memory Usage
The Memory and Process performance counter objects provide access to most of the details about system and process memory utilization. Throughout the chapter, we’ll include references to specific performance counters that contain information related to the component being described. We’ve included relevant examples and experiments throughout the chapter. One word of caution, however: different utilities use varying and sometimes inconsistent or confusing names when displaying memory information. The following experiment illustrates this point. (We’ll explain the terms used in this example in subsequent sections.)
EXPERIMENT: VIEWING SYSTEM MEMORY INFORMATION
The Performance tab in the Windows Task Manager, shown in the following screen shot, displays basic system memory information. This information is a subset of the detailed memory information available through the performance counters. It includes data on both physical and virtual memory usage.
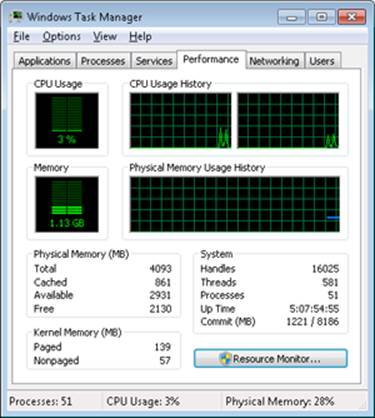
The following table shows the meaning of the memory-related values.
|
Task Manager Value |
Definition |
|
Memory bar histogram |
Bar/chart line height shows physical memory in use by Windows (not available as a performance counter). The remaining height of the graph is equal to the Available counter in the Physical Memory section, described later in the table. The total height of the graph is equal to the Total counter in that section. This represents the total RAM usable by the operating system, and does not include BIOS shadow pages, device memory, and so on. |
|
Physical Memory (MB): Total |
Physical memory usable by Windows |
|
Physical Memory (MB): Cached |
Sum of the following performance counters in the Memory object: Cache Bytes, Modified Page List Bytes, Standby Cache Core Bytes, Standby Cache Normal Priority Bytes, and Standby Cache Reserve Bytes (all in Memory object) |
|
Physical Memory (MB):Available |
Amount of memory that is immediately available for use by the operating system, processes, and drivers. Equal to the combined size of the standby, free, and zero page lists. |
|
Physical Memory (MB): Free |
Free and zero page list bytes |
|
Kernel Memory (MB): Paged |
Pool paged bytes. This is the total size of the pool, including both free and allocated regions |
|
Kernel Memory (MB): Nonpaged |
Pool nonpaged bytes. This is the total size of the pool, including both free and allocated regions |
|
System: Commit (two numbers shown) |
Equal to performance counters Committed Bytes and Commit Limit, respectively |
To see the specific usage of paged and nonpaged pool, use the Poolmon utility, described in the Monitoring Pool Usage section.
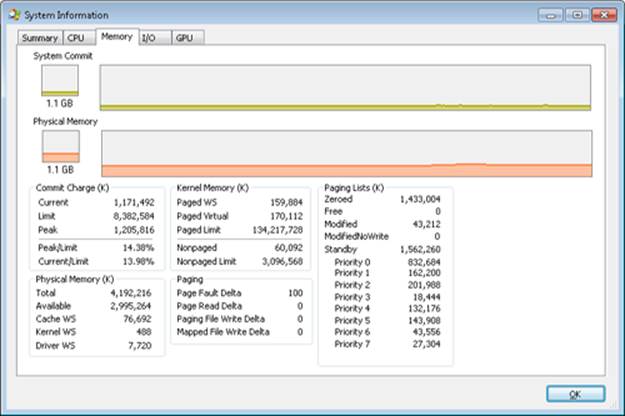
The Process Explorer tool from Windows Sysinternals (http://www.microsoft.com/technet/sysinternals) can show considerably more data about physical and virtual memory. On its main screen, click View and then System Information, and then choose the Memory tab. Here is an example display from a 32-bit Windows system:
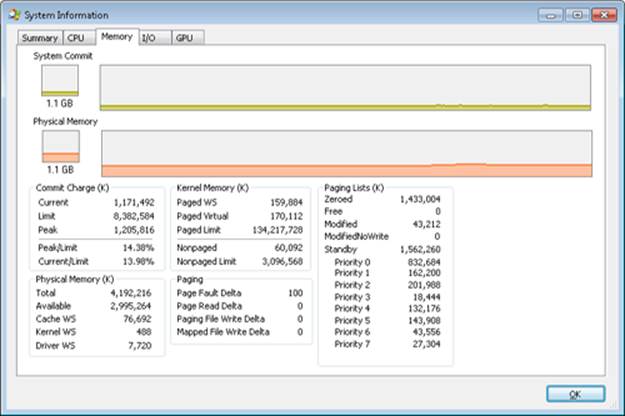
We will explain most of these additional counters in the relevant sections later in this chapter.
Two other Sysinternals tools show extended memory information:
§ VMMap shows the usage of virtual memory within a process to an extremely fine level of detail.
§ RAMMap shows detailed physical memory usage.
These tools will be featured in experiments found later in this chapter.
Finally, the !vm command in the kernel debugger shows the basic memory management information available through the memory-related performance counters. This command can be useful if you’re looking at a crash dump or hung system. Here’s an example of its output from a 4-GB Windows client system:
1: kd> !vm
*** Virtual Memory Usage ***
Physical Memory: 851757 ( 3407028 Kb)
Page File: \??\C:\pagefile.sys
Current: 3407028 Kb Free Space: 3407024 Kb
Minimum: 3407028 Kb Maximum: 4193280 Kb
Available Pages: 699186 ( 2796744 Kb)
ResAvail Pages: 757454 ( 3029816 Kb)
Locked IO Pages: 0 ( 0 Kb)
Free System PTEs: 370673 ( 1482692 Kb)
Modified Pages: 9799 ( 39196 Kb)
Modified PF Pages: 9798 ( 39192 Kb)
NonPagedPool Usage: 0 ( 0 Kb)
NonPagedPoolNx Usage: 8735 ( 34940 Kb)
NonPagedPool Max: 522368 ( 2089472 Kb)
PagedPool 0 Usage: 17573 ( 70292 Kb)
PagedPool 1 Usage: 2417 ( 9668 Kb)
PagedPool 2 Usage: 0 ( 0 Kb)
PagedPool 3 Usage: 0 ( 0 Kb)
PagedPool 4 Usage: 28 ( 112 Kb)
PagedPool Usage: 20018 ( 80072 Kb)
PagedPool Maximum: 523264 ( 2093056 Kb)
Session Commit: 6218 ( 24872 Kb)
Shared Commit: 18591 ( 74364 Kb)
Special Pool: 0 ( 0 Kb)
Shared Process: 2151 ( 8604 Kb)
PagedPool Commit: 20031 ( 80124 Kb)
Driver Commit: 4531 ( 18124 Kb)
Committed pages: 179178 ( 716712 Kb)
Commit limit: 1702548 ( 6810192 Kb)
Total Private: 66073 ( 264292 Kb)
0a30 CCC.exe 11078 ( 44312 Kb)
0548 dwm.exe 6548 ( 26192 Kb)
091c MOM.exe 6103 ( 24412 Kb)
...
We will describe many of the details of the output of this command later in this chapter.
Services Provided by the Memory Manager
The memory manager provides a set of system services to allocate and free virtual memory, share memory between processes, map files into memory, flush virtual pages to disk, retrieve information about a range of virtual pages, change the protection of virtual pages, and lock the virtual pages into memory.
Like other Windows executive services, the memory management services allow their caller to supply a process handle indicating the particular process whose virtual memory is to be manipulated. The caller can thus manipulate either its own memory or (with the proper permissions) the memory of another process. For example, if a process creates a child process, by default it has the right to manipulate the child process’s virtual memory. Thereafter, the parent process can allocate, deallocate, read, and write memory on behalf of the child process by calling virtual memory services and passing a handle to the child process as an argument. This feature is used by subsystems to manage the memory of their client processes. It is also essential for implementing debuggers because debuggers must be able to read and write to the memory of the process being debugged.
Most of these services are exposed through the Windows API. The Windows API has three groups of functions for managing memory in applications: heap functions (Heapxxx and the older interfaces Localxxx and Globalxxx, which internally make use of the Heapxxx APIs), which may be used for allocations smaller than a page; virtual memory functions, which operate with page granularity (Virtualxxx); and memory mapped file functions (CreateFileMapping, CreateFileMappingNuma, MapViewOfFile, MapViewOfFileEx, and MapViewOfFileExNuma). (We’ll describe the heap manager later in this chapter.)
The memory manager also provides a number of services (such as allocating and deallocating physical memory and locking pages in physical memory for direct memory access [DMA] transfers) to other kernel-mode components inside the executive as well as to device drivers. These functions begin with the prefix Mm. In addition, though not strictly part of the memory manager, some executive support routines that begin with Ex are used to allocate and deallocate from the system heaps (paged and nonpaged pool) as well as to manipulate look-aside lists. We’ll touch on these topics later in this chapter in the section Kernel-Mode Heaps (System Memory Pools)).
Large and Small Pages
The virtual address space is divided into units called pages. That is because the hardware memory management unit translates virtual to physical addresses at the granularity of a page. Hence, a page is the smallest unit of protection at the hardware level. (The various page protection options are described in the section Protecting Memory later in the chapter.) The processors on which Windows runs support two page sizes, called small and large. The actual sizes vary based on the processor architecture, and they are listed in Table 10-1.
Table 10-1. Page Sizes
|
Architecture |
Small Page Size |
Large Page Size |
Small Pages per Large Page |
|
x86 |
4 KB |
4 MB (2 MB if Physical Address Extension (PAE) enabled (PAE is described later in the chapter) |
1,024 (512 with PAE) |
|
x64 |
4 KB |
2 MB |
512 |
|
IA64 |
8 KB |
16 MB |
2,048 |
NOTE
IA64 processors support a variety of dynamically configurable page sizes, from 4 KB up to 256 MB. Windows on Itanium uses 8 KB and 16 MB for small and large pages, respectively, as a result of performance tests that confirmed these values as optimal. Additionally, recent x64 processors support a size of 1 GB for large pages, but Windows does not use this feature.
The primary advantage of large pages is speed of address translation for references to other data within the large page. This advantage exists because the first reference to any byte within a large page will cause the hardware’s translation look-aside buffer (TLB, described in a later section) to have in its cache the information necessary to translate references to any other byte within the large page. If small pages are used, more TLB entries are needed for the same range of virtual addresses, thus increasing recycling of entries as new virtual addresses require translation. This, in turn, means having to go back to the page table structures when references are made to virtual addresses outside the scope of a small page whose translation has been cached. The TLB is a very small cache, and thus large pages make better use of this limited resource.
To take advantage of large pages on systems with more than 2 GB of RAM, Windows maps with large pages the core operating system images (Ntoskrnl.exe and Hal.dll) as well as core operating system data (such as the initial part of nonpaged pool and the data structures that describe the state of each physical memory page). Windows also automatically maps I/O space requests (calls by device drivers to MmMapIoSpace) with large pages if the request is of satisfactory large page length and alignment. In addition, Windows allows applications to map their images, private memory, and page-file-backed sections with large pages. (See the MEM_LARGE_PAGE flag on the VirtualAlloc, VirtualAllocEx, and VirtualAllocExNuma functions.) You can also specify other device drivers to be mapped with large pages by adding a multistring registry value to HKLM\SYSTEM\CurrentControlSet\Control\Session Manager\Memory Management\LargePageDrivers and specifying the names of the drivers as separately null-terminated strings.
Attempts to allocate large pages may fail after the operating system has been running for an extended period, because the physical memory for each large page must occupy a significant number (see Table 10-1) of physically contiguous small pages, and this extent of physical pages must furthermore begin on a large page boundary. (For example, physical pages 0 through 511 could be used as a large page on an x64 system, as could physical pages 512 through 1,023, but pages 10 through 521 could not.) Free physical memory does become fragmented as the system runs. This is not a problem for allocations using small pages but can cause large page allocations to fail.
It is not possible to specify anything but read/write access to large pages. The memory is also always nonpageable, because the page file system does not support large pages. And, because the memory is nonpageable, it is not considered part of the process working set (described later). Nor are large page allocations subject to job-wide limits on virtual memory usage.
There is an unfortunate side effect of large pages. Each page (whether large or small) must be mapped with a single protection that applies to the entire page (because hardware memory protection is on a per-page basis). If a large page contains, for example, both read-only code and read/write data, the page must be marked as read/write, which means that the code will be writable. This means that device drivers or other kernel-mode code could, as a result of a bug, modify what is supposed to be read-only operating system or driver code without causing a memory access violation. If small pages are used to map the operating system’s kernel-mode code, the read-only portions of Ntoskrnl.exe and Hal.dll can be mapped as read-only pages. Using small pages does reduce efficiency of address translation, but if a device driver (or other kernel-mode code) attempts to modify a read-only part of the operating system, the system will crash immediately with the exception information pointing at the offending instruction in the driver. If the write was allowed to occur, the system would likely crash later (in a harder-to-diagnose way) when some other component tried to use the corrupted data.
If you suspect you are experiencing kernel code corruptions, enable Driver Verifier (described later in this chapter), which will disable the use of large pages.
Reserving and Committing Pages
Pages in a process virtual address space are free, reserved, committed, or shareable. Committed and shareable pages are pages that, when accessed, ultimately translate to valid pages in physical memory.
Committed pages are also referred to as private pages. This reflects the fact that committed pages cannot be shared with other processes, whereas shareable pages can be (but, of course, might be in use by only one process).
Private pages are allocated through the Windows VirtualAlloc, VirtualAllocEx, and VirtualAllocExNuma functions. These functions allow a thread to reserve address space and then commit portions of the reserved space. The intermediate “reserved” state allows the thread to set aside a range of contiguous virtual addresses for possible future use (such as an array), while consuming negligible system resources, and then commit portions of the reserved space as needed as the application runs. Or, if the size requirements are known in advance, a thread can reserve and commit in the same function call. In either case, the resulting committed pages can then be accessed by the thread. Attempting to access free or reserved memory results in an exception because the page isn’t mapped to any storage that can resolve the reference.
If committed (private) pages have never been accessed before, they are created at the time of first access as zero-initialized pages (or demand zero). Private committed pages may later be automatically written to the paging file by the operating system if required by demand for physical memory. “Private” refers to the fact that these pages are normally inaccessible to any other process.
NOTE
There are functions, such as ReadProcessMemory and WriteProcessMemory, that apparently permit cross-process memory access, but these are implemented by running kernel-mode code in the context of the target process (this is referred to as attaching to the process). They also require that either the security descriptor of the target process grant the accessor thePROCESS_VM_READ or PROCESS_VM_WRITE right, respectively, or that the accessor holds SeDebugPrivilege, which is by default granted only to members of the Administrators group.
Shared pages are usually mapped to a view of a section, which in turn is part or all of a file, but may instead represent a portion of page file space. All shared pages can potentially be shared with other processes. Sections are exposed in the Windows API as file mapping objects.
When a shared page is first accessed by any process, it will be read in from the associated mapped file (unless the section is associated with the paging file, in which case it is created as a zero-initialized page). Later, if it is still resident in physical memory, the second and subsequent processes accessing it can simply use the same page contents that are already in memory. Shared pages might also have been prefetched by the system.
Two upcoming sections of this chapter, Shared Memory and Mapped Files and Section Objects, go into much more detail about shared pages. Pages are written to disk through a mechanism called modified page writing. This occurs as pages are moved from a process’s working set to a systemwide list called the modified page list; from there, they are written to disk (or remote storage). (Working sets and the modified list are explained later in this chapter.) Mapped file pages can also be written back to their original files on disk as a result of an explicit call toFlushViewOfFile or by the mapped page writer as memory demands dictate.
You can decommit private pages and/or release address space with the VirtualFree or VirtualFreeEx function. The difference between decommittal and release is similar to the difference between reservation and committal—decommitted memory is still reserved, but released memory has been freed; it is neither committed nor reserved.
Using the two-step process of reserving and then committing virtual memory defers committing pages—and, thereby, defers adding to the system “commit charge” described in the next section—until needed, but keeps the convenience of virtual contiguity. Reserving memory is a relatively inexpensive operation because it consumes very little actual memory. All that needs to be updated or constructed is the relatively small internal data structures that represent the state of the process address space. (We’ll explain these data structures, called page tables andvirtual address descriptors, or VADs, later in the chapter.)
One extremely common use for reserving a large space and committing portions of it as needed is the user-mode stack for each thread. When a thread is created, a stack is created by reserving a contiguous portion of the process address space. (1 MB is the default; you can override this size with the CreateThread and CreateRemoteThread function calls or change it on an imagewide basis by using the /STACK linker flag.) By default, the initial page in the stack is committed and the next page is marked as a guard page (which isn’t committed) that traps references beyond the end of the committed portion of the stack and expands it.
EXPERIMENT: RESERVED VS. COMMITTED PAGES
The TestLimit utility (which you can download from the Windows Internals book webpage) can be used to allocate large amounts of either reserved or private committed virtual memory, and the difference can be observed via Process Explorer. First, open two Command Prompt windows. Invoke TestLimit in one of them to create a large amount of reserved memory:
C:\temp>testlimit -r 1 -c 800
Testlimit v5.2 - test Windows limits
Copyright (C) 2012 Mark Russinovich
Sysinternals - wwww.sysinternals.com
Process ID: 1544
Reserving private bytes 1 MB at a time ...
Leaked 800 MB of reserved memory (800 MB total leaked). Lasterror: 0
The operation completed successfully.
In the other window, create a similar amount of committed memory:
C:\temp>testlimit -m 1 -c 800
Testlimit v5.2 - test Windows limits
Copyright (C) 2012 Mark Russinovich
Sysinternals - wwww.sysinternals.com
Process ID: 2828
Leaking private bytes 1 KB at a time ...
Leaked 800 MB of private memory (800 MB total leaked). Lasterror: 0
The operation completed successfully.
Now run Task Manager, go to the Processes tab, and use the Select Columns command on the View menu to include Memory—Commit Size in the display. Find the two instances of TestLimit in the list. They should appear something like the following figure.
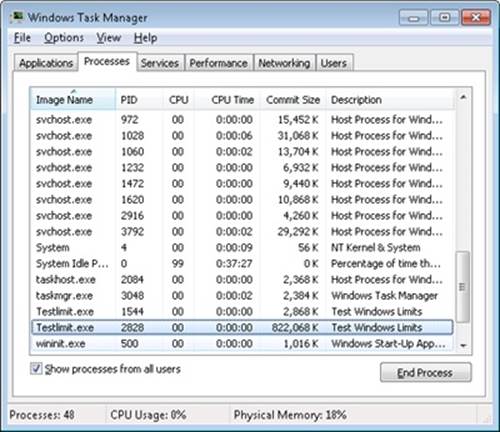
Task Manager shows the committed size, but it has no counters that will reveal the reserved memory in the other TestLimit process.
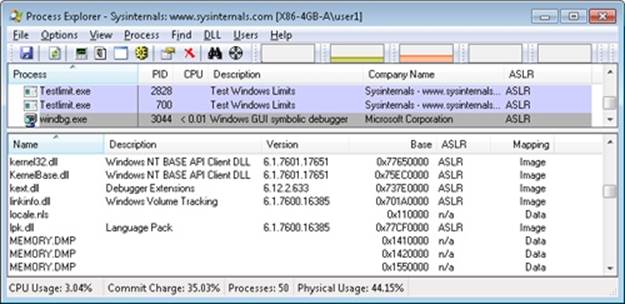
Finally, invoke Process Explorer. Choose View, Select Columns, select the Process Memory tab, and enable the Private Bytes and Virtual Size counters. Find the two TestLimit processes in the main display:
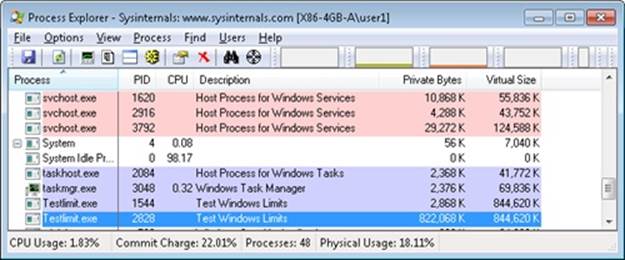
Notice that the virtual sizes of the two processes are identical, but only one shows a value for Private Bytes comparable to that for Virtual Size. The large difference in the other TestLimit process (process ID 1544) is due to the reserved memory. The same comparison could be made in Performance Monitor by looking at the Process | Virtual Bytes and Process | Private Bytes counters.
Commit Limit
On Task Manager’s Performance tab, there are two numbers following the legend Commit. The memory manager keeps track of private committed memory usage on a global basis, termed commitment or commit charge; this is the first of the two numbers, which represents the total of all committed virtual memory in the system.
There is a systemwide limit, called the system commit limit or simply the commit limit, on the amount of committed virtual memory that can exist at any one time. This limit corresponds to the current total size of all paging files, plus the amount of RAM that is usable by the operating system. This is the second of the two numbers displayed as Commit on Task Manager’s Performance tab. The memory manager can increase the commit limit automatically by expanding one or more of the paging files, if they are not already at their configured maximum size.
Commit charge and the system commit limit will be explained in more detail in a later section.
Locking Memory
In general, it’s better to let the memory manager decide which pages remain in physical memory. However, there might be special circumstances where it might be necessary for an application or device driver to lock pages in physical memory. Pages can be locked in memory in two ways:
§ Windows applications can call the VirtualLock function to lock pages in their process working set. Pages locked using this mechanism remain in memory until explicitly unlocked or until the process that locked them terminates. The number of pages a process can lock can’t exceed its minimum working set size minus eight pages. Therefore, if a process needs to lock more pages, it can increase its working set minimum with the SetProcessWorkingSetSizeEx function (referred to in the section Working Set Management).
§ Device drivers can call the kernel-mode functions MmProbeAndLockPages, MmLockPagableCodeSection, MmLockPagableDataSection, or MmLockPagableSectionByHandle. Pages locked using this mechanism remain in memory until explicitly unlocked. The last three of these APIs enforce no quota on the number of pages that can be locked in memory because the resident available page charge is obtained when the driver first loads; this ensures that it can never cause a system crash due to overlocking. For the first API, quota charges must be obtained or the API will return a failure status.
Allocation Granularity
Windows aligns each region of reserved process address space to begin on an integral boundary defined by the value of the system allocation granularity, which can be retrieved from the Windows GetSystemInfo or GetNativeSystemInfo function. This value is 64 KB, a granularity that is used by the memory manager to efficiently allocate metadata (for example, VADs, bitmaps, and so on) to support various process operations. In addition, if support were added for future processors with larger page sizes (for example, up to 64 KB) or virtually indexed caches that require systemwide physical-to-virtual page alignment, the risk of requiring changes to applications that made assumptions about allocation alignment would be reduced.
NOTE
Windows kernel-mode code isn’t subject to the same restrictions; it can reserve memory on a single-page granularity (although this is not exposed to device drivers for the reasons detailed earlier). This level of granularity is primarily used to pack TEB allocations more densely, and because this mechanism is internal only, this code can easily be changed if a future platform requires different values. Also, for the purposes of supporting 16-bit and MS-DOS applications on x86 systems only, the memory manager provides the MEM_DOS_LIM flag to the MapViewOfFileEx API, which is used to force the use of single-page granularity.
Finally, when a region of address space is reserved, Windows ensures that the size and base of the region is a multiple of the system page size, whatever that might be. For example, because x86 systems use 4-KB pages, if you tried to reserve a region of memory 18 KB in size, the actual amount reserved on an x86 system would be 20 KB. If you specified a base address of 3 KB for an 18-KB region, the actual amount reserved would be 24 KB. Note that the VAD for the allocation would then also be rounded to 64-KB alignment/length, thus making the remainder of it inaccessible. (VADs will be described later in this chapter.)
Shared Memory and Mapped Files
As is true with most modern operating systems, Windows provides a mechanism to share memory among processes and the operating system. Shared memory can be defined as memory that is visible to more than one process or that is present in more than one process virtual address space. For example, if two processes use the same DLL, it would make sense to load the referenced code pages for that DLL into physical memory only once and share those pages between all processes that map the DLL, as illustrated in Figure 10-1.
Each process would still maintain its private memory areas in which to store private data, but the DLL code and unmodified data pages could be shared without harm. As we’ll explain later, this kind of sharing happens automatically because the code pages in executable images (.exe and .dll files, and several other types like screen savers (.scr), which are essentially DLLs under other names) are mapped as execute-only and writable pages are mapped as copy-on-write. (See the section Copy-on-Write for more information.)
The underlying primitives in the memory manager used to implement shared memory are called section objects, which are exposed as file mapping objects in the Windows API. The internal structure and implementation of section objects are described in the section Section Objectslater in this chapter.
This fundamental primitive in the memory manager is used to map virtual addresses, whether in main memory, in the page file, or in some other file that an application wants to access as if it were in memory. A section can be opened by one process or by many; in other words, section objects don’t necessarily equate to shared memory.
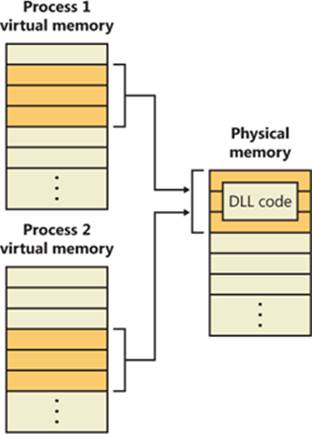
Figure 10-1. Sharing memory between processes
A section object can be connected to an open file on disk (called a mapped file) or to committed memory (to provide shared memory). Sections mapped to committed memory are called page-file-backed sections because the pages are written to the paging file (as opposed to a mapped file) if demands on physical memory require it. (Because Windows can run with no paging file, page-file-backed sections might in fact be “backed” only by physical memory.) As with any other empty page that is made visible to user mode (such as private committed pages), shared committed pages are always zero-filled when they are first accessed to ensure that no sensitive data is ever leaked.
To create a section object, call the Windows CreateFileMapping or CreateFileMappingNuma function, specifying the file handle to map it to (or INVALID_HANDLE_VALUE for a page-file-backed section) and optionally a name and security descriptor. If the section has a name, other processes can open it with OpenFileMapping. Or you can grant access to section objects through either handle inheritance (by specifying that the handle be inheritable when opening or creating the handle) or handle duplication (by using DuplicateHandle). Device drivers can also manipulate section objects with the ZwOpenSection, ZwMapViewOfSection, and ZwUnmapViewOfSection functions.
A section object can refer to files that are much larger than can fit in the address space of a process. (If the paging file backs a section object, sufficient space must exist in the paging file and/or RAM to contain it.) To access a very large section object, a process can map only the portion of the section object that it requires (called a view of the section) by calling the MapViewOfFile, MapViewOfFileEx, or MapViewOfFileExNuma function and then specifying the range to map. Mapping views permits processes to conserve address space because only the views of the section object needed at the time must be mapped into memory.
Windows applications can use mapped files to conveniently perform I/O to files by simply making them appear in their address space. User applications aren’t the only consumers of section objects: the image loader uses section objects to map executable images, DLLs, and device drivers into memory, and the cache manager uses them to access data in cached files. (For information on how the cache manager integrates with the memory manager, see Chapter 11.) The implementation of shared memory sections, both in terms of address translation and the internal data structures, is explained later in this chapter.
EXPERIMENT: VIEWING MEMORY MAPPED FILES
You can list the memory mapped files in a process by using Process Explorer from Sysinternals. To view the memory mapped files by using Process Explorer, configure the lower pane to show the DLL view. (Click on View, Lower Pane View, DLLs.) Note that this is more than just a list of DLLs—it represents all memory mapped files in the process address space. Some of these are DLLs, one is the image file (EXE) being run, and additional entries might represent memory mapped data files.
For example, the following display from Process Explorer shows a WinDbg process using several different memory mappings to access the memory dump file being examined. Like most Windows programs, it (or one of the Windows DLLs it is using) is also using memory mapping to access a Windows data file called Locale.nls, which is part of the internationalization support in Windows.
You can also search for memory mapped files by clicking Find, DLL. This can be useful when trying to determine which process(es) are using a DLL or a memory mapped file that you are trying to replace.
Protecting Memory
As explained in Chapter 1, “Concepts and Tools,” in Part 1, Windows provides memory protection so that no user process can inadvertently or deliberately corrupt the address space of another process or of the operating system. Windows provides this protection in four primary ways.
First, all systemwide data structures and memory pools used by kernel-mode system components can be accessed only while in kernel mode—user-mode threads can’t access these pages. If they attempt to do so, the hardware generates a fault, which in turn the memory manager reports to the thread as an access violation.
Second, each process has a separate, private address space, protected from being accessed by any thread belonging to another process. Even shared memory is not really an exception to this because each process accesses the shared regions using addresses that are part of its own virtual address space. The only exception is if another process has virtual memory read or write access to the process object (or holds SeDebugPrivilege) and thus can use the ReadProcessMemory or WriteProcessMemory function. Each time a thread references an address, the virtual memory hardware, in concert with the memory manager, intervenes and translates the virtual address into a physical one. By controlling how virtual addresses are translated, Windows can ensure that threads running in one process don’t inappropriately access a page belonging to another process.
Third, in addition to the implicit protection virtual-to-physical address translation offers, all processors supported by Windows provide some form of hardware-controlled memory protection (such as read/write, read-only, and so on); the exact details of such protection vary according to the processor. For example, code pages in the address space of a process are marked read-only and are thus protected from modification by user threads.
Table 10-2 lists the memory protection options defined in the Windows API. (See the VirtualProtect, VirtualProtectEx, VirtualQuery, and VirtualQueryEx functions.)
Table 10-2. Memory Protection Options Defined in the Windows API
|
Attribute |
Description |
|
PAGE_NOACCESS |
Any attempt to read from, write to, or execute code in this region causes an access violation. |
|
PAGE_READONLY |
Any attempt to write to (and on processors with no execute support, execute code in) memory causes an access violation, but reads are permitted. |
|
PAGE_READWRITE |
The page is readable and writable but not executable. |
|
PAGE_EXECUTE |
Any attempt to write to code in memory in this region causes an access violation, but execution (and read operations on all existing processors) is permitted. |
|
PAGE_EXECUTE_READ[a] |
Any attempt to write to memory in this region causes an access violation, but executes and reads are permitted. |
|
PAGE_EXECUTE_READWRITE[b] |
The page is readable, writable, and executable—any attempted access will succeed. |
|
PAGE_WRITECOPY |
Any attempt to write to memory in this region causes the system to give the process a private copy of the page. On processors with no-execute support, attempts to execute code in memory in this region cause an access violation. |
|
PAGE_EXECUTE_WRITECOPY |
Any attempt to write to memory in this region causes the system to give the process a private copy of the page. Reading and executing code in this region is permitted. (No copy is made in this case.) |
|
PAGE_GUARD |
Any attempt to read from or write to a guard page raises an EXCEPTION_GUARD_PAGE exception and turns off the guard page status. Guard pages thus act as a one-shot alarm. Note that this flag can be specified with any of the page protections listed in this table except PAGE_NOACCESS. |
|
PAGE_NOCACHE |
Uses physical memory that is not cached. This is not recommended for general usage. It is useful for device drivers—for example, mapping a video frame buffer with no caching. |
|
PAGE_WRITECOMBINE |
Enables write-combined memory accesses. When enabled, the processor does not cache memory writes (possibly causing significantly more memory traffic than if memory writes were cached), but it does try to aggregate write requests to optimize performance. For example, if multiple writes are made to the same address, only the most recent write might occur. Separate writes to adjacent addresses may be similarly collapsed into a single large write. This is not typically used for general applications, but it is useful for device drivers—for example, mapping a video frame buffer as write combined. |
|
[a] No execute protection is supported on processors that have the necessary hardware support (for example, all x64 and IA64 processors) but not in older x86 processors. [b] No execute protection is supported on processors that have the necessary hardware support (for example, all x64 and IA64 processors) but not in older x86 processors. |
|
And finally, shared memory section objects have standard Windows access control lists (ACLs) that are checked when processes attempt to open them, thus limiting access of shared memory to those processes with the proper rights. Access control also comes into play when a thread creates a section to contain a mapped file. To create the section, the thread must have at least read access to the underlying file object or the operation will fail.
Once a thread has successfully opened a handle to a section, its actions are still subject to the memory manager and the hardware-based page protections described earlier. A thread can change the page-level protection on virtual pages in a section if the change doesn’t violate the permissions in the ACL for that section object. For example, the memory manager allows a thread to change the pages of a read-only section to have copy-on-write access but not to have read/write access. The copy-on-write access is permitted because it has no effect on other processes sharing the data.
No Execute Page Protection
No execute page protection (also referred to as data execution prevention, or DEP) causes an attempt to transfer control to an instruction in a page marked as “no execute” to generate an access fault. This can prevent certain types of malware from exploiting bugs in the system through the execution of code placed in a data page such as the stack. DEP can also catch poorly written programs that don’t correctly set permissions on pages from which they intend to execute code. If an attempt is made in kernel mode to execute code in a page marked as no execute, the system will crash with the ATTEMPTED_EXECUTE_OF_NOEXECUTE_MEMORY bugcheck code. (See Chapter 14, for an explanation of these codes.) If this occurs in user mode, a STATUS_ACCESS_VIOLATION (0xc0000005) exception is delivered to the thread attempting the illegal reference. If a process allocates memory that needs to be executable, it must explicitly mark such pages by specifying the PAGE_EXECUTE, PAGE_EXECUTE_READ, PAGE_EXECUTE_READWRITE, or PAGE_EXECUTE_WRITECOPY flags on the page granularitymemory allocation functions.
On 32-bit x86 systems that support DEP, bit 63 in the page table entry (PTE) is used to mark a page as nonexecutable. Therefore, the DEP feature is available only when the processor is running in Physical Address Extension (PAE) mode, without which page table entries are only 32 bits wide. (See the section Physical Address Extension (PAE) later in this chapter.) Thus, support for hardware DEP on 32-bit systems requires loading the PAE kernel (%SystemRoot%\System32\Ntkrnlpa.exe), even if that system does not require extended physical addressing (for example, physical addresses greater than 4 GB). The operating system loader automatically loads the PAE kernel on 32-bit systems that support hardware DEP. To force the non-PAE kernel to load on a system that supports hardware DEP, the BCD option nx must be set to AlwaysOff, and the pae option must be set to ForceDisable.
On 64-bit versions of Windows, execution protection is always applied to all 64-bit processes and device drivers and can be disabled only by setting the nx BCD option to AlwaysOff. Execution protection for 32-bit programs depends on system configuration settings, described shortly. On 64-bit Windows, execution protection is applied to thread stacks (both user and kernel mode), user-mode pages not specifically marked as executable, kernel paged pool, and kernel session pool (for a description of kernel memory pools, see the section Kernel-Mode Heaps (System Memory Pools). However, on 32-bit Windows, execution protection is applied only to thread stacks and user-mode pages, not to paged pool and session pool.
The application of execution protection for 32-bit processes depends on the value of the BCD nx option. The settings can be changed by going to the Data Execution Prevention tab under Computer, Properties, Advanced System Settings, Performance Settings. (See Figure 10-2.) When you configure no execute protection in the Performance Options dialog box, the BCD nx option is set to the appropriate value. Table 10-3 lists the variations of the values and how they correspond to the DEP settings tab. The registry lists 32-bit applications that are excluded from execution protection under the key HKLM\SOFTWARE\Microsoft\Windows NT\CurrentVersion\AppCompatFlags\Layers, with the value name being the full path of the executable and the data set to “DisableNXShowUI”.
On Windows client versions (both 64-bit and 32-bit) execution protection for 32-bit processes is configured by default to apply only to core Windows operating system executables (the nx BCD option is set to OptIn) so as not to break 32-bit applications that might rely on being able to execute code in pages not specifically marked as executable, such as self-extracting or packed applications. On Windows server systems, execution protection for 32-bit applications is configured by default to apply to all 32-bit programs (the nx BCD option is set to OptOut).
NOTE
To obtain a complete list of which programs are protected, install the Windows Application Compatibility Toolkit (downloadable from www.microsoft.com) and run the Compatibility Administrator Tool. Click System Database, Applications, and then Windows Components. The pane at the right shows the list of protected executables.
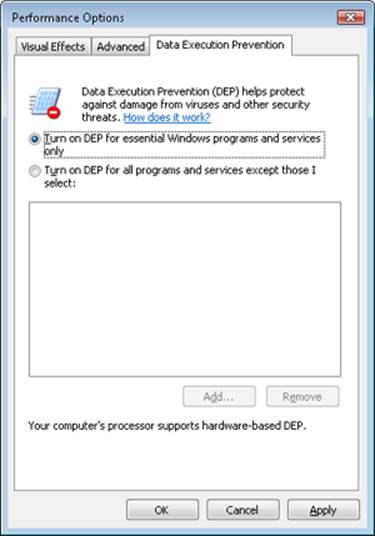
Figure 10-2. Data Execution Prevention tab settings
Table 10-3. BCD nx Values
|
BCD nx Value |
Option on DEP Settings Tab |
Meaning |
|
OptIn |
Turn on DEP for essential Windows programs and services only |
Enables DEP for core Windows system images. Enables 32-bit processes to dynamically configure DEP for their lifetime. |
|
OptOut |
Turn on DEP for all programs and services except those I select |
Enables DEP for all executables except those specified. Enables 32-bit processes to dynamically configure DEP for their lifetime. Enables system compatibility fixes for DEP. |
|
AlwaysOn |
No dialog box option for this setting |
Enables DEP for all components with no ability to exclude certain applications. Disables dynamic configuration for 32-bit processes, and disables system compatibility fixes. |
|
AlwaysOff |
No dialog box option for this setting |
Disables DEP (not recommended). Disables dynamic configuration for 32-bit processes. |
Even if you force DEP to be enabled, there are still other methods through which applications can disable DEP for their own images. For example, regardless of the execution protection options that are enabled, the image loader (see Chapter 3 in Part 1 for more information about the image loader) will verify the signature of the executable against known copy-protection mechanisms (such as SafeDisc and SecuROM) and disable execution protection to provide compatibility with older copy-protected software such as computer games.
EXPERIMENT: LOOKING AT DEP PROTECTION ON PROCESSES
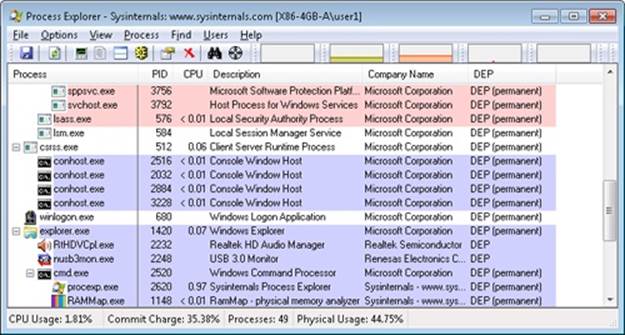
Process Explorer can show you the current DEP status for all the processes on your system, including whether the process is opted in or benefiting from permanent protection. To look at the DEP status for processes, right-click any column in the process tree, choose Select Columns, and then select DEP Status on the Process Image tab. Three values are possible:
§ DEP (permanent) This means that the process has DEP enabled because it is a “necessary Windows program or service.”
§ DEP This means that the process opted in to DEP. This may be due to a systemwide policy to opt in all 32-bit processes, an API call such as SetProcessDEPPolicy, or setting the linker flag /NXCOMPAT when the image was built.
§ Nothing If the column displays no information for this process, DEP is disabled, either because of a systemwide policy or an explicit API call or shim.
The following Process Explorer window shows an example of a system on which DEP is set to OptOut, Turn On DEP For All Programs And Services Except Those That I Select. Note that two processes running in the user’s login, a third-party sound-card manager and a USB port monitor, show simply DEP, meaning that DEP can be turned off for them via the dialog box shown in Figure 10-2. The other processes shown are running Windows in-box programs and show DEP (Permanent), indicating that DEP cannot be disabled for them.
Additionally, to provide compatibility with older versions of the Active Template Library (ATL) framework (version 7.1 or earlier), the Windows kernel provides an ATL thunk emulation environment. This environment detects ATL thunk code sequences that have caused the DEP exception and emulates the expected operation. Application developers can request that ATL thunk emulation not be applied by using the latest Microsoft C++ compiler and specifying the /NXCOMPAT flag (which sets the IMAGE_DLLCHARACTERISTICS_NX_COMPAT flag in the PE header), which tells the system that the executable fully supports DEP. Note that ATL thunk emulation is permanently disabled if the AlwaysOn value is set.
Finally, if the system is in OptIn or OptOut mode and executing a 32-bit process, the SetProcessDEPPolicy function allows a process to dynamically disable DEP or to permanently enable it. (Once enabled through this API, DEP cannot be disabled programmatically for the lifetime of the process.) This function can also be used to dynamically disable ATL thunk emulation in case the image wasn’t compiled with the /NXCOMPAT flag. On 64-bit processes or systems booted with AlwaysOff or AlwaysOn, the function always returns a failure. TheGetProcessDEPPolicy function returns the 32-bit per-process DEP policy (it fails on 64-bit systems, where the policy is always the same—enabled), while GetSystemDEPPolicy can be used to return a value corresponding to the policies in Table 10-3.
Software Data Execution Prevention
For older processors that do not support hardware no execute protection, Windows supports limited software data execution prevention (DEP). One aspect of software DEP reduces exploits of the exception handling mechanism in Windows. (See Chapter 3 in Part 1 for a description of structured exception handling.) If the program’s image files are built with safe structured exception handling (a feature in the Microsoft Visual C++ compiler that is enabled with the /SAFESEH flag), before an exception is dispatched, the system verifies that the exception handler is registered in the function table (built by the compiler) located within the image file.
The previous mechanism depends on the program’s image files being built with safe structured exception handling. If they are not, software DEP guards against overwrites of the structured exception handling chain on the stack in x86 processes via a mechanism known as Structured Exception Handler Overwrite Protection (SEHOP). A new symbolic exception registration record is added on the stack when a thread first begins user-mode execution. The normal exception registration chain will lead to this record. When an exception occurs, the exception dispatcher will first walk the list of exception handler registration records to ensure that the chain leads to this symbolic record. If it does not, the exception chain must have been corrupted (either accidentally or deliberately), and the exception dispatcher will simply terminate the process without calling any of the exception handlers described on the stack. Address Space Layout Randomization (ASLR) contributes to the robustness of this method by making it more difficult for attacking code to know the location of the function pointed to by the symbolic exception registration record, and so to construct a fake symbolic record of its own.
To further validate the SEH handler when /SAFESEH is not present, a mechanism called Image Dispatch Mitigation ensures that the SEH handler is located within the same image section as the function that raised an exception, which is normally the case for most programs (although not necessarily, since some DLLs might have exception handlers that were set up by the main executable, which is why this mitigation is off by default). Finally, Executable Dispatch Mitigation further makes sure that the SEH handler is located within an executable page—a less strong requirement than Image Dispatch Mitigation, but one with fewer compatibility issues.
Two other methods for software DEP that the system implements are stack cookies and pointer encoding. The first relies on the compiler to insert special code at the beginning and end of each potentially exploitable function. The code saves a special numerical value (the cookie) on the stack on entry and validates the cookie’s value before returning to the caller saved on the stack (which would have now been corrupted to point to a piece of malicious code). If the cookie value is mismatched, the application is terminated and not allowed to continue executing. The cookie value is computed for each boot when executing the first user-mode thread, and it is saved in the KUSER_SHARED_DATA structure. The image loader reads this value and initializes it when a process starts executing in user mode. (See Chapter 3 in Part 1 for more information on the shared data section and the image loader.)
The cookie value that is calculated is also saved for use with the EncodeSystemPointer and DecodeSystemPointer APIs, which implement pointer encoding. When an application or a DLL has static pointers that are dynamically called, it runs the risk of having malicious code overwrite the pointer values with code that the malware controls. By encoding all pointers with the cookie value and then decoding them, when malicious code sets a nonencoded pointer, the application will still attempt to decode the pointer, resulting in a corrupted value and causing the program to crash. The EncodePointer and DecodePointer APIs provide similar protection but with a per-process cookie (created on demand) instead of a per-system cookie.
NOTE
The system cookie is a combination of the system time at generation, the stack value of the saved system time, the number of page faults, and the current interrupt time.
Copy-on-Write
Copy-on-write page protection is an optimization the memory manager uses to conserve physical memory. When a process maps a copy-on-write view of a section object that contains read/write pages, instead of making a process private copy at the time the view is mapped, the memory manager defers making a copy of the pages until the page is written to. For example, as shown in Figure 10-3, two processes are sharing three pages, each marked copy-on-write, but neither of the two processes has attempted to modify any data on the pages.
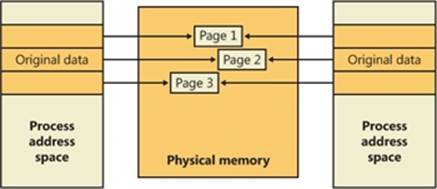
Figure 10-3. The “before” of copy-on-write
If a thread in either process writes to a page, a memory management fault is generated. The memory manager sees that the write is to a copy-on-write page, so instead of reporting the fault as an access violation, it allocates a new read/write page in physical memory, copies the contents of the original page to the new page, updates the corresponding page-mapping information (explained later in this chapter) in this process to point to the new location, and dismisses the exception, thus causing the instruction that generated the fault to be reexecuted. This time, the write operation succeeds, but as shown in Figure 10-4, the newly copied page is now private to the process that did the writing and isn’t visible to the other process still sharing the copy-on-write page. Each new process that writes to that same shared page will also get its own private copy.
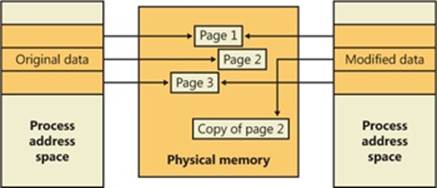
Figure 10-4. The “after” of copy-on-write
One application of copy-on-write is to implement breakpoint support in debuggers. For example, by default, code pages start out as execute-only. If a programmer sets a breakpoint while debugging a program, however, the debugger must add a breakpoint instruction to the code. It does this by first changing the protection on the page to PAGE_EXECUTE_READWRITE and then changing the instruction stream. Because the code page is part of a mapped section, the memory manager creates a private copy for the process with the breakpoint set, while other processes continue using the unmodified code page.
Copy-on-write is one example of an evaluation technique known as lazy evaluation that the memory manager uses as often as possible. Lazy-evaluation algorithms avoid performing an expensive operation until absolutely required—if the operation is never required, no time is wasted on it.
To examine the rate of copy-on-write faults, see the performance counter Memory: Write Copies/sec.
Address Windowing Extensions
Although the 32-bit version of Windows can support up to 64 GB of physical memory (as shown in Table 2-2 in Part 1), each 32-bit user process has by default only a 2-GB virtual address space. (This can be configured up to 3 GB when using the increaseuserva BCD option, described in the upcoming section User Address Space Layout.) An application that needs to make more than 2 GB (or 3 GB) of data easily available in a single process could do so via file mapping, remapping a part of its address space into various portions of a large file. However, significant paging would be involved upon each remap.
For higher performance (and also more fine-grained control), Windows provides a set of functions called Address Windowing Extensions (AWE). These functions allow a process to allocate more physical memory than can be represented in its virtual address space. It then can access the physical memory by mapping a portion of its virtual address space into selected portions of the physical memory at various times.
Allocating and using memory via the AWE functions is done in three steps:
1. Allocating the physical memory to be used. The application uses the Windows functions AllocateUserPhysicalPages or AllocateUserPhysicalPagesNuma. (These require the Lock Pages In Memory user right.)
2. Creating one or more regions of virtual address space to act as windows to map views of the physical memory. The application uses the Win32 VirtualAlloc, VirtualAllocEx, or VirtualAllocExNuma function with the MEM_PHYSICAL flag.
3. The preceding steps are, generally speaking, initialization steps. To actually use the memory, the application uses MapUserPhysicalPages or MapUserPhysicalPagesScatter to map a portion of the physical region allocated in step 1 into one of the virtual regions, or windows, allocated in step 2.
Figure 10-5 shows an example. The application has created a 256-MB window in its address space and has allocated 4 GB of physical memory (on a system with more than 4 GB of physical memory). It can then use MapUserPhysicalPages or MapUserPhysicalPagesScatter to access any portion of the physical memory by mapping the desired portion of memory into the 256-MB window. The size of the application’s virtual address space window determines the amount of physical memory that the application can access with any given mapping. To access another portion of the allocated RAM, the application can simply remap the area.
The AWE functions exist on all editions of Windows and are usable regardless of how much physical memory a system has. However, AWE is most useful on 32-bit systems with more than 2 GB of physical memory because it provides a way for a 32-bit process to access more RAM than its virtual address space would otherwise allow. Another use is for security purposes: because AWE memory is never paged out, the data in AWE memory can never have a copy in the paging file that someone could examine by rebooting into an alternate operating system. (VirtualLock provides the same guarantee for pages in general.)
Finally, there are some restrictions on memory allocated and mapped by the AWE functions:
§ Pages can’t be shared between processes.
§ The same physical page can’t be mapped to more than one virtual address in the same process.
§ Page protection is limited to read/write, read-only, and no access.
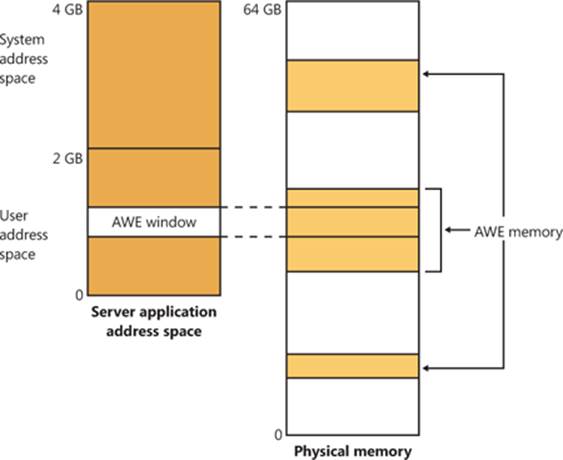
Figure 10-5. Using AWE to map physical memory
AWE is less useful on x64 or IA64 Windows systems because these systems support 8 TB or 7 TB (respectively) of virtual address space per process, while allowing a maximum of only 2 TB of RAM. Therefore, AWE is not necessary to allow an application to use more RAM than it has virtual address space; the amount of RAM on the system will always be smaller than the process virtual address space. AWE remains useful, however, for setting up nonpageable regions of a process address space. It provides finer granularity than the file mapping APIs (the system page size, 4 KB or 8 KB, versus 64 KB).
For a description of the page table data structures used to map memory on systems with more than 4 GB of physical memory, see the section Physical Address Extension (PAE).
Kernel-Mode Heaps (System Memory Pools)
At system initialization, the memory manager creates two dynamically sized memory pools, or heaps, that most kernel-mode components use to allocate system memory:
§ Nonpaged pool Consists of ranges of system virtual addresses that are guaranteed to reside in physical memory at all times and thus can be accessed at any time without incurring a page fault; therefore, they can be accessed from any IRQL. One of the reasons nonpaged pool is required is because of the rule described in Chapter 2 in Part 1: page faults can’t be satisfied at DPC/dispatch level or above. Therefore, any code and data that might execute or be accessed at or above DPC/dispatch level must be in nonpageable memory.
§ Paged pool A region of virtual memory in system space that can be paged into and out of the system. Device drivers that don’t need to access the memory from DPC/dispatch level or above can use paged pool. It is accessible from any process context.
Both memory pools are located in the system part of the address space and are mapped in the virtual address space of every process. The executive provides routines to allocate and deallocate from these pools; for information on these routines, see the functions that start withExAllocatePool and ExFreePool in the WDK documentation.
Systems start with four paged pools (combined to make the overall system paged pool) and one nonpaged pool; more are created, up to a maximum of 64, depending on the number of NUMA nodes on the system. Having more than one paged pool reduces the frequency of system code blocking on simultaneous calls to pool routines. Additionally, the different pools created are mapped across different virtual address ranges that correspond to different NUMA nodes on the system. (The different data structures, such as the large page look-aside lists, to describe pool allocations are also mapped across different NUMA nodes. More information on NUMA optimizations will follow later.)
In addition to the paged and nonpaged pools, there are a few other pools with special attributes or uses. For example, there is a pool region in session space, which is used for data that is common to all processes in the session. (Sessions are described in Chapter 1 in Part 1.) There is a pool called, quite literally, special pool. Allocations from special pool are surrounded by pages marked as no-access to help isolate problems in code that accesses memory before or after the region of pool it allocated. Special pool is described in Chapter 14.
Pool Sizes
Nonpaged pool starts at an initial size based on the amount of physical memory on the system and then grows as needed. For nonpaged pool, the initial size is 3 percent of system RAM. If this is less than 40 MB, the system will instead use 40 MB as long as 10 percent of RAM results in more than 40 MB; otherwise 10 percent of RAM is chosen as a minimum.
Windows dynamically chooses the maximum size of the pools and allows a given pool to grow from its initial size to the maximums shown in Table 10-4.
Table 10-4. Maximum Pool Sizes
|
Pool Type |
Maximum on 32-Bit Systems |
Maximum on 64-Bit Systems |
|
Nonpaged |
75% of physical memory or 2 GB, whichever is smaller |
75% of physical memory or 128 GB, whichever is smaller |
|
Paged |
2 GB |
128 GB |
Four of these computed sizes are stored in kernel variables, three of which are exposed as performance counters, and one is computed only as a performance counter value. These variables and counters are listed in Table 10-5.
Table 10-5. System Pool Size Variables and Performance Counters
|
Kernel Variable |
Performance Counter |
Description |
|
MmSizeOfNonPagedPoolInBytes |
Memory: Pool Nonpaged Bytes |
Size of the initial nonpaged pool. This can be reduced or enlarged automatically by the system if memory demands dictate. The kernel variable will not show these changes, but the performance counter will. |
|
MmMaximumNonPagedPoolInBytes |
Not available |
Maximum size of nonpaged pool |
|
Not available |
Memory: Pool Paged Bytes |
Current total virtual size of paged pool |
|
WorkingSetSize (number of pages) in the MmPagedPoolWs struct (type _MMSUPPORT) |
Memory: Pool Paged Resident Bytes |
Current physical (resident) size of paged pool |
|
MmSizeOfPagedPoolInBytes |
Not available |
Maximum (virtual) size of paged pool |
EXPERIMENT: DETERMINING THE MAXIMUM POOL SIZES
You can obtain the pool maximums by using either Process Explorer or live kernel debugging (explained in Chapter 1 in Part 1). To view pool maximums with Process Explorer, click on View, System Information, and then click the Memory tab. The pool limits are displayed in the Kernel Memory middle section, as shown here:
Note that for Process Explorer to retrieve this information, it must have access to the symbols for the kernel running on your system. (For a description of how to configure Process Explorer to use symbols, see the experiment “Viewing Process Details with Process Explorer” in Chapter 1 in Part 1.)
To view the same information by using the kernel debugger, you can use the !vm command as shown here:
kd> !vm
1: kd> !vm
*** Virtual Memory Usage ***
Physical Memory: 851757 ( 3407028 Kb)
Page File: \??\C:\pagefile.sys
Current: 3407028 Kb Free Space: 3407024 Kb
Minimum: 3407028 Kb Maximum: 4193280 Kb
Available Pages: 699186 ( 2796744 Kb)
ResAvail Pages: 757454 ( 3029816 Kb)
Locked IO Pages: 0 ( 0 Kb)
Free System PTEs: 370673 ( 1482692 Kb)
Modified Pages: 9799 ( 39196 Kb)
Modified PF Pages: 9798 ( 39192 Kb)
NonPagedPool Usage: 0 ( 0 Kb)
NonPagedPoolNx Usage: 8735 ( 34940 Kb)
NonPagedPool Max: 522368 ( 2089472 Kb)
PagedPool 0 Usage: 17573 ( 70292 Kb)
PagedPool 1 Usage: 2417 ( 9668 Kb)
PagedPool 2 Usage: 0 ( 0 Kb)
PagedPool 3 Usage: 0 ( 0 Kb)
PagedPool 4 Usage: 28 ( 112 Kb)
PagedPool Usage: 20018 ( 80072 Kb)
PagedPool Maximum: 523264 ( 2093056 Kb)
...
On this 4-GB, 32-bit system, nonpaged and paged pool were far from their maximums.
You can also examine the values of the kernel variables listed in Table 10-5. The following were taken from a 32-bit system:
lkd> ? poi(MmMaximumNonPagedPoolInBytes)
Evaluate expression: 2139619328 = 7f880000
lkd> ? poi(MmSizeOfPagedPoolInBytes)
Evaluate expression: 2143289344 = 7fc00000
From this example, you can see that the maximum size of both nonpaged and paged pool is approximately 2 GB, typical values on 32-bit systems with large amounts of RAM. On the system used for this example, current nonpaged pool usage was 35 MB and paged pool usage was 80 MB, so both pools were far from full.
Monitoring Pool Usage
The Memory performance counter object has separate counters for the size of nonpaged pool and paged pool (both virtual and physical). In addition, the Poolmon utility (in the WDK) allows you to monitor the detailed usage of nonpaged and paged pool. When you run Poolmon, you should see a display like the one shown in Figure 10-6.
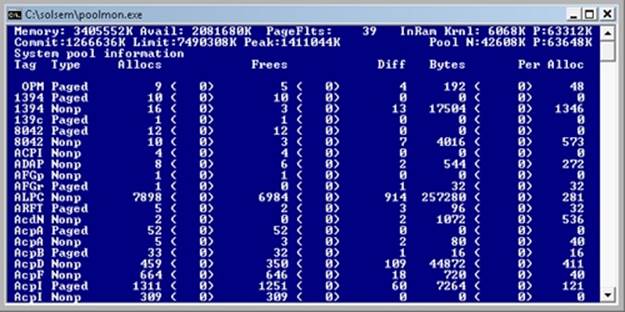
Figure 10-6. Poolmon output
The highlighted lines you might see represent changes to the display. (You can disable the highlighting feature by typing a slash (/) while running Poolmon. Type / again to reenable highlighting.) Type ? while Poolmon is running to bring up its help screen. You can configure which pools you want to monitor (paged, nonpaged, or both) and the sort order. For example, by pressing the P key until only nonpaged allocations are shown, and then the D key to sort by the Diff (differences) column, you can find out what kind of structures are most numerous in nonpaged pool. Also, the command-line options are shown, which allow you to monitor specific tags (or every tag but one tag). For example, the command poolmon –iCM will monitor only CM tags (allocations from the configuration manager, which manages the registry). The columns have the meanings shown in Table 10-6.
Table 10-6. Poolmon Columns
|
Column |
Explanation |
|
Tag |
Four-byte tag given to the pool allocation |
|
Type |
Pool type (paged or nonpaged pool) |
|
Allocs |
Count of all allocations (The number in parentheses shows the difference in the Allocs column since the last update.) |
|
Frees |
Count of all Frees (The number in parentheses shows the difference in the Frees column since the last update.) |
|
Diff |
Count of Allocs minus Frees |
|
Bytes |
Total bytes consumed by this tag (The number in parentheses shows the difference in the Bytes column since the last update.) |
|
Per Alloc |
Size in bytes of a single instance of this tag |
For a description of the meaning of the pool tags used by Windows, see the file \Program Files\Debugging Tools for Windows\Triage\Pooltag.txt. (This file is installed as part of the Debugging Tools for Windows, described in Chapter 1 in Part 1.) Because third-party device driver pool tags are not listed in this file, you can use the –c switch on the 32-bit version of Poolmon that comes with the WDK to generate a local pool tag file (Localtag.txt). This file will contain pool tags used by drivers found on your system, including third-party drivers. (Note that if a device driver binary has been deleted after it was loaded, its pool tags will not be recognized.)
Alternatively, you can search the device drivers on your system for a pool tag by using the Strings.exe tool from Sysinternals. For example, the command
strings %SYSTEMROOT%\system32\drivers\*.sys | findstr /i "abcd"
will display drivers that contain the string “abcd”. Note that device drivers do not necessarily have to be located in %SystemRoot%\System32\Drivers—they can be in any folder. To list the full path of all loaded drivers, open the Run dialog box from the Start menu, and then typeMsinfo32. Click Software Environment, and then click System Drivers. As already noted, if a device driver has been loaded and then deleted from the system, it will not be listed here.
An alternative to view pool usage by device driver is to enable the pool tracking feature of Driver Verifier, explained later in this chapter. While this makes the mapping from pool tag to device driver unnecessary, it does require a reboot (to enable Driver Verifier on the desired drivers). After rebooting with pool tracking enabled, you can either run the graphical Driver Verifier Manager (%SystemRoot%\System32\Verifier.exe) or use the Verifier /Log command to send the pool usage information to a file.
Finally, you can view pool usage with the kernel debugger !poolused command. The command !poolused 2 shows nonpaged pool usage sorted by pool tag using the most amount of pool. The command !poolused 4 lists paged pool usage, again sorted by pool tag using the most amount of pool. The following example shows the partial output from these two commands:
lkd> !poolused 2
Sorting by NonPaged Pool Consumed
Pool Used:
NonPaged Paged
Tag Allocs Used Allocs Used
Cont 1669 15801344 0 0 Contiguous physical memory allocations for
device drivers
Int2 414 5760072 0 0 UNKNOWN pooltag 'Int2', please update
pooltag.txt
LSwi 1 2623568 0 0 initial work context
EtwB 117 2327832 10 409600 Etw Buffer , Binary: nt!etw
Pool 5 1171880 0 0 Pool tables, etc.
lkd> !poolused 4
Sorting by Paged Pool Consumed
Pool Used:
NonPaged Paged
Tag Allocs Used Allocs Used
CM25 0 0 3921 16777216 Internal Configuration manager allocations ,
Binary: nt!cm
MmRe 0 0 720 13508136 UNKNOWN pooltag 'MmRe', please update
pooltag.txt
MmSt 0 0 5369 10827440 Mm section object prototype ptes ,
Binary: nt!mm
Ntff 9 2232 4210 3738480 FCB_DATA , Binary: ntfs.sys
AlMs 0 0 212 2450448 ALPC message , Binary: nt!alpc
ViMm 469 440584 608 1468888 Video memory manager , Binary: dxgkrnl.sys
EXPERIMENT: TROUBLESHOOTING A POOL LEAK
In this experiment, you will fix a real paged pool leak on your system so that you can put to use the techniques described in the previous section to track down the leak. The leak will be generated by the Notmyfault tool from Sysinternals. When you run Notmyfault.exe, it loads the device driver Myfault.sys and presents the following dialog box:
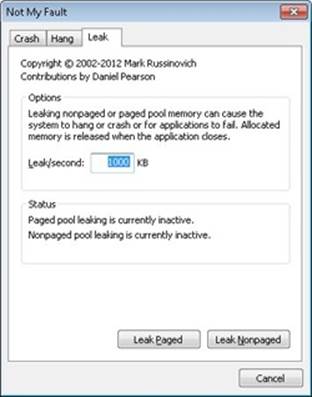
1. Click the Leak tab, ensure that Leak/Second is set to 1000 KB, and click the Leak Paged button. This causes Notmyfault to begin sending requests to the Myfault device driver to allocate paged pool. Notmyfault will continue sending requests until you click the Stop Paged button. Note that paged pool is not normally released even when you close a program that has caused it to occur (by interacting with a buggy device driver); the pool is permanently leaked until you reboot the system. However, to make testing easier, the Myfault device driver detects that the process was closed and frees its allocations.
2. While the pool is leaking, first open Task Manager and click on the Performance tab. You should notice Kernel Memory (MB): Paged climbing. You can also check this with Process Explorer’s System Information display. (Click View, System Information, and then the Memory tab.)
3. To determine the pool tag that is leaking, run Poolmon and press the B key to sort by the number of bytes. Press P twice so that Poolmon is showing only paged pool. You should notice the pool tag “Leak” climbing to the top of the list. (Poolmon shows changes to pool allocations by highlighting the lines that change.)
4. Now press the Stop Paged button so that you don’t exhaust paged pool on your system.
5. Using the technique described in the previous section, run Strings (from Sysinternals) to look for driver binaries that contain the pool tag “Leak”:
Strings %SystemRoot%\system32\drivers\*.sys | findstr Leak
This should display a match on the file Myfault.sys, thus confirming it as the driver using the “Leak” pool tag.
Look-Aside Lists
Windows also provides a fast memory allocation mechanism called look-aside lists. The basic difference between pools and look-aside lists is that while general pool allocations can vary in size, a look-aside list contains only fixed-sized blocks. Although the general pools are more flexible in terms of what they can supply, look-aside lists are faster because they don’t use any spinlocks.
Executive components and device drivers can create look-aside lists that match the size of frequently allocated data structures by using the ExInitializeNPagedLookasideList and ExInitializePagedLookasideList functions (documented in the WDK). To minimize the overhead of multiprocessor synchronization, several executive subsystems (such as the I/O manager, cache manager, and object manager) create separate look-aside lists for each processor for their frequently accessed data structures. The executive also creates a general per-processor paged andnonpaged look-aside list for small allocations (256 bytes or less).
If a look-aside list is empty (as it is when it’s first created), the system must allocate from paged or nonpaged pool. But if it contains a freed block, the allocation can be satisfied very quickly. (The list grows as blocks are returned to it.) The pool allocation routines automatically tune the number of freed buffers that look-aside lists store according to how often a device driver or executive subsystem allocates from the list—the more frequent the allocations, the more blocks are stored on a list. Look-aside lists are automatically reduced in size if they aren’t being allocated from. (This check happens once per second when the balance set manager system thread wakes up and calls the function ExAdjustLookasideDepth.)
EXPERIMENT: VIEWING THE SYSTEM LOOK-ASIDE LISTS
You can display the contents and sizes of the various system look-aside lists with the kernel debugger !lookaside command. The following excerpt is from the output of this command:
lkd> !lookaside
Lookaside "nt!IopSmallIrpLookasideList" @ 81f47c00 "Irps"
Type = 0000 NonPagedPool
Current Depth = 3 Max Depth = 4
Size = 148 Max Alloc = 592
AllocateMisses = 930 FreeMisses = 780
TotalAllocates = 13748 TotalFrees = 13601
Hit Rate = 93% Hit Rate = 94%
Lookaside "nt!IopLargeIrpLookasideList" @ 81f47c80 "Irpl"
Type = 0000 NonPagedPool
Current Depth = 4 Max Depth = 4
Size = 472 Max Alloc = 1888
AllocateMisses = 16555 FreeMisses = 15636
TotalAllocates = 59287 TotalFrees = 58372
Hit Rate = 72% Hit Rate = 73%
Lookaside "nt!IopMdlLookasideList" @ 81f47b80 "Mdl "
Type = 0000 NonPagedPool
Current Depth = 4 Max Depth = 4
Size = 96 Max Alloc = 384
AllocateMisses = 16287 FreeMisses = 15474
TotalAllocates = 72835 TotalFrees = 72026
Hit Rate = 77% Hit Rate = 78%
...
Total NonPaged currently allocated for above lists = 0
Total NonPaged potential for above lists = 3280
Total Paged currently allocated for above lists = 744
Total Paged potential for above lists = 1536
Heap Manager
Most applications allocate smaller blocks than the 64-KB minimum allocation granularity possible using page granularity functions such as VirtualAlloc and VirtualAllocExNuma. Allocating such a large area for relatively small allocations is not optimal from a memory usage and performance standpoint. To address this need, Windows provides a component called the heap manager, which manages allocations inside larger memory areas reserved using the page granularity memory allocation functions. The allocation granularity in the heap manager is relatively small: 8 bytes on 32-bit systems, and 16 bytes on 64-bit systems. The heap manager has been designed to optimize memory usage and performance in the case of these smaller allocations.
The heap manager exists in two places: Ntdll.dll and Ntoskrnl.exe. The subsystem APIs (such as the Windows heap APIs) call the functions in Ntdll, and various executive components and device drivers call the functions in Ntoskrnl. Its native interfaces (prefixed with Rtl) are available only for use in internal Windows components or kernel-mode device drivers. The documented Windows API interfaces to the heap (prefixed with Heap) are forwarders to the native functions in Ntdll.dll. In addition, legacy APIs (prefixed with either Local or Global) are provided to support older Windows applications, which also internally call the heap manager, using some of its specialized interfaces to support legacy behavior. The C runtime (CRT) also uses the heap manager when using functions such as malloc, free, and the C++ new operator. The most common Windows heap functions are:
§ HeapCreate or HeapDestroy Creates or deletes, respectively, a heap. The initial reserved and committed size can be specified at creation.
§ HeapAlloc Allocates a heap block.
§ HeapFree Frees a block previously allocated with HeapAlloc.
§ HeapReAlloc Changes the size of an existing allocation (grows or shrinks an existing block).
§ HeapLock or HeapUnlock Controls mutual exclusion to the heap operations.
§ HeapWalk Enumerates the entries and regions in a heap.
Types of Heaps
Each process has at least one heap: the default process heap. The default heap is created at process startup and is never deleted during the process’s lifetime. It defaults to 1 MB in size, but it can be made bigger by specifying a starting size in the image file by using the /HEAP linker flag. This size is just the initial reserve, however—it will expand automatically as needed. (You can also specify the initial committed size in the image file.)
The default heap can be explicitly used by a program or implicitly used by some Windows internal functions. An application can query the default process heap by making a call to the Windows function GetProcessHeap. Processes can also create additional private heaps with theHeapCreate function. When a process no longer needs a private heap, it can recover the virtual address space by calling HeapDestroy. An array with all heaps is maintained in each process, and a thread can query them with the Windows function GetProcessHeaps.
A heap can manage allocations either in large memory regions reserved from the memory manager via VirtualAlloc or from memory mapped file objects mapped in the process address space. The latter approach is rarely used in practice, but it’s suitable for scenarios where the content of the blocks needs to be shared between two processes or between a kernel-mode and a user-mode component. The Win32 GUI subsystem driver (Win32k.sys) uses such a heap for sharing GDI and User objects with user mode. If a heap is built on top of a memory mapped file region, certain constraints apply with respect to the component that can call heap functions. First, the internal heap structures use pointers, and therefore do not allow remapping to different addresses in other processes. Second, the synchronization across multiple processes or between a kernel component and a user process is not supported by the heap functions. Also, in the case of a shared heap between user mode and kernel mode, the user-mode mapping should be read-only to prevent user-mode code from corrupting the heap’s internal structures, which would result in a system crash. The kernel-mode driver is also responsible for not putting any sensitive data in a shared heap to avoid leaking it to user mode.
Heap Manager Structure
As shown in Figure 10-7, the heap manager is structured in two layers: an optional front-end layer and the core heap. The core heap handles the basic functionality and is mostly common across the user-mode and kernel-mode heap implementations. The core functionality includes the management of blocks inside segments, the management of the segments, policies for extending the heap, committing and decommitting memory, and management of the large blocks.
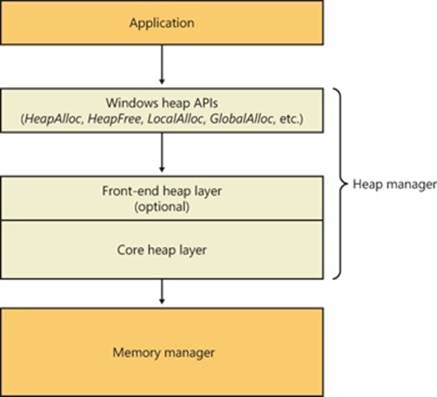
Figure 10-7. Heap manager layers
For user-mode heaps only, an optional front-end heap layer can exist on top of the existing core functionality. The only front-end supported on Windows is the Low Fragmentation Heap (LFH). Only one front-end layer can be used for one heap at one time.
Heap Synchronization
The heap manager supports concurrent access from multiple threads by default. However, if a process is single threaded or uses an external mechanism for synchronization, it can tell the heap manager to avoid the overhead of synchronization by specifying HEAP_NO_SERIALIZE either at heap creation or on a per-allocation basis.
A process can also lock the entire heap and prevent other threads from performing heap operations for operations that would require consistent states across multiple heap calls. For instance, enumerating the heap blocks in a heap with the Windows function HeapWalk requires locking the heap if multiple threads can perform heap operations simultaneously.
If heap synchronization is enabled, there is one lock per heap that protects all internal heap structures. In heavily multithreaded applications (especially when running on multiprocessor systems), the heap lock might become a significant contention point. In that case, performance might be improved by enabling the front-end heap, described in an upcoming section.
The Low Fragmentation Heap
Many applications running in Windows have relatively small heap memory usage (usually less than 1 MB). For this class of applications, the heap manager’s best-fit policy helps keep a low memory footprint for each process. However, this strategy does not scale for large processes and multiprocessor machines. In these cases, memory available for heap usage might be reduced as a result of heap fragmentation. Performance can suffer in scenarios where only certain sizes are often used concurrently from different threads scheduled to run on different processors. This happens because several processors need to modify the same memory location (for example, the head of the look-aside list for that particular size) at the same time, thus causing significant contention for the corresponding cache line.
The LFH avoids fragmentation by managing allocated blocks in predetermined different block-size ranges called buckets. When a process allocates memory from the heap, the LFH chooses the bucket that maps to the smallest block large enough to hold the required size. (The smallest block is 8 bytes.) The first bucket is used for allocations between 1 and 8 bytes, the second for allocations between 9 and 16 bytes, and so on, until the thirty-second bucket, which is used for allocations between 249 and 256 bytes, followed by the thirty-third bucket, which is used for allocations between 257 and 272 bytes, and so on. Finally, the one hundred twenty-eighth bucket, which is the last, is used for allocations between 15,873 and 16,384 bytes. (This is known as a binary buddy system.) Table 10-7 summarizes the different buckets, their granularity, and the range of sizes they map to.
Table 10-7. Buckets
|
Buckets |
Granularity |
Range |
|
1–32 |
8 |
1–256 |
|
33–48 |
16 |
257–512 |
|
49–64 |
32 |
513–1,024 |
|
65–80 |
64 |
1,025–2,048 |
|
81–96 |
128 |
2,049–4,096 |
|
97–112 |
256 |
4,097–8,194 |
|
113–128 |
512 |
8,195–16,384 |
The LFH addresses these issues by using the core heap manager and look-aside lists. The Windows heap manager implements an automatic tuning algorithm that can enable the LFH by default under certain conditions, such as lock contention or the presence of popular size allocations that have shown better performance with the LFH enabled. For large heaps, a significant percentage of allocations is frequently grouped in a relatively small number of buckets of certain sizes. The allocation strategy used by LFH is to optimize the usage for these patterns by efficiently handling same-size blocks.
To address scalability, the LFH expands the frequently accessed internal structures to a number of slots that is two times larger than the current number of processors on the machine. The assignment of threads to these slots is done by an LFH component called the affinity manager. Initially, the LFH starts using the first slot for heap allocations; however, if a contention is detected when accessing some internal data, the LFH switches the current thread to use a different slot. Further contentions will spread threads on more slots. These slots are controlled for each size bucket to improve locality and minimize the overall memory consumption.
Even if the LFH is enabled as a front-end heap, the less frequent allocation sizes may still continue to use the core heap functions to allocate memory, while the most popular allocation classes will be performed from the LFH. The LFH can also be disabled by using theHeapSetInformation API with the HeapCompatibilityInformation class.
Heap Security Features
As the heap manager has evolved, it has taken an increased role in early detection of heap usage errors and in mitigating effects of potential heap-based exploits. These measures exist to lessen the security effect of potential vulnerabilities in applications. The metadata used by the heap for internal management is packed with a high degree of randomization to make it difficult for an attempted exploit to patch the internal structures to prevent crashes or conceal the attack attempt. These blocks are also subject to an integrity check mechanism on the header to detect simple corruptions such as buffer overruns. Finally, the heap also uses a small degree of randomization of the base address (or handle). By using the HeapSetInformation API with the HeapEnableTerminationOnCorruption class, processes can opt in for an automatic termination in case of detected inconsistencies to avoid executing unknown code.
As an effect of block metadata randomization, using the debugger to simply dump a block header as an area of memory is not that useful. For example, the size of the block and whether it is busy or not are not easy to spot from a regular dump. The same applies to LFH blocks; they have a different type of metadata stored in the header, partially randomized as well. To dump these details, the !heap –i command in the debugger does all the work to retrieve the metadata fields from a block, flagging checksum or free list inconsistencies as well if they exist. The command works for both the LFH and regular heap blocks. The total size of the blocks, the user requested size, the segment owning the block, as well as the header partial checksum are available in the output, as shown in the following sample. Because the randomization algorithm uses the heap granularity, the !heap –i command should be used only in the proper context of the heap containing the block. In the example, the heap handle is 0x001a0000. If the current heap context was different, the decoding of the header would be incorrect. To set the proper context, the same !heap –i command with the heap handle as an argument needs to be executed first.
0:000> !heap -i 001a0000
Heap context set to the heap 0x001a0000
0:000> !heap -i 1e2570
Detailed information for block entry 001e2570
Assumed heap : 0x001a0000 (Use !heap -i NewHeapHandle to change)
Header content : 0x1570F4EC 0x0C0015BE (decoded : 0x07010006 0x0C00000D)
Owning segment : 0x001a0000 (offset 0)
Block flags : 0x1 (busy )
Total block size : 0x6 units (0x30 bytes)
Requested size : 0x24 bytes (unused 0xc bytes)
Previous block size: 0xd units (0x68 bytes)
Block CRC : OK - 0x7
Previous block : 0x001e2508
Next block : 0x001e25a0
Heap Debugging Features
The heap manager leverages the 8 bytes used to store internal metadata as a consistency checkpoint, which makes potential heap usage errors more obvious, and also includes several features to help detect bugs by using the following heap functions:
§ Enable tail checking The end of each block carries a signature that is checked when the block is released. If a buffer overrun destroyed the signature entirely or partially, the heap will report this error.
§ Enable free checking A free block is filled with a pattern that is checked at various points when the heap manager needs to access the block (such as at removal from the free list to satisfy an allocate request). If the process continued to write to the block after freeing it, the heap manager will detect changes in the pattern and the error will be reported.
§ Parameter checking This function consists of extensive checking of the parameters passed to the heap functions.
§ Heap validation The entire heap is validated at each heap call.
§ Heap tagging and stack traces support This function supports specifying tags for allocation and/or captures user-mode stack traces for the heap calls to help narrow the possible causes of a heap error.
The first three options are enabled by default if the loader detects that a process is started under the control of a debugger. (A debugger can override this behavior and turn off these features.) The heap debugging features can be specified for an executable image by setting various debugging flags in the image header using the Gflags tool. (See the section “Windows Global Flags” in Chapter 3 in Part 1.) Or, heap debugging options can be enabled using the !heap command in the standard Windows debuggers. (See the debugger help for more information.)
Enabling heap debugging options affects all heaps in the process. Also, if any of the heap debugging options are enabled, the LFH will be disabled automatically and the core heap will be used (with the required debugging options enabled). The LFH is also not used for heaps that are not expandable (because of the extra overhead added to the existing heap structures) or for heaps that do not allow serialization.
Pageheap
Because the tail and free checking options described in the preceding sections might be discovering corruptions that occurred well before the problem was detected, an additional heap debugging capability, called pageheap, is provided that directs all or part of the heap calls to a different heap manager. Pageheap is enabled using the Gflags tool (which is part of the Debugging Tools for Windows). When enabled, the heap manager places allocations at the end of pages and reserves the immediately following page. Since reserved pages are not accessible, if abuffer overrun occurs it will cause an access violation, making it easier to detect the offending code. Optionally, pageheap allows placing the blocks at the beginning of the pages, with the preceding page reserved, to detect buffer underrun problems. (This is a rare occurrence.) The pageheap also can protect freed pages against any access to detect references to heap blocks after they have been freed.
Note that using the pageheap can result in running out of address space because of the significant overhead added for small allocations. Also, performance can suffer as a result of the increase of references to demand zero pages, loss of locality, and additional overhead caused by frequent calls to validate heap structures. A process can reduce the impact by specifying that the pageheap be used only for blocks of certain sizes, address ranges, and/or originating DLLs.
For more information on pageheap, see the Debugging Tools for Windows Help file.
Fault Tolerant Heap
Corruption of heap metadata has been identified by Microsoft as one of the most common causes of application failures. Windows includes a feature called the fault tolerant heap, or FTH, in an attempt to mitigate these problems and to provide better problem-solving resources to application developers. The fault tolerant heap is implemented in two primary components: the detection component, or FTH server, and the mitigation component, or FTH client.
The detection component is a DLL, Fthsvc.dll, that is loaded by the Windows Security Center service (Wscsvc.dll, which in turn runs in one of the shared service processes under the local service account). It is notified of application crashes by the Windows Error Reporting service.
When an application crashes in Ntdll.dll, with an error status indicating either an access violation or a heap corruption exception, if it is not already on the FTH service’s list of “watched” applications, the service creates a “ticket” for the application to hold the FTH data. If the application subsequently crashes more than four times in an hour, the FTH service configures the application to use the FTH client in the future.
The FTH client is an application compatibility shim. This mechanism has been used since Windows XP to allow applications that depend on particular behavior of older Windows systems to run on later systems. In this case, the shim mechanism intercepts the calls to the heap routines and redirects them to its own code. The FTH code implements a number of “mitigations” that attempt to allow the application to survive despite various heap-related errors.
For example, to protect against small buffer overrun errors, the FTH adds 8 bytes of padding and an FTH reserved area to each allocation. To address a common scenario in which a block of heap is accessed after it is freed, HeapFree calls are implemented only after a delay: “freed” blocks are put on a list, and only freed when the total size of the blocks on the list exceeds 4 MB. Attempts to free regions that are not actually part of the heap, or not part of the heap identified by the heap handle argument to HeapFree, are simply ignored. In addition, no blocks are actually freed once exit or RtlExitUserProcess has been called.
The FTH server continues to monitor the failure rate of the application after the mitigations have been installed. If the failure rate does not improve, the mitigations are removed.
The activity of the fault tolerant heap can be observed in the Event Viewer. Type eventvwr.msc at a Run prompt, and then navigate in the left pane to Event Viewer, Applications And Services Logs, Microsoft, Windows, Fault-Tolerant-Heap. Click on the Operational log. It may be disabled completely in the registry: in the key HKLM\Software\Microsoft\FTH, set the value Enabled to 0.
The FTH does not normally operate on services, only applications, and it is disabled on Windows server systems for performance reasons. A system administrator can manually apply the shim to an application or service executable by using the Application Compatibility Toolkit.
Virtual Address Space Layouts
This section describes the components in the user and system address space, followed by the specific layouts on 32-bit and 64-bit systems. This information helps you to understand the limits on process and system virtual memory on both platforms.
Three main types of data are mapped into the virtual address space in Windows: per-process private code and data, sessionwide code and data, and systemwide code and data.
As explained in Chapter 1 in Part 1, each process has a private address space that cannot be accessed by other processes. That is, a virtual address is always evaluated in the context of the current process and cannot refer to an address defined by any other process. Threads within the process can therefore never access virtual addresses outside this private address space. Even shared memory is not an exception to this rule, because shared memory regions are mapped into each participating process, and so are accessed by each process using per-process addresses. Similarly, the cross-process memory functions (ReadProcessMemory and WriteProcessMemory) operate by running kernel-mode code in the context of the target process.
The information that describes the process virtual address space, called page tables, is described in the section on address translation. Each process has its own set of page tables. They are stored in kernel-mode-only accessible pages so that user-mode threads in a process cannot modify their own address space layout.
Session space contains information that is common to each session. (For a description of sessions, see Chapter 2 in Part 1.) A session consists of the processes and other system objects (such as the window station, desktops, and windows) that represent a single user’s logon session. Each session has a session-specific paged pool area used by the kernel-mode portion of the Windows subsystem (Win32k.sys) to allocate session-private GUI data structures. In addition, each session has its own copy of the Windows subsystem process (Csrss.exe) and logon process (Winlogon.exe). The session manager process (Smss.exe) is responsible for creating new sessions, which includes loading a session-private copy of Win32k.sys, creating the session-private object manager namespace, and creating the session-specific instances of the Csrss and Winlogon processes. To virtualize sessions, all sessionwide data structures are mapped into a region of system space called session space. When a process is created, this range of addresses is mapped to the pages associated with the session that the process belongs to.
Finally, system space contains global operating system code and data structures visible by kernel-mode code regardless of which process is currently executing. System space consists of the following components:
§ System code Contains the operating system image, HAL, and device drivers used to boot the system.
§ Nonpaged pool Nonpageable system memory heap.
§ Paged pool Pageable system memory heap.
§ System cache Virtual address space used to map files open in the system cache. (See Chapter 11 for detailed information.)
§ System page table entries (PTEs) Pool of system PTEs used to map system pages such as I/O space, kernel stacks, and memory descriptor lists. You can see how many system PTEs are available by examining the value of the Memory: Free System Page Table Entries counter in Performance Monitor.
§ System working set lists The working set list data structures that describe the three system working sets (the system cache working set, the paged pool working set, and the system PTEs working set).
§ System mapped views Used to map Win32k.sys, the loadable kernel-mode part of the Windows subsystem, as well as kernel-mode graphics drivers it uses. (See Chapter 2 in Part 1 for more information on Win32k.sys.)
§ Hyperspace A special region used to map the process working set list and other per-process data that doesn’t need to be accessible in arbitrary process context. Hyperspace is also used to temporarily map physical pages into the system space. One example of this is invalidating page table entries in page tables of processes other than the current one (such as when a page is removed from the standby list).
§ Crash dump information Reserved to record information about the state of a system crash.
§ HAL usage System memory reserved for HAL-specific structures.
Now that we’ve described the basic components of the virtual address space in Windows, let’s examine the specific layout on the x86, IA64, and x64 platforms.
x86 Address Space Layouts
By default, each user process on 32-bit versions of Windows has a 2-GB private address space; the operating system takes the remaining 2 GB. However, the system can be configured with the increase-userva BCD boot option to permit user address spaces up to 3 GB. Two possible address space layouts are shown in Figure 10-8.
The ability for a 32-bit process to grow beyond 2 GB was added to accommodate the need for 32-bit applications to keep more data in memory than could be done with a 2-GB address space. Of course, 64-bit systems provide a much larger address space.
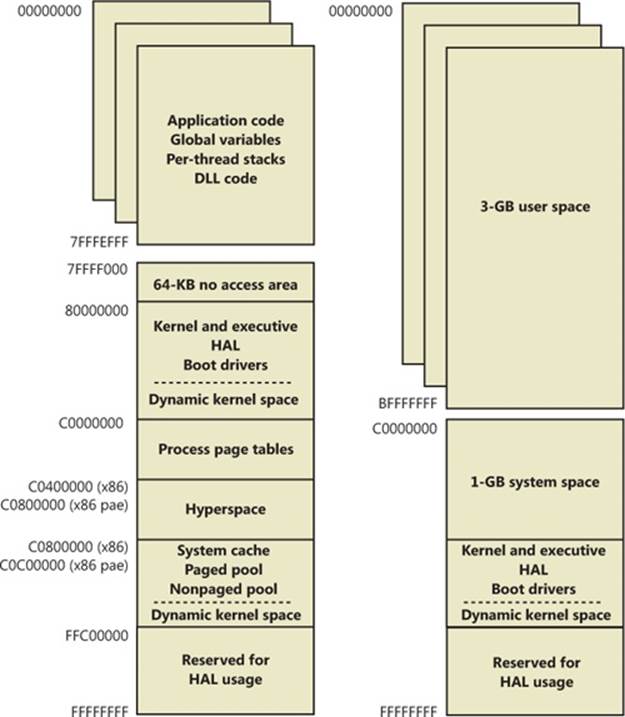
Figure 10-8. x86 virtual address space layouts
For a process to grow beyond 2 GB of address space, the image file must have the IMAGE_FILE_LARGE_ADDRESS_AWARE flag set in the image header. Otherwise, Windows reserves the additional address space for that process so that the application won’t see virtual addresses greater than 0x7FFFFFFF. Access to the additional virtual memory is opt-in because some applications have assumed that they’d be given at most 2 GB of the address space. Since the high bit of a pointer referencing an address below 2 GB is always zero, these applications would use the high bit in their pointers as a flag for their own data, clearing it, of course, before referencing the data. If they ran with a 3-GB address space, they would inadvertently truncate pointers that have values greater than 2 GB, causing program errors, including possible data corruption. You set this flag by specifying the linker flag /LARGEADDRESSAWARE when building the executable. This flag has no effect when running the application on a system with a 2-GB user address space.
Several system images are marked as large address space aware so that they can take advantage of systems running with large process address spaces. These include:
§ Lsass.exe The Local Security Authority Subsystem
§ Inetinfo.exe Internet Information Server
§ Chkdsk.exe The Check Disk utility
§ Smss.exe The Session Manager
§ Dllhst3g.exe A special version of Dllhost.exe (for COM+ applications)
§ Dispdiag.exe The display diagnostic dump utility
§ Esentutl.exe The Active Directory Database Utility tool
EXPERIMENT: CHECKING IF AN APPLICATION IS LARGE ADDRESS AWARE
You can use the Dumpbin utility from the Windows SDK to check other executables to see if they support large address spaces. Use the /HEADERS flag to display the results. Here’s a sample output of Dumpbin on the Session Manager:
C:\Program Files\Microsoft SDKs\Windows\v7.1>dumpbin /headers c:\windows\system32\smss.exe
Microsoft (R) COFF/PE Dumper Version 10.00.40219.01
Copyright (C) Microsoft Corporation. All rights reserved.
Dump of file c:\windows\system32\smss.exe
PE signature found
File Type: EXECUTABLE IMAGE
FILE HEADER VALUES
8664 machine (x64)
5 number of sections
4A5BC116 time date stamp Mon Jul 13 16:19:50 2009
0 file pointer to symbol table
0 number of symbols
F0 size of optional header
22 characteristics
Executable
Application can handle large (>2GB) addresses
Finally, because memory allocations using VirtualAlloc, VirtualAllocEx, and VirtualAllocExNuma start with low virtual addresses and grow higher by default, unless a process allocates a lot of virtual memory or it has a very fragmented virtual address space, it will never get back veryhigh virtual addresses. Therefore, for testing purposes, you can force memory allocations to start from high addresses by using the MEM_TOP_DOWN flag or by adding a DWORD registry value, HKLM\SYSTEM\CurrentControlSet\Control\Session Manager\Memory Management\AllocationPreference, and setting it to 0x100000.
Figure 10-9 shows two screen shots of the TestLimit utility (shown in previous experiments) leaking memory on a 32-bit Windows machine booted with and without the increaseuserva option set to 3 GB.
Note that in the second screen shot, TestLimit was able to leak almost 3 GB, as expected. This is only possible because TestLimit was linked with /LARGEADDRESSAWARE. Had it not been, the results would have been essentially the same as on the system booted withoutincreaseuserva.
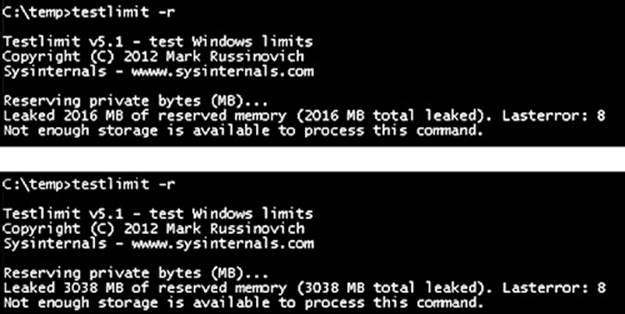
Figure 10-9. TestLimit leaking memory on a 32-bit Windows computer, with and without increaseuserva set to 3 GB
x86 System Address Space Layout
The 32-bit versions of Windows implement a dynamic system address space layout by using a virtual address allocator (we’ll describe this functionality later in this section). There are still a few specifically reserved areas, as shown in Figure 10-8. However, many kernel-mode structures use dynamic address space allocation. These structures are therefore not necessarily virtually contiguous with themselves. Each can easily exist in several disjointed pieces in various areas of system address space. The uses of system address space that are allocated in this way include:
§ Nonpaged pool
§ Special pool
§ Paged pool
§ System page table entries (PTEs)
§ System mapped views
§ File system cache
§ File system structures (metadata)
§ Session space
x86 Session Space
For systems with multiple sessions, the code and data unique to each session are mapped into system address space but shared by the processes in that session. Figure 10-10 shows the general layout of session space.
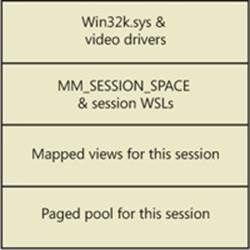
Figure 10-10. x86 session space layout (not proportional)
The sizes of the components of session space, just like the rest of kernel system address space, are dynamically configured and resized by the memory manager on demand.
EXPERIMENT: VIEWING SESSIONS
You can display which processes are members of which sessions by examining the session ID. This can be viewed with Task Manager, Process Explorer, or the kernel debugger. Using the kernel debugger, you can list the active sessions with the !session command as follows:
lkd> !session
Sessions on machine: 3
Valid Sessions: 0 1 3
Current Session 1
Then you can set the active session using the !session –s command and display the address of the session data structures and the processes in that session with the !sprocess command:
lkd> !session -s 3
Sessions on machine: 3
Implicit process is now 84173500
Using session 3
lkd> !sprocess
Dumping Session 3
_MM_SESSION_SPACE 9a83c000
_MMSESSION 9a83cd00
PROCESS 84173500 SessionId: 3 Cid: 0d78 Peb: 7ffde000 ParentCid: 0e80
DirBase: 3ef53500 ObjectTable: 8588d820 HandleCount: 76.
Image: csrss.exe
PROCESS 841a6030 SessionId: 3 Cid: 0c6c Peb: 7ffdc000 ParentCid: 0e80
DirBase: 3ef53520 ObjectTable: 85897208 HandleCount: 94.
Image: winlogon.exe
PROCESS 841d9cf0 SessionId: 3 Cid: 0d38 Peb: 7ffd6000 ParentCid: 0c6c
DirBase: 3ef53540 ObjectTable: 8589d248 HandleCount: 165.
Image: LogonUI.exe
...
To view the details of the session, dump the MM_SESSION_SPACE structure using the dt command, as follows:
lkd> dt nt!_MM_SESSION_SPACE 9a83c000
+0x000 ReferenceCount : 0n3
+0x004 u : <unnamed-tag>
+0x008 SessionId : 3
+0x00c ProcessReferenceToSession : 0n4
+0x010 ProcessList : _LIST_ENTRY [ 0x841735e4 - 0x841d9dd4 ]
+0x018 LastProcessSwappedOutTime : _LARGE_INTEGER 0x0
+0x020 SessionPageDirectoryIndex : 0x31fa3
+0x024 NonPagablePages : 0x19
+0x028 CommittedPages : 0x867
+0x02c PagedPoolStart : 0x80000000 Void
+0x030 PagedPoolEnd : 0xffbfffff Void
+0x034 SessionObject : 0x854e2040 Void
+0x038 SessionObjectHandle : 0x8000020c Void
+0x03c ResidentProcessCount : 0n3
+0x040 SessionPoolAllocationFailures : [4] 0
+0x050 ImageList : _LIST_ENTRY [ 0x8519bef8 - 0x85296370 ]
+0x058 LocaleId : 0x409
+0x05c AttachCount : 0
+0x060 AttachGate : _KGATE
+0x070 WsListEntry : _LIST_ENTRY [ 0x82772408 - 0x97044070 ]
+0x080 Lookaside : [25] _GENERAL_LOOKASIDE
...
EXPERIMENT: VIEWING SESSION SPACE UTILIZATION
You can view session space memory utilization with the !vm 4 command in the kernel debugger. For example, the following output was taken from a 32-bit Windows client system with the default two sessions created at system startup:
lkd> !vm 4
.
.
Terminal Server Memory Usage By Session:
Session ID 0 @ 9a8c7000:
Paged Pool Usage: 2372K
Commit Usage: 4832K
Session ID 1 @ 9a881000:
Paged Pool Usage: 14120K
Commit Usage: 16704K
System Page Table Entries
System page table entries (PTEs) are used to dynamically map system pages such as I/O space, kernel stacks, and the mapping for memory descriptor lists. System PTEs aren’t an infinite resource. On 32-bit Windows, the number of available system PTEs is such that the system can theoretically describe 2 GB of contiguous system virtual address space. On 64-bit Windows, system PTEs can describe up to 128 GB of contiguous virtual address space.
EXPERIMENT: VIEWING SYSTEM PTE INFORMATION
You can see how many system PTEs are available by examining the value of the Memory: Free System Page Table Entries counter in Performance Monitor or by using the !sysptes or !vm command in the debugger. You can also dump the _MI_SYSTEM_PTE_TYPE structure associated with the MiSystemPteInfo global variable. This will also show you how many PTE allocation failures occurred on the system—a high count indicates a problem and possibly a system PTE leak.
0: kd> !sysptes
System PTE Information
Total System Ptes 307168
starting PTE: c0200000
free blocks: 32 total free: 3856 largest free block: 542
Kernel Stack PTE Information
Unable to get syspte index array - skipping bins
starting PTE: c0200000
free blocks: 165 total free: 1503 largest free block: 75
0: kd> ? nt!MiSystemPteInfo
Evaluate expression: -2100014016 = 82d45440
0: kd> dt _MI_SYSTEM_PTE_TYPE 82d45440
nt!_MI_SYSTEM_PTE_TYPE
+0x000 Bitmap : _RTL_BITMAP
+0x008 Flags : 3
+0x00c Hint : 0x2271f
+0x010 BasePte : 0xc0200000 _MMPTE
+0x014 FailureCount : 0x82d45468 -> 0
+0x018 Vm : 0x82d67300 _MMSUPPORT
+0x01c TotalSystemPtes : 0n7136
+0x020 TotalFreeSystemPtes : 0n4113
+0x024 CachedPteCount : 0n0
+0x028 PteFailures : 0
+0x02c SpinLock : 0
+0x02c GlobalMutex : (null)
If you are seeing lots of system PTE failures, you can enable system PTE tracking by creating a new DWORD value in the HKLM\SYSTEM\CurrentControlSet\Control\Session Manager\Memory Management key called TrackPtes and setting its value to 1. You can then use !sysptes 4 to show a list of allocators, as shown here:
lkd>!sysptes 4
0x1ca2 System PTEs allocated to mapping locked pages
VA MDL PageCount Caller/CallersCaller
ecbfdee8 f0ed0958 2 netbt!DispatchIoctls+0x56a/netbt!NbtDispatchDevCtrl+0xcd
f0a8d050 f0ed0510 1 netbt!DispatchIoctls+0x64e/netbt!NbtDispatchDevCtrl+0xcd
ecef5000 1 20 nt!MiFindContiguousMemory+0x63
ed447000 0 2 Ntfs!NtfsInitializeVcb+0x30e/Ntfs!NtfsInitializeDevice+0x95
ee1ce000 0 2 Ntfs!NtfsInitializeVcb+0x30e/Ntfs!NtfsInitializeDevice+0x95
ed9c4000 1 ca nt!MiFindContiguousMemory+0x63
eda8e000 1 ca nt!MiFindContiguousMemory+0x63
efb23d68 f8067888 2 mrxsmb!BowserMapUsersBuffer+0x28
efac5af4 f8b15b98 2 ndisuio!NdisuioRead+0x54/nt!NtReadFile+0x566
f0ac688c f848ff88 1 ndisuio!NdisuioRead+0x54/nt!NtReadFile+0x566
efac7b7c f82fc2a8 2 ndisuio!NdisuioRead+0x54/nt!NtReadFile+0x566
ee4d1000 1 38 nt!MiFindContiguousMemory+0x63
efa4f000 0 2 Ntfs!NtfsInitializeVcb+0x30e/Ntfs!NtfsInitializeDevice+0x95
efa53000 0 2 Ntfs!NtfsInitializeVcb+0x30e/Ntfs!NtfsInitializeDevice+0x95
eea89000 0 1 TDI!DllInitialize+0x4f/nt!MiResolveImageReferences+0x4bc
ee798000 1 20 VIDEOPRT!pVideoPortGetDeviceBase+0x1f1
f0676000 1 10 hal!HalpGrowMapBuffers+0x134/hal!HalpAllocateAdapterEx+0x1ff
f0b75000 1 1 cpqasm2+0x2af67/cpqasm2+0x7847
f0afa000 1 1 cpqasm2+0x2af67/cpqasm2+0x6d82
64-Bit Address Space Layouts
The theoretical 64-bit virtual address space is 16 exabytes (18,446,744,073,709,551,616 bytes, or approximately 18.44 billion billion bytes). Unlike on x86 systems, where the default address space is divided in two parts (half for a process and half for the system), the 64-bit address is divided into a number of different size regions whose components match conceptually the portions of user, system, and session space. The various sizes of these regions, listed in Table 10-8, represent current implementation limits that could easily be extended in future releases. Clearly, 64 bits provides a tremendous leap in terms of address space sizes.
Table 10-8. 64-Bit Address Space Sizes
|
Region |
IA64 |
x64 |
|
Process Address Space |
7,152 GB |
8,192 GB |
|
System PTE Space |
128 GB |
128 GB |
|
System Cache |
1 TB |
1 TB |
|
Paged Pool |
128 GB |
128 GB |
|
Nonpaged Pool |
75% of physical memory |
75% of physical memory |
Also, on 64-bit Windows, another useful feature of having an image that is large address space aware is that while running on 64-bit Windows (under Wow64), such an image will actually receive all 4 GB of user address space available—after all, if the image can support 3-GB pointers, 4-GB pointers should not be any different, because unlike the switch from 2 GB to 3 GB, there are no additional bits involved. Figure 10-11 shows TestLimit, running as a 32-bit application, reserving address space on a 64-bit Windows machine, followed by the 64-bit version of TestLimit leaking memory on the same machine.
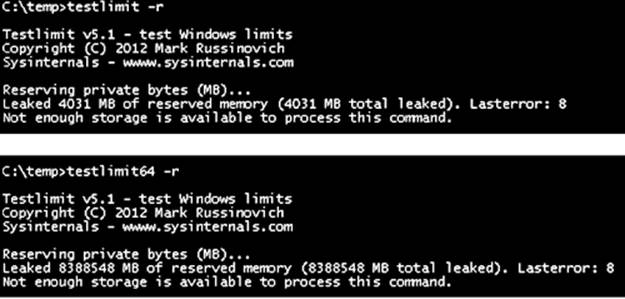
Figure 10-11. 32-bit and 64-bit TestLimit reserving address space on a 64-bit Windows computer
Note that these results depend on the two versions of TestLimit having been linked with the /LARGEADDRESSAWARE option. Had they not been, the results would have been about 2 GB for each. 64-bit applications linked without /LARGEADDRESSAWARE are constrained to the first 2 GB of the process virtual address space, just like 32-bit applications.
The detailed IA64 and x64 address space layouts vary slightly. The IA64 address space layout is shown in Figure 10-12, and the x64 address space layout is shown in Figure 10-13.
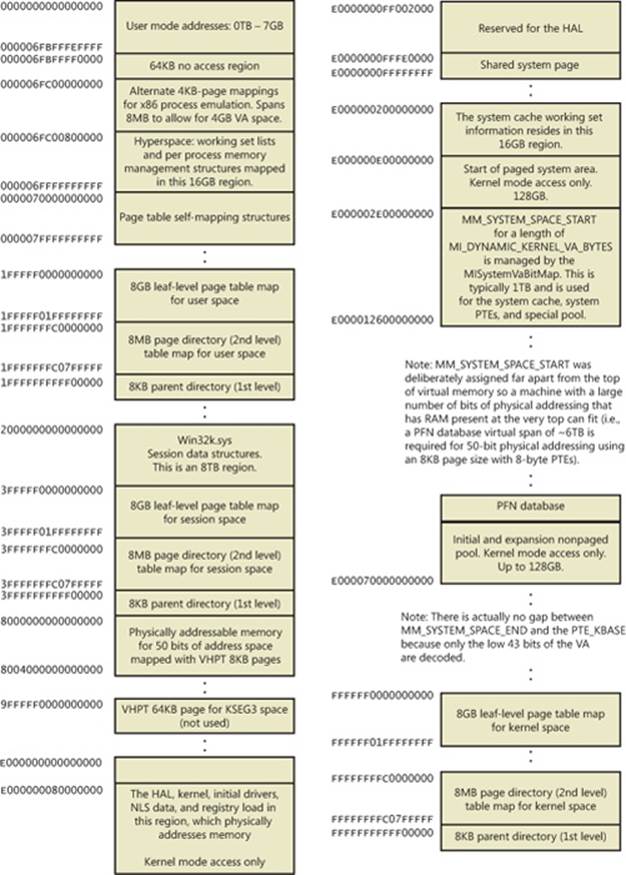
Figure 10-12. IA64 address space layout
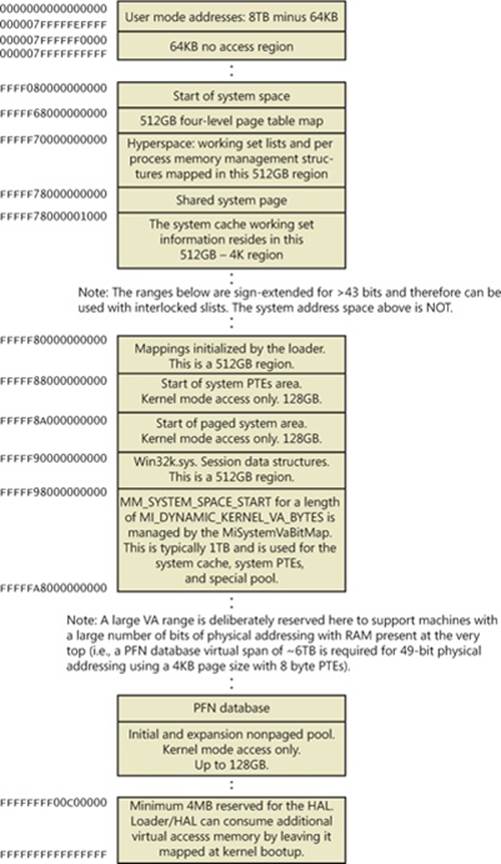
Figure 10-13. x64 address space layout
x64 Virtual Addressing Limitations
As discussed previously, 64 bits of virtual address space allow for a possible maximum of 16 exabytes (EB) of virtual memory, a notable improvement over the 4 GB offered by 32-bit addressing. With such a copious amount of memory, it is obvious that today’s computers, as well as tomorrow’s foreseeable machines, are not even close to requiring support for that much memory.
Accordingly, to simplify chip architecture and avoid unnecessary overhead, particularly in address translation (to be described later), AMD’s and Intel’s current x64 processors implement only 256 TB of virtual address space. That is, only the low-order 48 bits of a 64-bit virtual address are implemented. However, virtual addresses are still 64 bits wide, occupying 8 bytes in registers or when stored in memory. The high-order 16 bits (bits 48 through 63) must be set to the same value as the highest order implemented bit (bit 47), in a manner similar to sign extension in two’s complement arithmetic. An address that conforms to this rule is said to be a “canonical” address.
Under these rules, the bottom half of the address space thus starts at 0x0000000000000000, as expected, but it ends at 0x00007FFFFFFFFFFF. The top half of the address space starts at 0xFFFF800000000000 and ends at 0xFFFFFFFFFFFFFFFF. Each “canonical” portion is 128 TB. As newer processors implement more of the address bits, the lower half of memory will expand upward, toward 0x7FFFFFFFFFFFFFFF, while the upper half of memory will expand downward, toward 0x8000000000000000 (a similar split to today’s memory space but with 32 more bits).
Windows x64 16-TB Limitation
Windows on x64 has a further limitation: of the 256 TB of virtual address space available on x64 processors, Windows at present allows only the use of a little more than 16 TB. This is split into two 8-TB regions, the user mode, per-process region starting at 0 and working toward higher addresses (ending at 0x000007FFFFFFFFFF), and a kernel-mode, systemwide region starting at “all Fs” and working toward lower addresses, ending at 0xFFFFF80000000000 for most purposes. This section describes the origin of this 16-TB limit.
A number of Windows mechanisms have made, and continue to make, assumptions about usable bits in addresses. Pushlocks, fast references, Patchguard DPC contexts, and singly linked lists are common examples of data structures that use bits within a pointer for nonaddressing purposes. Singly linked lists, combined with the lack of a CPU instruction in the original x64 CPUs required to “port” the data structure to 64-bit Windows, are responsible for this memory addressing limit on Windows for x64.
Here is the SLIST_HEADER, the data structure Windows uses to represent an entry inside a list:
typedef union _SLIST_HEADER {
ULONGLONG Alignment;
struct {
SLIST_ENTRY Next;
USHORT Depth;
USHORT Sequence;
} DUMMYSTRUCTNAME;
} SLIST_HEADER, *PSLIST_HEADER;
Note that this is an 8-byte structure, guaranteed to be aligned as such, composed of three elements: the pointer to the next entry (32 bits, or 4 bytes) and depth and sequence numbers, each 16 bits (or 2 bytes). To create lock-free push and pop operations, the implementation makes use of an instruction present on Pentium processors or higher—CMPXCHG8B (Compare and Exchange 8 bytes), which allows the atomic modification of 8 bytes of data. By using this native CPU instruction, which also supports the LOCK prefix (guaranteeing atomicity on a multiprocessor system), the need for a spinlock to combine two 32-bit accesses is eliminated, and all operations on the list become lock free (increasing speed and scalability).
On 64-bit computers, addresses are 64 bits, so the pointer to the next entry should logically be 64 bits. If the depth and sequence numbers remain within the same parameters, the system must provide a way to modify at minimum 64+32 bits of data—or better yet, 128 bits, in order to increase the entropy of the depth and sequence numbers. However, the first x64 processors did not implement the essential CMPXCHG16B instruction to allow this. The implementation, therefore, was written to pack as much information as possible into only 64 bits, which was the most that could be modified atomically at once. The 64-bit SLIST_HEADER thus looks like this:
struct { // 8-byte header
ULONGLONG Depth:16;
ULONGLONG Sequence:9;
ULONGLONG NextEntry:39;
} Header8;
The first change is the reduction of the space for the sequence number to 9 bits instead of 16 bits, reducing the maximum sequence number the list can achieve. This leaves only 39 bits for the pointer, still far from 64 bits. However, by forcing the structure to be 16-byte aligned when allocated, 4 more bits can be used because the bottom bits can now always be assumed to be 0. This gives 43 bits for addresses, but there is one more assumption that can be made. Because the implementation of linked lists is used either in kernel mode or user mode but cannot be used across address spaces, the top bit can be ignored, just as on 32-bit machines. The code will assume the address to be kernel mode if called in kernel mode and vice versa. This allows us to address up to 44 bits of memory in the NextEntry pointer and is the defining constraint of the addressing limit in Windows.
Forty-four bits is a much better number than 32. It allows 16 TB of virtual memory to be described and thus splits Windows into two even chunks of 8 TB for user-mode and kernel-mode memory. Nevertheless, this is still 16 times smaller than the CPU’s own limit (48 bits is 256 TB), and even farther still from the maximum that 64 bits can describe. So, with scalability in mind, some other bits do exist in the SLIST_HEADER that define the type of header being dealt with. This means that when the day comes when all x64 CPUs support 128-bit Compare and Exchange, Windows can easily take advantage of it (and to do so before then would mean distributing two different kernel images). Here’s a look at the full 8-byte header:
struct { // 8-byte header
ULONGLONG Depth:16;
ULONGLONG Sequence:9;
ULONGLONG NextEntry:39;
ULONGLONG HeaderType:1; // 0: 8-byte; 1: 16-byte
ULONGLONG Init:1; // 0: uninitialized; 1: initialized
ULONGLONG Reserved:59;
ULONGLONG Region:3;
} Header8;
Note how the HeaderType bit is overlaid with the Depth bits and allows the implementation to deal with 16-byte headers whenever support becomes available. For the sake of completeness, here is the definition of the 16-byte header:
struct { // 16-byte header
ULONGLONG Depth:16;
ULONGLONG Sequence:48;
ULONGLONG HeaderType:1; // 0: 8-byte; 1: 16-byte
ULONGLONG Init:1; // 0: uninitialized; 1: initialized
ULONGLONG Reserved:2;
ULONGLONG NextEntry:60; // last 4 bits are always 0's
} Header16;
Notice how the NextEntry pointer has now become 60 bits, and because the structure is still 16-byte aligned, with the 4 free bits, leads to the full 64 bits being addressable.
Conversely, kernel-mode data structures that do not involve SLISTs are not limited to the 8-TB address space range. System page table entries, hyperspace, and the cache working set all occupy virtual addresses below 0xFFFFF80000000000 because these structures do not use SLISTs.
Dynamic System Virtual Address Space Management
Thirty-two-bit versions of Windows manage the system address space through an internal kernel virtual allocator mechanism that we’ll describe in this section. Currently, 64-bit versions of Windows have no need to use the allocator for virtual address space management (and thus bypass the cost), because each region is statically defined as shown in Table 10-8 earlier.
When the system initializes, the MiInitializeDynamicVa function sets up the basic dynamic ranges (the ranges currently supported are described in Table 10-9) and sets the available virtual address to all available kernel space. It then initializes the address space ranges for boot loader images, process space (hyperspace), and the HAL through the MiIntializeSystemVaRange function, which is used to set hard-coded address ranges. Later, when nonpaged pool is initialized, this function is used again to reserve the virtual address ranges for it. Finally, whenever a driver loads, the address range is relabeled to a driver image range (instead of a boot loaded range).
After this point, the rest of the system virtual address space can be dynamically requested and released through MiObtainSystemVa (and its analogous MiObtainSessionVa) and MiReturnSystemVa. Operations such as expanding the system cache, the system PTEs, nonpaged pool, paged pool, and/or special pool; mapping memory with large pages; creating the PFN database; and creating a new session all result in dynamic virtual address allocations for a specific range. Each time the kernel virtual address space allocator obtains virtual memory ranges for use by a certain type of virtual address, it updates the MiSystemVaType array, which contains the virtual address type for the newly allocated range. The values that can appear in MiSystemVaType are shown in Table 10-9.
Table 10-9. System Virtual Address Types
|
Region |
Description |
Limitable |
|
MiVaSessionSpace (0x1) |
Addresses for session space |
Yes |
|
MiVaProcessSpace (0x2) |
Addresses for process address space |
No |
|
MiVaBootLoaded (0x3) |
Addresses for images loaded by the boot loader |
No |
|
MiVaPfnDatabase (0x4) |
Addresses for the PFN database |
No |
|
MiVaNonPagedPool (0x5) |
Addresses for the nonpaged pool |
Yes |
|
MiVaPagedPool (0x6) |
Addresses for the paged pool |
Yes |
|
MiVaSpecialPool (0x7) |
Addresses for the special pool |
No |
|
MiVaSystemCache (0x8) |
Addresses for the system cache |
Yes |
|
MiVaSystemPtes (0x9) |
Addresses for system PTEs |
Yes |
|
MiVaHal (0xA) |
Addresses for the HAL |
No |
|
MiVaSessionGlobalSpace (0xB) |
Addresses for session global space |
No |
|
MiVaDriverImages (0xC) |
Addresses for loaded driver images |
No |
Although the ability to dynamically reserve virtual address space on demand allows better management of virtual memory, it would be useless without the ability to free this memory. As such, when paged pool or the system cache can be shrunk, or when special pool and large page mappings are freed, the associated virtual address is freed. (Another case is when the boot registry is released.) This allows dynamic management of memory depending on each component’s use. Additionally, components can reclaim memory through MiReclaimSystemVa, which requests virtual addresses associated with the system cache to be flushed out (through the dereference segment thread) if available virtual address space has dropped below 128 MB. (Reclaiming can also be satisfied if initial nonpaged pool has been freed.)
In addition to better proportioning and better management of virtual addresses dedicated to different kernel memory consumers, the dynamic virtual address allocator also has advantages when it comes to memory footprint reduction. Instead of having to manually preallocate static page table entries and page tables, paging-related structures are allocated on demand. On both 32-bit and 64-bit systems, this reduces boot-time memory usage because unused addresses won’t have their page tables allocated. It also means that on 64-bit systems, the large address spaceregions that are reserved don’t need to have their page tables mapped in memory, which allows them to have arbitrarily large limits, especially on systems that have little physical RAM to back the resulting paging structures.
EXPERIMENT: QUERYING SYSTEM VIRTUAL ADDRESS USAGE
You can look at the current usage and peak usage of each system virtual address type by using the kernel debugger. For each system virtual address type described in Table 10-9, the Mi-SystemVaTypeCount, MiSystemVaTypeCountFailures, and MiSystemVaTypeCountPeak arrays in the kernel contain the sizes, count failures, and peak sizes for each type. Here’s how you can dump the usage for the system, followed by the peak usage (you can use a similar technique for the failure counts):
lkd> dd /c 1 MiSystemVaTypeCount l c
81f4f880 00000000
81f4f884 00000028
81f4f888 00000008
81f4f88c 0000000c
81f4f890 0000000b
81f4f894 0000001a
81f4f898 0000002f
81f4f89c 00000000
81f4f8a0 000001b6
81f4f8a4 00000030
81f4f8a8 00000002
81f4f8ac 00000006
lkd> dd /c 1 MiSystemVaTypeCountPeak l c
81f4f840 00000000
81f4f844 00000038
81f4f848 00000000
81f4f84c 00000000
81f4f850 0000003d
81f4f854 0000001e
81f4f858 00000032
81f4f85c 00000000
81f4f860 00000238
81f4f864 00000031
81f4f868 00000000
81f4f86c 00000006
Theoretically, the different virtual address ranges assigned to components can grow arbitrarily in size as long as enough system virtual address space is available. In practice, on 32-bit systems, the kernel allocator implements the ability to set limits on each virtual address type for the purposes of both reliability and stability. (On 64-bit systems, kernel address space exhaustion is currently not a concern.) Although no limits are imposed by default, system administrators can use the registry to modify these limits for the virtual address types that are currently marked as limitable (see Table 10-9).
If the current request during the MiObtainSystemVa call exceeds the available limit, a failure is marked (see the previous experiment) and a reclaim operation is requested regardless of available memory. This should help alleviate memory load and might allow the virtual address allocation to work during the next attempt. (Recall, however, that reclaiming affects only system cache and nonpaged pool).
EXPERIMENT: SETTING SYSTEM VIRTUAL ADDRESS LIMITS
The MiSystemVaTypeCountLimit array contains limitations for system virtual address usage that can be set for each type. Currently, the memory manager allows only certain virtual address types to be limited, and it provides the ability to use an undocumented system call to set limits for the system dynamically during run time. (These limits can also be set through the registry, as described at http://msdn.microsoft.com/en-us/library/bb870880(VS.85).aspx.) These limits can be set for those types marked in Table 10-9.
You can use the MemLimit utility (http://www.winsiderss.com/tools/memlimit.html) from Winsider Seminars & Solutions to query and set the different limits for these types, and also to see the current and peak virtual address space usage. Here’s how you can query the current limits with the –q flag:
C:\ >memlimit.exe -q
MemLimit v1.00 - Query and set hard limits on system VA space consumption
Copyright (C) 2008 Alex Ionescu
www.alex-ionescu.com
System Va Consumption:
Type Current Peak Limit
Non Paged Pool 102400 KB 0 KB 0 KB
Paged Pool 59392 KB 83968 KB 0 KB
System Cache 534528 KB 536576 KB 0 KB
System PTEs 73728 KB 75776 KB 0 KB
Session Space 75776 KB 90112 KB 0 KB
As an experiment, use the following command to set a limit of 100 MB for paged pool:
memlimit.exe -p 100M
And now try running the testlimit –h experiment from Chapter 3 (in Part 1) again, which attempted to create 16 million handles. Instead of reaching the 16 million handle count, the process will fail, because the system will have run out of address space available for paged pool allocations.
System Virtual Address Space Quotas
The system virtual address space limits described in the previous section allow for limiting systemwide virtual address space usage of certain kernel components, but they work only on 32-bit systems when applied to the system as a whole. To address more specific quota requirements that system administrators might have, the memory manager also collaborates with the process manager to enforce either systemwide or user-specific quotas for each process.
The PagedPoolQuota, NonPagedPoolQuota, PagingFileQuota, and WorkingSetPagesQuota values in the HKLM\SYSTEM\CurrentControlSet\Control\Session Manager\Memory Management key can be configured to specify how much memory of each type a given process can use. This information is read at initialization, and the default system quota block is generated and then assigned to all system processes (user processes will get a copy of the default system quota block unless per-user quotas have been configured as explained next).
To enable per-user quotas, subkeys under the registry key HKLM\SYSTEM\CurrentControlSet\Session Manager\Quota System can be created, each one representing a given user SID. The values mentioned previously can then be created under this specific SID subkey, enforcing the limits only for the processes created by that user. Table 10-10 shows how to configure these values, which can be configured at run time or not, and which privileges are required.
Table 10-10. Process Quota Types
|
Value Name |
Description |
Value Type |
Dynamic |
Privilege |
|
PagedPoolQuota |
Maximum size of paged pool that can be allocated by this process |
Size in MB |
Only for processes running with the system token |
SeIncreaseQuotaPrivilege |
|
NonPagedPoolQuota |
Maximum size of nonpaged pool that can be allocated by this process |
Size in MB |
Only for processes running with the system token |
SeIncreaseQuotaPrivilege |
|
PagingFileQuota |
Maximum number of pages that a process can have backed by the page file |
Pages |
Only for processes running with the system token |
SeIncreaseQuotaPrivilege |
|
WorkingSetPagesQuota |
Maximum number of pages that a process can have in its working set (in physical memory) |
Pages |
Yes |
SeIncreaseBasePriorityPrivilege unless operation is a purge request |
User Address Space Layout
Just as address space in the kernel is dynamic, the user address space is also built dynamically—the addresses of the thread stacks, process heaps, and loaded images (such as DLLs and an application’s executable) are dynamically computed (if the application and its images support it) through a mechanism known as Address Space Layout Randomization, or ASLR.
At the operating system level, user address space is divided into a few well-defined regions of memory, shown in Figure 10-14. The executable and DLLs themselves are present as memory mapped image files, followed by the heap(s) of the process and the stack(s) of its thread(s). Apart from these regions (and some reserved system structures such as the TEBs and PEB), all other memory allocations are run-time dependent and generated. ASLR is involved with the location of all these run-time-dependent regions and, combined with DEP, provides a mechanism for making remote exploitation of a system through memory manipulation harder to achieve. Since Windows code and data are placed at dynamic locations, an attacker cannot typically hardcode a meaningful offset into either a program or a system-supplied DLL.
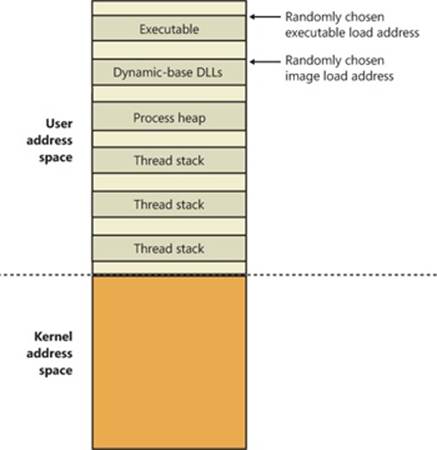
Figure 10-14. User address space layout with ASLR enabled
EXPERIMENT: ANALYZING USER VIRTUAL ADDRESS SPACE
The VMMap utility from Sysinternals can show you a detailed view of the virtual memory being utilized by any process on your machine, divided into categories for each type of allocation, summarized as follows:
§ Image Displays memory allocations used to map the executable and its dependencies (such as dynamic libraries) and any other memory mapped image (portable executable format) files
§ Private Displays memory allocations marked as private, such as internal data structures, other than the stack and heap
§ Shareable Displays memory allocations marked as shareable, typically including shared memory (but not memory mapped files, which are either Image or Mapped File)
§ Mapped File Displays memory allocations for memory mapped data files
§ Heap Displays memory allocated for the heap(s) that this process owns
§ Stack Displays memory allocated for the stack of each thread in this process
§ System Displays kernel memory allocated for the process (such as the process object)
The following screen shot shows a typical view of Explorer as seen through VMMap.
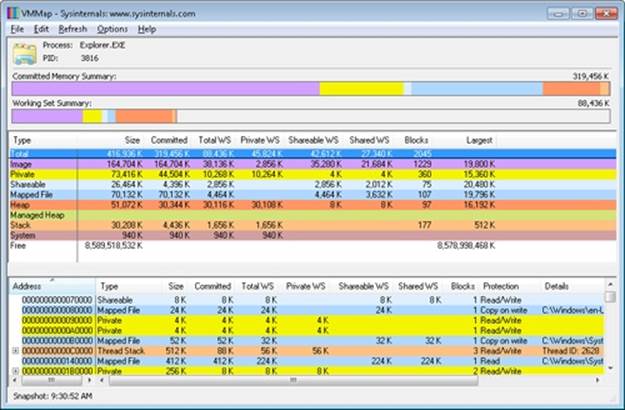
Depending on the type of memory allocation, VMMap can show additional information, such as file names (for mapped files), heap IDs (for heap allocations), and thread IDs (for stack allocations). Furthermore, each allocation’s cost is shown both in committed memory and working set memory. The size and protection of each allocation is also displayed.
ASLR begins at the image level, with the executable for the process and its dependent DLLs. Any image file that has specified ASLR support in its PE header (IMAGE_DLL_CHARACTERISTICS_DYNAMIC_BASE), typically specified by using the /DYNAMICBASE linker flag in Microsoft Visual Studio, and contains a relocation section will be processed by ASLR. When such an image is found, the system selects an image offset valid globally for the current boot. This offset is selected from a bucket of 256 values, all of which are 64-KB aligned.
Image Randomization
For executables, the load offset is calculated by computing a delta value each time an executable is loaded. This value is a pseudo-random 8-bit number from 0x10000 to 0xFE0000, calculated by taking the current processor’s time stamp counter (TSC), shifting it by four places, and then performing a division modulo 254 and adding 1. This number is then multiplied by the allocation granularity of 64 KB discussed earlier. By adding 1, the memory manager ensures that the value can never be 0, so executables will never load at the address in the PE header if ASLR is being used. This delta is then added to the executable’s preferred load address, creating one of 256 possible locations within 16 MB of the image address in the PE header.
For DLLs, computing the load offset begins with a per-boot, systemwide value called the image bias, which is computed by MiInitializeRelocations and stored in MiImageBias. This value corresponds to the time stamp counter (TSC) of the current CPU when this function was called during the boot cycle, shifted and masked into an 8-bit value, which provides 256 possible values. Unlike executables, this value is computed only once per boot and shared across the system to allow DLLs to remain shared in physical memory and relocated only once. If DLLs were remapped at different locations inside different processes, the code could not be shared. The loader would have to fix up address references differently for each process, thus turning what had been shareable read-only code into process-private data. Each process using a given DLL would have to have its own private copy of the DLL in physical memory.
Once the offset is computed, the memory manager initializes a bitmap called the MiImageBitMap. This bitmap is used to represent ranges from 0x50000000 to 0x78000000 (stored in MiImageBitMapHighVa), and each bit represents one unit of allocation (64 KB, as mentioned earlier). Whenever the memory manager loads a DLL, the appropriate bit is set to mark its location in the system; when the same DLL is loaded again, the memory manager shares its section object with the already relocated information.
As each DLL is loaded, the system scans the bitmap from top to bottom for free bits. The MiImageBias value computed earlier is used as a start index from the top to randomize the load across different boots as suggested. Because the bitmap will be entirely empty when the first DLL (which is always Ntdll.dll) is loaded, its load address can easily be calculated: 0x78000000 – MiImageBias * 0x10000. Each subsequent DLL will then load in a 64-KB chunk below. Because of this, if the address of Ntdll.dll is known, the addresses of other DLLs could easily be computed. To mitigate this possibility, the order in which known DLLs are mapped by the Session Manager during initialization is also randomized when Smss loads.
Finally, if no free space is available in the bitmap (which would mean that most of the region defined for ASLR is in use, the DLL relocation code defaults back to the executable case, loading the DLL at a 64-KB chunk within 16 MB of its preferred base address.
Stack Randomization
The next step in ASLR is to randomize the location of the initial thread’s stack (and, subsequently, of each new thread). This randomization is enabled unless the flag StackRandomizationDisabled was enabled for the process and consists of first selecting one of 32 possible stack locations separated by either 64 KB or 256 KB. This base address is selected by finding the first appropriate free memory region and then choosing the xth available region, where x is once again generated based on the current processor’s TSC shifted and masked into a 5-bit value (which allows for 32 possible locations).
Once this base address has been selected, a new TSC-derived value is calculated, this one 9 bits long. The value is then multiplied by 4 to maintain alignment, which means it can be as large as 2,048 bytes (half a page). It is added to the base address to obtain the final stack base.
Heap Randomization
Finally, ASLR randomizes the location of the initial process heap (and subsequent heaps) when created in user mode. The RtlCreateHeap function uses another pseudo-random, TSC-derived value to determine the base address of the heap. This value, 5 bits this time, is multiplied by 64 KB to generate the final base address, starting at 0, giving a possible range of 0x00000000 to 0x001F0000 for the initial heap. Additionally, the range before the heap base address is manually deallocated in an attempt to force an access violation if an attack is doing a brute-force sweep of the entire possible heap address range.
ASLR in Kernel Address Space
ASLR is also active in kernel address space. There are 64 possible load addresses for 32-bit drivers and 256 for 64-bit drivers. Relocating user-space images requires a significant amount of work area in kernel space, but if kernel space is tight, ASLR can use the user-mode address space of the System process for this work area.
Controlling Security Mitigations
As we’ve seen, ASLR and many of the other security mitigations in Windows are optional because of their potential compatibility effects: ASLR applies only to images with the IMAGE_DLL_CHARACTERISTICS_DYNAMIC_BASE bit in their image headers, hardware no-execute (data execution protection) can be controlled by a combination of boot options and linker options, and so on. To allow both enterprise customers and individual users more visibility and control of these features, Microsoft publishes the Enhanced Mitigation Experience Toolkit (EMET). EMET offers centralized control of the mitigations built into Windows and also adds several more mitigations not yet part of the Windows product. Additionally, EMET provides notification capabilities through the Event Log to let administrators know when certain software has experienced access faults because mitigations have been applied. Finally, EMET also enables manual opt-out for certain applications that might exhibit compatibility issues in certain environments, even though they were opted in by the developer.
EXPERIMENT: LOOKING AT ASLR PROTECTION ON PROCESSES
You can use Process Explorer from Sysinternals to look over your processes (and, just as important, the DLLs they load) to see if they support ASLR. Note that even if just one DLL loaded by a process does not support ASLR, it can make the process much more vulnerable to attacks.
To look at the ASLR status for processes, right-click on any column in the process tree, choose Select Columns, and then check ASLR Enabled on the Process Image tab. Notice that not all in-box Windows programs and services are running with ASLR enabled, and there is one visible example of a third-party application that does not have ASLR enabled either.
In the example, we have highlighted the Notepad.exe process. In this case, its load address is 0xFE0000. If you were to close all instances of Notepad and then start another, you would find it at a different load address. If you shut down and reboot the system and then try the experiment again, you would find that the ASLR-enabled DLLs are at different load addresses after each boot.
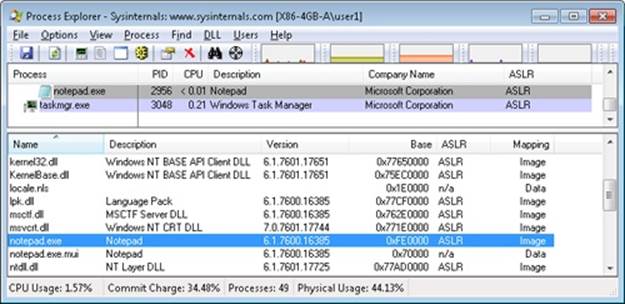
Address Translation
Now that you’ve seen how Windows structures the virtual address space, let’s look at how it maps these address spaces to real physical pages. User applications and system code reference virtual addresses. This section starts with a detailed description of 32-bit x86 address translation (in both non-PAE and PAE modes) and continues with a brief description of the differences on the 64-bit IA64 and x64 platforms. In the next section, we’ll describe what happens when such a translation doesn’t resolve to a physical memory address (paging) and explain how Windows manages physical memory via working sets and the page frame database.
x86 Virtual Address Translation
Using data structures the memory manager creates and maintains called page tables, the CPU translates virtual addresses into physical addresses. Each page of virtual address space is associated with a system-space structure called a page table entry (PTE), which contains the physical address to which the virtual one is mapped. For example, Figure 10-15 shows how three consecutive virtual pages might be mapped to three physically discontiguous pages on an x86 system. There may not even be any PTEs for regions that have been marked as reserved or committed but never accessed, because the page table itself might be allocated only when the first page fault occurs.
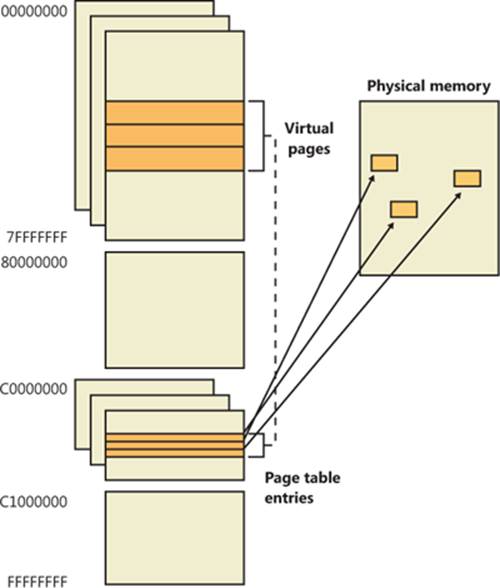
Figure 10-15. Mapping virtual addresses to physical memory (x86)
The dashed line connecting the virtual pages to the PTEs in Figure 10-15 represents the indirect relationship between virtual pages and physical memory.
NOTE
Even kernel-mode code (such as device drivers) cannot reference physical memory addresses directly, but it may do so indirectly by first creating virtual addresses mapped to them. For more information, see the memory descriptor list (MDL) support routines described in the WDK documentation.
As mentioned previously, Windows on x86 can use either of two schemes for address translation: non-PAE and PAE. We’ll discuss the non-PAE mode first and cover PAE in the next section. The PAE material does depend on the non-PAE material, so even if you are primarily interested in PAE, you should study this section first. The description of x64 address translation similarly builds on the PAE information.
Non-PAE x86 systems use a two-level page table structure to translate virtual to physical addresses. A 32-bit virtual address mapped by a normal 4-KB page is interpreted as two fields: the virtual page number and the byte within the page, called the byte offset. The virtual page number is further divided into two subfields, called the page directory index and the page table index, as illustrated in Figure 10-16. These two fields are used to locate entries in the page directory and in a page table.
The sizes of these bit fields are dictated by the structures they reference. For example, the byte offset is 12 bits because it denotes a byte within a page, and pages are 4,096 bytes (212 = 4,096). The other indexes are 10 bits because the structures they index have 1,024 entries (210 = 1,024).
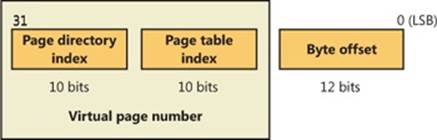
Figure 10-16. Components of a 32-bit virtual address on x86 systems
The job of virtual address translation is to convert these virtual addresses into physical addresses—that is, addresses of locations in RAM. The format of a physical address on an x86 non-PAE system is shown in Figure 10-17.
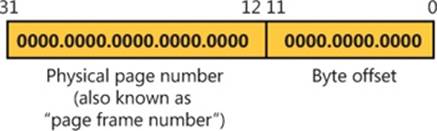
Figure 10-17. Components of a physical address on x86 non-PAE systems
As you can see, the format is very similar to that of a virtual address. Furthermore, the byte offset value from a virtual address will be the same in the resulting physical address. We can say, then, that address translation involves converting virtual page numbers to physical page numbers (also referred to as page frame numbers, or PFNs). The byte offset does not participate in, and does not change as a result of, address translation. It is simply copied from the virtual address to the physical address,
Figure 10-18 shows the relationship of these three values and how they are used to perform address translation.
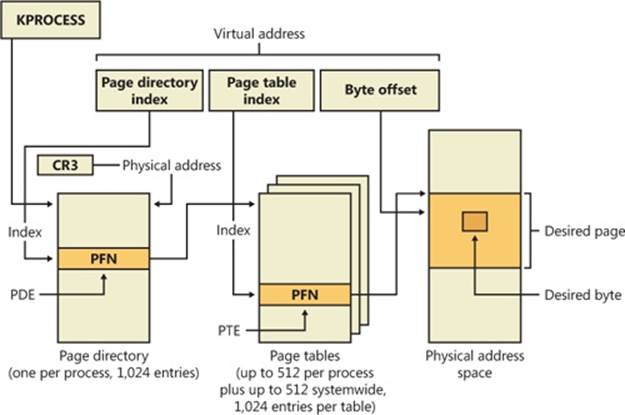
Figure 10-18. Translating a valid virtual address (x86 non-PAE)
The following basic steps are involved in translating a virtual address:
1. The memory management unit (MMU) uses a privileged CPU register, CR3, to obtain the physical address of the page directory.
2. The page directory index portion of the virtual address is used as an index into the page directory. This locates the page directory entry (PDE) that contains the location of the page table needed to map the virtual address. The PDE in turn contains the physical page number, also called the page frame number, or PFN, of the desired page table, provided the page table is resident—page tables can be paged out or not yet created, and in those cases, the page table is first made resident before proceeding. If a flag in the PDE indicates that it describes a large page, then it simply contains the PFN of the target large page, and the rest of the virtual address is treated as the byte offset within the large page.
3. The page table index is used as an index into the page table to locate the PTE that describes the virtual page in question.
4. If the PTE’s valid bit is clear, this triggers a page fault (memory management fault). The operating system’s memory management fault handler (pager) locates the page and tries to make it valid; after doing so, this sequence continues at step 5. (See the section Page Fault Handling) If the page cannot or should not be made valid (for example, because of a protection fault), the fault handler generates an access violation or a bug check.
5. When the PTE describes a valid page (whether immediately or after page fault resolution), the desired physical address is constructed from the PFN field of the PTE, followed by the byte offset field from the original virtual address.
Now that you have the overall picture, let’s look at the detailed structure of page directories, page tables, and PTEs.
Page Directories
On non-PAE x86 systems, each process has a single page directory, a page the memory manager creates to map the location of all page tables for that process. The physical address of the process page directory is stored in the kernel process (KPROCESS) block, but it is also mapped virtually at address 0xC0300000 on x86 non-PAE systems. (For more detailed information about the KPROCESS and other process data structures, refer to Chapter 5, “Processes, Threads, and Jobs” in Part 1.)
The CPU obtains the location of the page directory from a privileged CPU register called CR3. It contains the page frame number of the page directory. (Since the page directory is itself always page-aligned, the low-order 12 bits of its address are always zero, so there is no need for CR3 to supply these.) Each time a context switch occurs to a thread that is in a different process than that of the currently executing thread, the context switch routine in the kernel loads this register from a field in the KPROCESS block of the new process. Context switches between threads in the same process don’t result in reloading the physical address of the page directory because all threads within the same process share the same process address space and thus use the same page directory and page tables.
The page directory is composed of page directory entries (PDEs), each of which is 4 bytes long. The PDEs in the page directory describe the state and location of all the possible page tables for the process. As described later in the chapter, page tables are created on demand, so the page directory for most processes points only to a small set of page tables. (If a page table does not yet exist, the VAD tree is consulted to determine whether an access should materialize it.) The format of a PDE isn’t repeated here because it’s mostly the same as a hardware PTE, which is described shortly.
To describe the full 4-GB virtual address space, 1,024 page tables are required. The process page directory that maps these page tables contains 1,024 PDEs. Therefore, the page directory index needs to be 10 bits wide (210 = 1,024).
EXPERIMENT: EXAMINING THE PAGE DIRECTORY AND PDES
You can see the physical address of the currently running process’s page directory by examining the DirBase field in the !process kernel debugger output:
lkd> !process -1 0
PROCESS 857b3528 SessionId: 1 Cid: 0f70 Peb: 7ffdf000 ParentCid: 0818
DirBase: 47c9b000 ObjectTable: b4c56c48 HandleCount: 226.
Image: windbg.exe
You can see the page directory’s virtual address by examining the kernel debugger output for the PTE of a particular virtual address, as shown here:
lkd> !pte 10004
VA 00010004
PDE at C0300000 PTE at C0000040
contains 6F06B867 contains 3EF8C847
pfn 6f06b ---DA--UWEV pfn 3ef8c ---D---UWEV
The PTE part of the kernel debugger output is defined in the section Page Tables and Page Table Entries. We will describe this output further in the section on x86 PAE translation.
Because Windows provides a private address space for each process, each process has its own page directory and page tables to map that process’s private address space. However, the page tables that describe system space are shared among all processes (and session space is shared only among processes in a session). To avoid having multiple page tables describing the same virtual memory, when a process is created, the page directory entries that describe system space are initialized to point to the existing system page tables. If the process is part of a session, session space page tables are also shared by pointing the session space page directory entries to the existing session page tables.
Page Tables and Page Table Entries
Each page directory entry points to a page table. A page table is a simple array of PTEs. The virtual address’s page table index field (as shown in Figure 10-18) indicates which PTE within the page table corresponds to and describes the data page in question. The page table index is 10 bits wide, allowing you to reference up to 1,024 4-byte PTEs. Of course, because x86 provides a 4-GB virtual address space, more than one page table is needed to map the entire address space. To calculate the number of page tables required to map the entire 4-GB virtual address space, divide 4 GB by the virtual memory mapped by a single page table. Recall that each page table on an x86 system maps 4 MB of data pages. Thus, 1,024 page tables (4 GB / 4 MB) are required to map the full 4-GB address space. This corresponds with the 1,024 entries in the page directory.
You can use the !pte command in the kernel debugger to examine PTEs. (See the experiment EXPERIMENT: Translating Addresses) We’ll discuss valid PTEs here and invalid PTEs in a later section. Valid PTEs have two main fields: the page frame number (PFN) of the physical page containing the data or of the physical address of a page in memory, and some flags that describe the state and protection of the page, as shown in Figure 10-19.
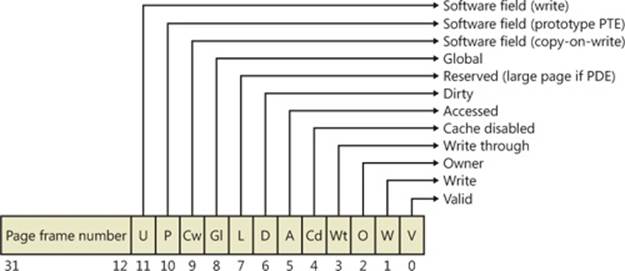
Figure 10-19. Valid x86 hardware PTEs
As you’ll see later, the bits labeled “Software field” and “Reserved” in Figure 10-19 are ignored by the MMU, whether or not the PTE is valid. These bits are stored and interpreted by the memory manager. Table 10-11 briefly describes the hardware-defined bits in a valid PTE.
Table 10-11. PTE Status and Protection Bits
|
Name of Bit |
Meaning |
|
Accessed |
Page has been accessed. |
|
Cache disabled |
Disables CPU caching for that page. |
|
Copy-on-write |
Page is using copy-on-write (described earlier). |
|
Dirty |
Page has been written to. |
|
Global |
Translation applies to all processes. (For example, a translation buffer flush won’t affect this PTE.) |
|
Large page |
Indicates that the PDE maps a 4-MB page (or 2 MB on PAE systems). See the section Large and Small Pages earlier in the chapter. |
|
Owner |
Indicates whether user-mode code can access the page or whether the page is limited to kernel-mode access. |
|
Prototype |
The PTE is a prototype PTE, which is used as a template to describe shared memory associated with section objects. |
|
Valid |
Indicates whether the translation maps to a page in physical memory. |
|
Write through |
Marks the page as write-through or (if the processor supports the page attribute table) write-combined. This is typically used to map video frame buffer memory. |
|
Write |
Indicates to the MMU whether the page is writable. |
On x86 systems, a hardware PTE contains two bits that can be changed by the MMU, the Dirty bit and the Accessed bit. The MMU sets the Accessed bit whenever the page is read or written (provided it is not already set). The MMU sets the Dirty bit whenever a write operation occurs to the page. The operating system is responsible for clearing these bits at the appropriate times; they are never cleared by the MMU.
The x86 MMU uses a Write bit to provide page protection. When this bit is clear, the page is read-only; when it is set, the page is read/write. If a thread attempts to write to a page with the Write bit clear, a memory management exception occurs, and the memory manager’s access fault handler (described later in the chapter) must determine whether the thread can be allowed to write to the page (for example, if the page was really marked copy-on-write) or whether an access violation should be generated.
Hardware vs. Software Write Bits in Page Table Entries
The additional Write bit implemented in software (as mentioned in Table 10-11) is used to force updating of the Dirty bit to be synchronized with updates to Windows memory management data. In a simple implementation, the memory manager would set the hardware Write bit (bit 1) for any writable page, and a write to any such page will cause the MMU to set the Dirty bit in the page table entry. Later, the Dirty bit will tell the memory manager that the contents of that physical page must be written to backing store before the physical page can be used for something else.
In practice, on multiprocessor systems, this can lead to race conditions that are expensive to resolve. The MMUs of the various processors can, at any time, set the Dirty bit of any PTE that has its hardware Write bit set. The memory manager must, at various times, update the process working set list to reflect the state of the Dirty bit in a PTE. The memory manager uses a pushlock to synchronize access to the working set list. But on a multiprocessor system, even while one processor is holding the lock, the Dirty bit might be changed by MMUs of other CPUs. This raises the possibility of missing an update to a Dirty bit.
To avoid this, the Windows memory manager initializes both read-only and writable pages with the hardware Write bit (bit 1) of their PTEs set to 0 and records the true writable state of the page in the software Write bit (bit 11). On the first write access to such a page, the processor will raise a memory management exception because the hardware Write bit is clear, just as it would be for a true read-only page. In this case, though, the memory manager learns that the page actually is writable (via the software Write bit), acquires the working set pushlock, sets the Dirty bit and the hardware Write bit in the PTE, updates the working set list to note that the page has been changed, releases the working set pushlock, and dismisses the exception. The hardware write operation then proceeds as usual, but the setting of the Dirty bit is made to happen with the working set list pushlock held.
On subsequent writes to the page, no exceptions occur because the hardware Write bit is set. The MMU will redundantly set the Dirty bit, but this is benign because the “written-to” state of the page is already recorded in the working set list. Forcing the first write to a page to go through this exception handling may seem to be excessive overhead. However, it happens only once per writable page as long as the page remains valid. Furthermore, the first access to almost any page already goes through memory management exception handling because pages are usually initialized in the invalid state (PTE bit 0 is clear). If the first access to a page is also the first write access to the page, the Dirty bit handling just described will occur within the handling of the first-access page fault, so the additional overhead is small. Finally, on both uniprocessor and multiprocessor systems, this implementation allows flushing of the translation look-aside buffer (described later) without holding a lock for each page being flushed.
Byte Within Page
Once the memory manager has determined the physical page number, it must locate the requested data within that page. This is the purpose of the byte offset field. The byte offset from the original virtual address is simply copied to the corresponding field in the physical address. Onx86 systems, the byte offset is 12 bits wide, allowing you to reference up to 4,096 bytes of data (the size of a page). Another way to interpret this is that the byte offset from the virtual address is concatenated to the physical page number retrieved from the PTE. This completes the translation of a virtual address to a physical address.
Translation Look-Aside Buffer
As you’ve learned so far, each hardware address translation requires two lookups: one to find the right entry in the page directory (which provides the location of the page table) and one to find the right entry in the page table. Because doing two additional memory lookups for every reference to a virtual address would triple the required bandwidth to memory, resulting in poor performance, all CPUs cache address translations so that repeated accesses to the same addresses don’t have to be repeatedly translated. This cache is an array of associative memory called the translation look-aside buffer, or TLB. Associative memory is a vector whose cells can be read simultaneously and compared to a target value. In the case of the TLB, the vector contains the virtual-to-physical page mappings of the most recently used pages, as shown in Figure 10-20, and the type of page protection, size, attributes, and so on applied to each page. Each entry in the TLB is like a cache entry whose tag holds portions of the virtual address and whose data portion holds a physical page number, protection field, valid bit, and usually a dirty bit indicating the condition of the page to which the cached PTE corresponds. If a PTE’s global bit is set (as is done by Windows for system space pages that are visible to all processes), the TLB entry isn’t invalidated on process context switches.
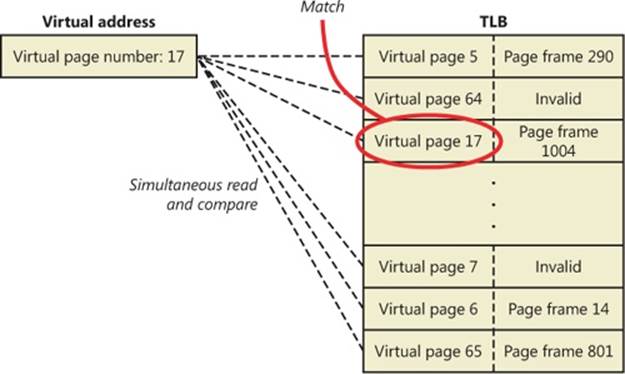
Figure 10-20. Accessing the translation look-aside buffer
Virtual addresses that are used frequently are likely to have entries in the TLB, which provides extremely fast virtual-to-physical address translation and, therefore, fast memory access. If a virtual address isn’t in the TLB, it might still be in memory, but multiple memory accesses are needed to find it, which makes the access time slightly slower. If a virtual page has been paged out of memory or if the memory manager changes the PTE, the memory manager is required to explicitly invalidate the TLB entry. If a process accesses it again, a page fault occurs, and the memory manager brings the page back into memory (if needed) and re-creates its PTE entry (which then results in an entry for it in the TLB).
Physical Address Extension (PAE)
The Intel x86 Pentium Pro processor introduced a memory-mapping mode called Physical Address Extension (PAE). With the proper chipset, the PAE mode allows 32-bit operating systems access to up to 64 GB of physical memory on current Intel x86 processors (up from 4 GB without PAE) and up to 1,024 GB of physical memory when running on x64 processors in legacy mode (although Windows currently limits this to 64 GB due to the size of the PFN database required to describe so much memory). When the processor is running in PAE mode, thememory management unit (MMU) divides virtual addresses mapped by normal pages into four fields, as shown in Figure 10-21. The MMU still implements page directories and page tables, but under PAE a third level, the page directory pointer table, exists above them.
One way in which 32-bit applications can take advantage of such large memory configurations is described in the earlier section Address Windowing Extensions. However, even if applications are not using such functions, the memory manager will use all available physical memory for multiple processes’ working sets, file cache, and trimmed private data through the use of the system cache, standby, and modified lists (described in the section Page Frame Number Database).
PAE mode is selected at boot time and cannot be changed without rebooting. As explained in Chapter 2 in Part 1, there is a special version of the 32-bit Windows kernel with support for PAE called Ntkrnlpa.exe. Thirty-two-bit systems that have hardware support for nonexecutable memory (described earlier, in the section No Execute Page Protection) are booted by default using this PAE kernel, because PAE mode is required to implement the no-execute feature. To force the loading of the PAE-enabled kernel, you can set the pae BCD option to ForceEnable.
Note that the PAE kernel is installed on the disk on all 32-bit Windows systems, even systems with small memory and without hardware no-execute support. This is to allow testing of PAE-related code, even on small memory systems, and to avoid the need for reinstalling Windows should more RAM be added later. Another BCD option relevant to PAE is nolowmem, which discards memory below 4 GB (assuming you have at least 5 GB of physical memory) and relocates device drivers above this range. This guarantees that drivers will be presented with physical addresses greater than 32 bits, which makes any possible driver sign extension bugs easier to find.
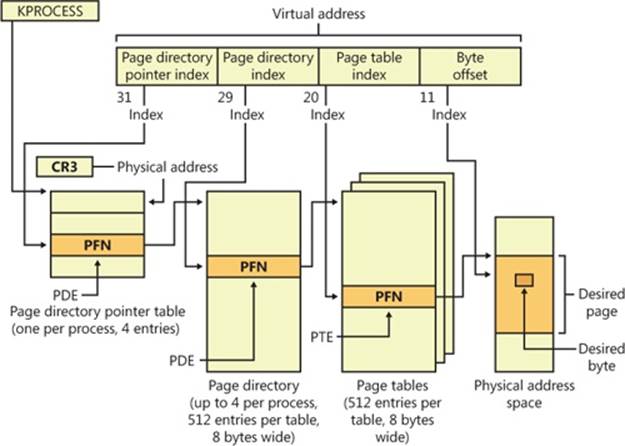
Figure 10-21. Page mappings with PAE
To understand PAE, it is useful to understand the derivation of the sizes of the various structures and bit fields. Recall that the goal of PAE is to allow addressing of more than 4 GB of RAM. The 4-GB limit for RAM addresses without PAE comes from the 12-bit byte offset and the 20-bit page frame number fields of physical addresses: 12 + 20 = 32 bits of physical address, and 232bytes = 4 GB. (Note that this is due to a limit of the physical address format and the number of bits allocated for the PFN within a page table entry. The fact that virtual addresses are 32 bits wide on x86, with or without PAE, does not limit the physical address space.)
Under PAE, the PFN is expanded to 24 bits. Combined with the 12-bit byte offset, this allows addressing of 224 + 12 bytes, or 64 GB, of memory.
To provide the 24-bit PFN, PAE expands the PFN fields of page table and page directory entries from 20 to 24 bits. To allow room for this expansion, the page table and page directory entries are 8 bytes wide instead of 4. (This would seem to expand the PFN field of the PTE and PDE by 32 bits rather than just 4, but in x86 processors, PFNs are limited to 24 bits. This does leave a large number of bits in the PDE unused—or, rather, available for future expansion.)
Since both page tables and page directories have to fit in one page, these tables can then have only 512 entries instead of 1,024. So the corresponding index fields of the virtual address are accordingly reduced from 10 to 9 bits.
This then leaves the two high-order bits of the virtual address unaccounted for. So PAE expands the number of page directories from one to four and adds a third-level address translation table, called the page directory pointer table, or PDPT. This table contains only four entries, 8 bytes each, which provide the PFNs of the four page directories. The two high-order bits of the virtual address are used to index into the PDPT and are called the page directory pointer index.
As before, CR3 provides the location of the top-level table, but that is now the PDPT rather than the page directory. The PDPT must be aligned on a 32-byte boundary and must furthermore reside in the first 4 GB of RAM (because CR3 on x86 is only a 32-bit register, even with PAE enabled).
Note that PAE mode can address more memory than the standard translation mode not directly because of the extra level of translation, but because the physical address format has been expanded. The extra level of translation is required to allow processing of all 32 bits of a virtual address.
EXPERIMENT: TRANSLATING ADDRESSES
To clarify how address translation works, this experiment shows a real example of translating a virtual address on an x86 PAE system, using the available tools in the kernel debugger to examine the PDPT, page directories, page tables, and PTEs. (It is common for Windows on today’s x86 processors, even with less than 4 GB of RAM, to run in PAE mode because PAE mode is required to enable no-execute memory access protection.) In this example, we’ll work with a process that has virtual address 0x30004, currently mapped to a valid physical address. In later examples, you’ll see how to follow address translation for invalid addresses with the kernel debugger.
First let’s convert 0x30004 to binary and break it into the three fields that are used to translate an address. In binary, 0x30004 is 11.0000.0000.0000.0100. Breaking it into the component fields yields the following:
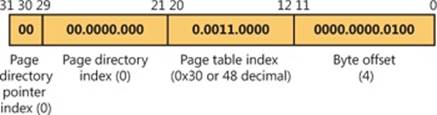
To start the translation process, the CPU needs the physical address of the process’s page directory pointer table, found in the CR3 register while a thread in that process is running. You can display this address by looking at the DirBase field in the output of the !process command, as shown here:
lkd> !process -1 0
PROCESS 852d1030 SessionId: 1 Cid: 0dec Peb: 7ffdf000 ParentCid: 05e8
DirBase: ced25440 ObjectTable: a2014a08 HandleCount: 221.
Image: windbg.exe
The DirBase field shows that the page directory pointer table is at physical address 0xced25440. As shown in the preceding illustration, the page directory pointer table index field in our example virtual address is 0. Therefore, the PDPT entry that contains the physical address of the relevant page directory is the first entry in the PDPT, at physical address 0xced25440.
As under x86 non-PAE systems, the kernel debugger !pte command displays the PDE and PTE that describe a virtual address, as shown here:
lkd> !pte 30004
VA 00030004
PDE at C0600000 PTE at C0000180
contains 000000002EBF3867 contains 800000005AF4D025
pfn 2ebf3 ---DA--UWEV pfn 5af4d ----A--UR-V
The debugger does not show the page directory pointer table, but it is easy to display given its physical address:
lkd> !dq ced25440 L 4
#ced25440 00000000`2e8ff801 00000000`2c9d8801
#ced25450 00000000`2e6b1801 00000000`2e73a801
Here we have used the debugger extension command !dq. This is similar to the dq command (display as quadwords—“quadwords” being a name for a 64-bit field; this came from the day when “words” were often 16 bits), but it lets us examine memory by physical rather than virtual address. Since we know that the PDPT is only four entries long, we added the L 4 length argument to keep the output uncluttered.
As illustrated previously, the PDPT index (the two most significant bits) from our example virtual address equal 0, so the PDPT entry we want is the first displayed quadword. PDPT entries have a format similar to PD entries and PT entries, so we can see by inspection that this one contains a PFN of 0x2e8ff, for a physical address of 2e8ff000. That’s the physical address of the page directory.
The !pte output shows the PDE address as a virtual address, not physical. On x86 systems with PAE, the first process page directory starts at virtual address 0xC0600000. The page directory index field of our example virtual address is 0, so we’re looking at the first PDE in the page directory. Therefore, in this case, the PDE address is the same as the page directory address.
As with non-PAE, the page directory entry provides the PFN of the needed page table; in this example, the PFN is 0x2ebf3. So the page table starts at physical address 0x2ebf3000. To this the MMU will add the page table index field (0x30) from the virtual address, multiplied by 8 (the size of a PTE in bytes; this would be 4 on a non-PAE system). The resulting physical address of the PTE is then 0x2ebf3180.
The debugger shows that this PTE is at virtual address 0xC0000180. Notice that the byte offset portion (0x180) is the same as that from the physical address, as is always the case in address translation. Because the memory manager maps page tables starting at 0xC0000000, adding 0x180 to 0xC0000000 yields the virtual address shown in the kernel debugger output: 0xC0000180. The debugger shows that the PFN field of the PTE is 0x5af4d.
Finally, we can consider the byte offset from the original address. As described previously, the MMU will concatenate the byte offset to the PFN from the PTE, giving a physical address of 0x5af4d004. This is the physical address that corresponds to the original virtual address of 0x30004—at the moment.
The flags bits from the PTE are interpreted to the right of the PFN number. For example, the PTE that describes the page being referenced has flags of --A--UR-V. Here, A stands for accessed (the page has been read), U for user-mode accessible (as opposed to kernel-mode accessible only), R for read-only page (rather than writable), and V for valid (the PTE represents a valid page in physical memory).
To confirm our calculation of the physical address, we can look at the memory in question via both its virtual and its physical addresses. First, using the debugger’s dd command (display dwords) on the virtual address, we see the following:
lkd> dd 30004
00030004 00000020 00000001 00003020 000000dc
00030014 00000000 00000020 00000000 00000014
00030024 00000001 00000007 00000034 0000017c
00030034 00000001 00000000 00000000 00000000
00030044 00000000 00000000 00000002 1a26ef4e
00030054 00000298 00000044 000002e0 00000260
00030064 00000000 f33271ba 00000540 0000004a
00030074 0000058c 0000031e 00000000 2d59495b
And with the !dd command on the physical address just computed, we see the same contents:
lkd> !dd 5af4d004
#5af4d004 00000020 00000001 00003020 000000dc
#5af4d014 00000000 00000020 00000000 00000014
#5af4d024 00000001 00000007 00000034 0000017c
#5af4d034 00000001 00000000 00000000 00000000
#5af4d044 00000000 00000000 00000002 1a26ef4e
#5af4d054 00000298 00000044 000002e0 00000260
#5af4d064 00000000 f33271ba 00000540 0000004a
#5af4d074 0000058c 0000031e 00000000 2d59495b
We could similarly compare the displays from the virtual and physical addresses of the PTE and PDE.
x64 Virtual Address Translation
Address translation on x64 is similar to x86 PAE, but with a fourth level added. Each process has a top-level extended page directory (called the page map level 4 table) that contains the physical locations of 512 third-level structures, called page parent directories. The page parent directory is analogous to the x86 PAE page directory pointer table, but there are 512 of them instead of just 1, and each page parent directory is an entire page, containing 512 entries instead of just 4. Like the PDPT, the page parent directory’s entries contain the physical locations of second-level page directories, each of which in turn contains 512 entries providing the locations of the individual page tables. Finally, the page tables (each of which contain 512 page table entries) contain the physical locations of the pages in memory. (All of the “physical locations” in the preceding description are stored in these structures as page frame numbers, or PFNs.)
Current implementations of the x64 architecture limit virtual addresses to 48 bits. The components that make up this 48-bit virtual address are shown in Figure 10-22. The connections between these structures are shown in Figure 10-23. Finally, the format of an x64 hardware page table entry is shown in Figure 10-24.
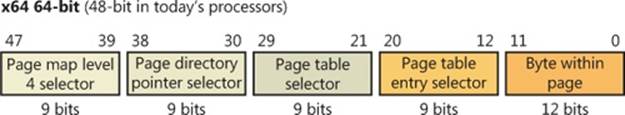
Figure 10-22. x64 virtual address
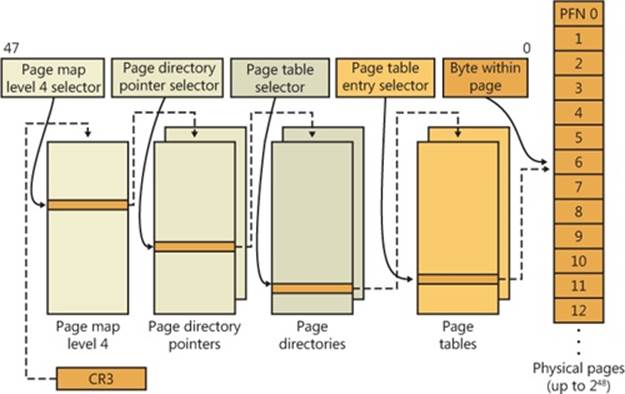
Figure 10-23. x64 address translation structures
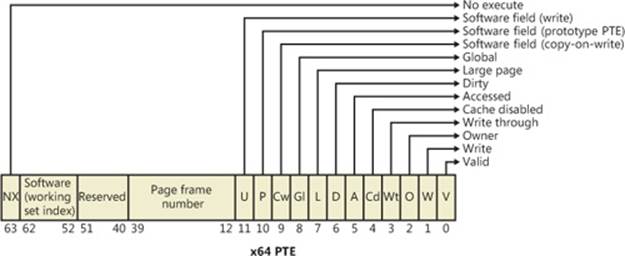
Figure 10-24. x64 hardware page table entry
IA64 Virtual Address Translation
The virtual address space for IA64 is divided into eight regions by the hardware. Each region can have its own set of page tables. Windows uses five of the regions, three of which have page tables. Table 10-12 lists the regions and how they are used.
Table 10-12. The IA64 Regions
|
Region |
Use |
|
0 |
User code and data |
|
1 |
Session space code and data |
|
2 |
Unused |
|
3 |
Unused |
|
4 |
Kseg3, which is a cached, 1-to-1 mapping of physical memory. No page tables are needed for this region because the necessary TLB inserts are done directly by the memory manager. |
|
5 |
Kseg4, which is a noncached, 1-to-1 mapping for physical memory. This is used only in a few places for accessing I/O locations such as the I/O port range. There are no page tables needed for this region. |
|
6 |
Unused |
|
7 |
Kernel code and data |
Address translation by 64-bit Windows on the IA64 platform uses a three-level page table scheme. Each process has a page directory pointer structure that contains 1,024 pointers to page directories. Each page directory contains 1,024 pointers to page tables, which in turn point to physical pages. Figure 10-25 shows the format of an IA64 hardware PTE.
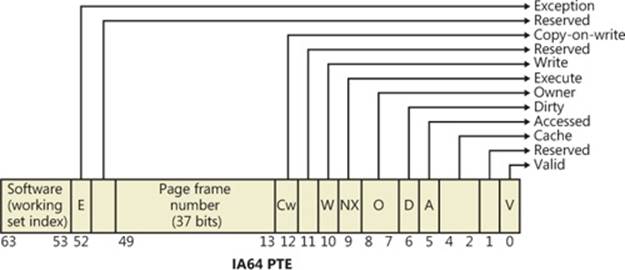
Figure 10-25. IA64 page table entry
Page Fault Handling
Earlier, you saw how address translations are resolved when the PTE is valid. When the PTE valid bit is clear, this indicates that the desired page is for some reason not currently accessible to the process. This section describes the types of invalid PTEs and how references to them are resolved.
NOTE
Only the 32-bit x86 PTE formats are detailed in this section. PTEs for 64-bit systems contain similar information, but their detailed layout is not presented.
A reference to an invalid page is called a page fault. The kernel trap handler (introduced in the section “Trap Dispatching” in Chapter 3 in Part 1) dispatches this kind of fault to the memory manager fault handler (MmAccessFault) to resolve. This routine runs in the context of the thread that incurred the fault and is responsible for attempting to resolve the fault (if possible) or raise an appropriate exception. These faults can be caused by a variety of conditions, as listed in Table 10-13.
Table 10-13. Reasons for Access Faults
|
Reason for Fault |
Result |
|
Accessing a page that isn’t resident in memory but is on disk in a page file or a mapped file |
Allocate a physical page, and read the desired page from disk and into the relevant working set |
|
Accessing a page that is on the standby or modified list |
Transition the page to the relevant process, session, or system working set |
|
Accessing a page that isn’t committed (for example, reserved address space or address space that isn’t allocated) |
Access violation |
|
Accessing a page from user mode that can be accessed only in kernel mode |
Access violation |
|
Writing to a page that is read-only |
Access violation |
|
Accessing a demand-zero page |
Add a zero-filled page to the relevant working set |
|
Writing to a guard page |
Guard-page violation (if a reference to a user-mode stack, perform automatic stack expansion) |
|
Writing to a copy-on-write page |
Make process-private (or session-private) copy of page, and replace original in process, session, or system working set |
|
Writing to a page that is valid but hasn’t been written to the current backing store copy |
Set Dirty bit in PTE |
|
Executing code in a page that is marked as no execute |
Access violation (supported only on hardware platforms that support no execute protection) |
The following section describes the four basic kinds of invalid PTEs that are processed by the access fault handler. Following that is an explanation of a special case of invalid PTEs, prototype PTEs, which are used to implement shareable pages.
Invalid PTEs
If the valid bit of a PTE encountered during address translation is zero, the PTE represents an invalid page—one that will raise a memory management exception, or page fault, upon reference. The MMU ignores the remaining bits of the PTE, so the operating system can use these bits to store information about the page that will assist in resolving the page fault.
The following list details the four kinds of invalid PTEs and their structure. These are often referred to as software PTEs because they are interpreted by the memory manager rather than the MMU. Some of the flags are the same as those for a hardware PTE as described in Table 10-11, and some of the bit fields have either the same or similar meanings to corresponding fields in the hardware PTE.
§ Page file The desired page resides within a paging file. As illustrated in Figure 10-26, 4 bits in the PTE indicate in which of 16 possible page files the page resides, and 20 bits (in x86 non-PAE; more in other modes) provide the page number within the file. The pager initiates an in-page operation to bring the page into memory and make it valid. The page file offset is always non-zero and never all 1s (that is, the very first and last pages in the page file are not used for paging) in order to allow for other formats, described next.
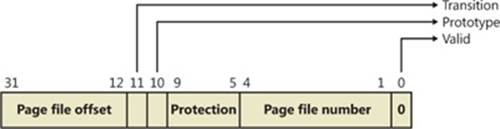
Figure 10-26. A page table entry representing a page in a page file
§ Demand zero This PTE format is the same as the page file PTE shown in the previous entry, but the page file offset is zero. The desired page must be satisfied with a page of zeros. The pager looks at the zero page list. If the list is empty, the pager takes a page from the free list and zeroes it. If the free list is also empty, it takes a page from one of the standby lists and zeroes it.
§ Virtual address descriptor This PTE format is the same as the page file PTE shown previously, but in this case the page file offset field is all 1s. This indicates a page whose definition and backing store, if any, can be found in the process’s virtual address descriptor (VAD) tree. This format is used for pages that are backed by sections in mapped files. The pager finds the VAD that defines the virtual address range encompassing the virtual page and initiates an in-page operation from the mapped file referenced by the VAD. (VADs are described in more detail in a later section.)
§ Transition The desired page is in memory on either the standby, modified, or modified-no-write list or not on any list. As shown in Figure 10-27, the PTE contains the page frame number of the page. The pager will remove the page from the list (if it is on one) and add it to the process working set.
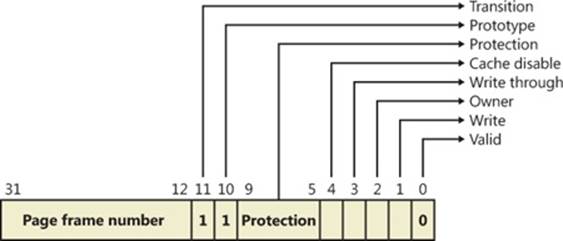
Figure 10-27. A page table entry representing a page in transition
§ Unknown The PTE is zero, or the page table doesn’t yet exist (the page directory entry that would provide the physical address of the page table contains zero). In both cases, the memory manager pager must examine the virtual address descriptors (VADs) to determine whether this virtual address has been committed. If so, page tables are built to represent the newly committed address space. (See the discussion of VADs later in the chapter.) If not (if the page is reserved or hasn’t been defined at all), the page fault is reported as an access violation exception.
Prototype PTEs
If a page can be shared between two processes, the memory manager uses a software structure called prototype page table entries (prototype PTEs) to map these potentially shared pages. For page-file-backed sections, an array of prototype PTEs is created when a section object is first created; for mapped files, portions of the array are created on demand as each view is mapped. These prototype PTEs are part of the segment structure, described at the end of this chapter.
When a process first references a page mapped to a view of a section object (recall that the VADs are created only when the view is mapped), the memory manager uses the information in the prototype PTE to fill in the real PTE used for address translation in the process page table. When a shared page is made valid, both the process PTE and the prototype PTE point to the physical page containing the data. To track the number of process PTEs that reference a valid shared page, a counter in its PFN database entry is incremented. Thus, the memory manager can determine when a shared page is no longer referenced by any page table and thus can be made invalid and moved to a transition list or written out to disk.
When a shareable page is invalidated, the PTE in the process page table is filled in with a special PTE that points to the prototype PTE entry that describes the page, as shown in Figure 10-28.
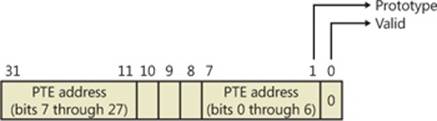
Figure 10-28. Structure of an invalid PTE that points to the prototype PTE
Thus, when the page is later accessed, the memory manager can locate the prototype PTE using the information encoded in this PTE, which in turn describes the page being referenced. A shared page can be in one of six different states as described by the prototype PTE entry:
§ Active/valid The page is in physical memory as a result of another process that accessed it.
§ Transition The desired page is in memory on the standby or modified list (or not on any list).
§ Modified-no-write The desired page is in memory and on the modified-no-write list. (See Table 10-19.)
§ Demand zero The desired page should be satisfied with a page of zeros.
§ Page file The desired page resides within a page file.
§ Mapped file The desired page resides within a mapped file.
Although the format of these prototype PTE entries is the same as that of the real PTE entries described earlier, these prototype PTEs aren’t used for address translation—they are a layer between the page table and the page frame number database and never appear directly in page tables.
By having all the accessors of a potentially shared page point to a prototype PTE to resolve faults, the memory manager can manage shared pages without needing to update the page tables of each process sharing the page. For example, a shared code or data page might be paged out to disk at some point. When the memory manager retrieves the page from disk, it needs only to update the prototype PTE to point to the page’s new physical location—the PTEs in each of the processes sharing the page remain the same (with the valid bit clear and still pointing to theprototype PTE). Later, as processes reference the page, the real PTE will get updated.
Figure 10-29 illustrates two virtual pages in a mapped view. One is valid, and the other is invalid. As shown, the first page is valid and is pointed to by the process PTE and the prototype PTE. The second page is in the paging file—the prototype PTE contains its exact location. The process PTE (and any other processes with that page mapped) points to this prototype PTE.
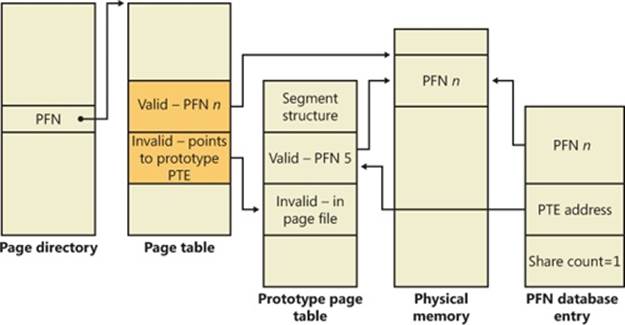
Figure 10-29. Prototype page table entries
In-Paging I/O
In-paging I/O occurs when a read operation must be issued to a file (paging or mapped) to satisfy a page fault. Also, because page tables are pageable, the processing of a page fault can incur additional I/O if necessary when the system is loading the page table page that contains the PTE or the prototype PTE that describes the original page being referenced.
The in-page I/O operation is synchronous—that is, the thread waits on an event until the I/O completes—and isn’t interruptible by asynchronous procedure call (APC) delivery. The pager uses a special modifier in the I/O request function to indicate paging I/O. Upon completion of paging I/O, the I/O system triggers an event, which wakes up the pager and allows it to continue in-page processing.
While the paging I/O operation is in progress, the faulting thread doesn’t own any critical memory management synchronization objects. Other threads within the process are allowed to issue virtual memory functions and handle page faults while the paging I/O takes place. But a number of interesting conditions that the pager must recognize when the I/O completes are exposed:
§ Another thread in the same process or a different process could have faulted the same page (called a collided page fault and described in the next section).
§ The page could have been deleted (and remapped) from the virtual address space.
§ The protection on the page could have changed.
§ The fault could have been for a prototype PTE, and the page that maps the prototype PTE could be out of the working set.
The pager handles these conditions by saving enough state on the thread’s kernel stack before the paging I/O request such that when the request is complete, it can detect these conditions and, if necessary, dismiss the page fault without making the page valid. When and if the faulting instruction is reissued, the pager is again invoked and the PTE is reevaluated in its new state.
Collided Page Faults
The case when another thread in the same process or a different process faults a page that is currently being in-paged is known as a collided page fault. The pager detects and handles collided page faults optimally because they are common occurrences in multithreaded systems. If another thread or process faults the same page, the pager detects the collided page fault, noticing that the page is in transition and that a read is in progress. (This information is in the PFN database entry.) In this case, the pager may issue a wait operation on the event specified in the PFN database entry, or it can choose to issue a parallel I/O to protect the file systems from deadlocks (the first I/O to complete “wins,” and the others are discarded). This event was initialized by the thread that first issued the I/O needed to resolve the fault.
When the I/O operation completes, all threads waiting on the event have their wait satisfied. The first thread to acquire the PFN database lock is responsible for performing the in-page completion operations. These operations consist of checking I/O status to ensure that the I/O operation completed successfully, clearing the read-in-progress bit in the PFN database, and updating the PTE.
When subsequent threads acquire the PFN database lock to complete the collided page fault, the pager recognizes that the initial updating has been performed because the read-in-progress bit is clear and checks the in-page error flag in the PFN database element to ensure that the in-page I/O completed successfully. If the in-page error flag is set, the PTE isn’t updated and an in-page error exception is raised in the faulting thread.
Clustered Page Faults
The memory manager prefetches large clusters of pages to satisfy page faults and populate the system cache. The prefetch operations read data directly into the system’s page cache instead of into a working set in virtual memory, so the prefetched data does not consume virtual address space, and the size of the fetch operation is not limited to the amount of virtual address space that is available. (Also, no expensive TLB-flushing Inter-Processor Interrupt is needed if the page will be repurposed.) The prefetched pages are put on the standby list and marked as in transition in the PTE. If a prefetched page is subsequently referenced, the memory manager adds it to the working set. However, if it is never referenced, no system resources are required to release it. If any pages in the prefetched cluster are already in memory, the memory manager does not read them again. Instead, it uses a dummy page to represent them so that an efficient single large I/O can still be issued, as Figure 10-30 shows.
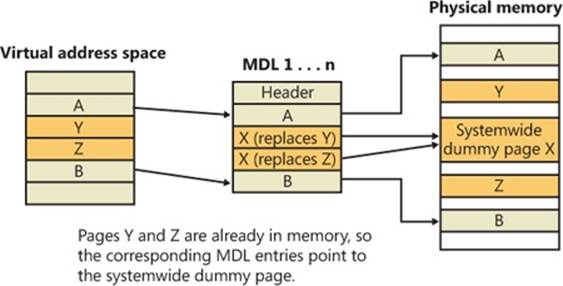
Figure 10-30. Usage of dummy page during virtual address to physical address mapping in an MDL
In the figure, the file offsets and virtual addresses that correspond to pages A, Y, Z, and B are logically contiguous, although the physical pages themselves are not necessarily contiguous. Pages A and B are nonresident, so the memory manager must read them. Pages Y and Z are already resident in memory, so it is not necessary to read them. (In fact, they might already have been modified since they were last read in from their backing store, in which case it would be a serious error to overwrite their contents.) However, reading pages A and B in a single operation is more efficient than performing one read for page A and a second read for page B. Therefore, the memory manager issues a single read request that comprises all four pages (A, Y, Z, and B) from the backing store. Such a read request includes as many pages as make sense to read, based on the amount of available memory, the current system usage, and so on.
When the memory manager builds the memory descriptor list (MDL) that describes the request, it supplies valid pointers to pages A and B. However, the entries for pages Y and Z point to a single systemwide dummy page X. The memory manager can fill the dummy page X with the potentially stale data from the backing store because it does not make X visible. However, if a component accesses the Y and Z offsets in the MDL, it sees the dummy page X instead of Y and Z.
The memory manager can represent any number of discarded pages as a single dummy page, and that page can be embedded multiple times in the same MDL or even in multiple concurrent MDLs that are being used for different drivers. Consequently, the contents of the locations that represent the discarded pages can change at any time.
Page Files
Page files are used to store modified pages that are still in use by some process but have had to be written to disk (because they were unmapped or memory pressure resulted in a trim). Page file space is reserved when the pages are initially committed, but the actual optimally clustered page file locations cannot be chosen until pages are written out to disk.
When the system boots, the Session Manager process (described in Chapter 13) reads the list of page files to open by examining the registry value HKLM\SYSTEM\CurrentControlSet\Control\Session Manager\Memory Management\PagingFiles. This multistring registry value contains the name, minimum size, and maximum size of each paging file. Windows supports up to 16 paging files. On x86 systems running the normal kernel, each page file can be a maximum of 4,095 MB. On x86 systems running the PAE kernel and x64 systems, each page file can be 16 terabytes (TB) while the maximum is 32 TB on IA64 systems. Once open, the page files can’t be deleted while the system is running because the System process (described in Chapter 2 in Part 1) maintains an open handle to each page file. The fact that the paging files are open explains why the built-in defragmentation tool cannot defragment the paging file while the system is up. To defragment your paging file, use the freeware Pagedefrag tool from Sysinternals. It uses the same approach as other third-party defragmentation tools—it runs its defragmentation process early in the boot process before the page files are opened by the Session Manager.
Because the page file contains parts of process and kernel virtual memory, for security reasons the system can be configured to clear the page file at system shutdown. To enable this, set the registry value HKLM\SYSTEM\CurrentControlSet\Control\Session Manager\Memory Management\ClearPageFileAtShutdown to 1. Otherwise, after shutdown, the page file will contain whatever data happened to have been paged out while the system was up. This data could then be accessed by someone who gained physical access to the machine.
If the minimum and maximum paging file sizes are both zero, this indicates a system-managed paging file, which causes the system to choose the page file size as follows:
§ Minimum size: set to the amount of RAM or 1 GB, whichever is larger.
§ Maximum size: set to 3 * RAM or 4 GB, whichever is larger.
As you can see, by default the initial page file size is proportional to the amount of RAM. This policy is based on the assumption that machines with more RAM are more likely to be running workloads that commit large amounts of virtual memory.
EXPERIMENT: VIEWING PAGE FILES
To view the list of page files, look in the registry at HKLM\SYSTEM\CurrentControlSet\Control\Session Manager\Memory Management\PagingFiles. This entry contains the paging file configuration settings modified through the Advanced System Settings dialog box. Open Control Panel, click System And Security, and then System. This is the System Properties dialog box, also reachable by right-clicking on Computer in Explorer and selecting Properties. From there, click Advanced System Settings, then Settings in the Performance area. In the Performance Options dialog box, click the Advanced tab, and then click Change in the Virtual Memory area.
To add a new page file, Control Panel uses the (internal only) NtCreatePagingFile system service defined in Ntdll.dll. Page files are always created as noncompressed files, even if the directory they are in is compressed. To keep new page files from being deleted, a handle is duplicated into the System process so that even after the creating process closes the handle to the new page file, a handle is nevertheless always open to it.
Commit Charge and the System Commit Limit
We are now in a position to more thoroughly discuss the concepts of commit charge and the system commit limit.
Whenever virtual address space is created, for example by a VirtualAlloc (for committed memory) or MapViewOfFile call, the system must ensure that there is room to store it, either in RAM or in backing store, before successfully completing the create request. For mapped memory (other than sections mapped to the page file), the file associated with the mapping object referenced by the MapViewOfFile call provides the required backing store.
All other virtual allocations rely for storage on system-managed shared resources: RAM and the paging file(s). The purpose of the system commit limit and commit charge is to track all uses of these resources to ensure that they are never overcommitted—that is, that there is never more virtual address space defined than there is space to store its contents, either in RAM or in backing store (on disk).
NOTE
This section makes frequent references to paging files. It is possible, though not generally recommended, to run Windows without any paging files. Every reference to paging files here may be considered to be qualified by “if one or more paging files exist.”
Conceptually, the system commit limit represents the total virtual address space that can be created in addition to virtual allocations that are associated with their own backing store—that is, in addition to sections mapped to files. Its numeric value is simply the amount of RAM available to Windows plus the current sizes of any page files. If a page file is expanded, or new page files are created, the commit limit increases accordingly. If no page files exist, the system commit limit is simply the total amount of RAM available to Windows.
Commit charge is the systemwide total of all “committed” memory allocations that must be kept in either RAM or in a paging file. From the name, it should be apparent that one contributor to commit charge is process-private committed virtual address space. However, there are many other contributors, some of them not so obvious.
Windows also maintains a per-process counter called the process page file quota. Many of the allocations that contribute to commit charge contribute to the process page file quota as well. This represents each process’s private contribution to the system commit charge. Note, however, that this does not represent current page file usage. It represents the potential or maximum page file usage, should all of these allocations have to be stored there.
The following types of memory allocations contribute to the system commit charge and, in many cases, to the process page file quota. (Some of these will be described in detail in later sections of this chapter.)
§ Private committed memory is memory allocated with the VirtualAlloc call with the COMMIT option. This is the most common type of contributor to the commit charge. These allocations are also charged to the process page file quota.
§ Page-file-backed mapped memory is memory allocated with a MapViewOfFile call that references a section object, which in turn is not associated with a file. The system uses a portion of the page file as the backing store instead. These allocations are not charged to the process page file quota.
§ Copy-on-write regions of mapped memory, even if it is associated with ordinary mapped files. The mapped file provides backing store for its own unmodified content, but should a page in the copy-on-write region be modified, it can no longer use the original mapped file for backing store. It must be kept in RAM or in a paging file. These allocations are not charged to the process page file quota.
§ Nonpaged and paged pool and other allocations in system space that are not backed by explicitly associated files. Note that even the currently free regions of the system memory pools contribute to commit charge. The nonpageable regions are counted in the commit charge, even though they will never be written to the page file because they permanently reduce the amount of RAM available for private pageable data. These allocations are not charged to the process page file quota.
§ Kernel stacks.
§ Page tables, most of which are themselves pageable, and they are not backed by mapped files. Even if not pageable, they occupy RAM. Therefore, the space required for them contributes to commit charge.
§ Space for page tables that are not yet actually allocated. As we’ll see later, where large areas of virtual space have been defined but not yet referenced (for example, private committed virtual space), the system need not actually create page tables to describe it. But the space for these as-yet-nonexistent page tables is charged to commit charge to ensure that the page tables can be created when they are needed.
§ Allocations of physical memory made via the Address Windowing Extension (AWE) APIs.
For many of these items, the commit charge may represent the potential use of storage rather than the actual. For example, a page of private committed memory does not actually occupy either a physical page of RAM or the equivalent page file space until it’s been referenced at least once. Until then, it is a demand-zero page (described later). But commit charge accounts for such pages when the virtual space is first created. This ensures that when the page is later referenced, actual physical storage space will be available for it.
A region of a file mapped as copy-on-write has a similar requirement. Until the process writes to the region, all pages in it are backed by the mapped file. But the process may write to any of the pages in the region at any time, and when that happens, those pages are thereafter treated as private to the process. Their backing store is, thereafter, the page file. Charging the system commit for them when the region is first created ensures that there will be private storage for them later, if and when the write accesses occur.
A particularly interesting case occurs when reserving private memory and later committing it. When the reserved region is created with VirtualAlloc, system commit charge is not charged for the actual virtual region. It is, however, charged for any new page table pages that will be required to describe the region, even though these might not yet exist. If the region or a part of it is later committed, system commit is charged to account for the size of the region (as is the process page file quota).
To put it another way, when the system successfully completes (for example) a VirtualAlloc or MapViewOfFile call, it makes a “commitment” that the needed storage will be available when needed, even if it wasn’t needed at that moment. Thus, a later memory reference to the allocated region can never fail for lack of storage space. (It could fail for other reasons, such as page protection, the region being deallocated, and so on.) The commit charge mechanism allows the system to keep this commitment.
The commit charge appears in the Performance Monitor counters as Memory: Committed Bytes. It is also the first of the two numbers displayed on Task Manager’s Performance tab with the legend Commit (the second being the commit limit), and it is displayed by Process Explorer’s System Information Memory tab as Commit Charge—Current.
The process page file quota appears in the performance counters as Process: Page File Bytes. The same data appears in the Process: Private Bytes performance counter. (Neither term exactly describes the true meaning of the counter.)
If the commit charge ever reaches the commit limit, the memory manager will attempt to increase the commit limit by expanding one or more page files. If that is not possible, subsequent attempts to allocate virtual memory that uses commit charge will fail until some existing committed memory is freed. The performance counters listed in Table 10-14 allow you to examine private committed memory usage on a systemwide, per-process, or per-page-file, basis.
Table 10-14. Committed Memory and Page File Performance Counters
|
Performance Counter |
Description |
|
Memory: Committed Bytes |
Number of bytes of virtual (not reserved) memory that has been committed. This number doesn’t necessarily represent page file usage because it includes private committed pages in physical memory that have never been paged out. Rather, it represents the charged amount that must be backed by page file space and/or RAM. |
|
Memory: Commit Limit |
Number of bytes of virtual memory that can be committed without having to extend the paging files; if the paging files can be extended, this limit is soft. |
|
Process: Page File Quota |
The process’s contribution to Memory: Committed Bytes. |
|
Process: Private Bytes |
Same as Process: Page File Quota |
|
Process: Working Set—Private |
The subset of Process: Page File Quota that is currently in RAM and can be referenced without a page fault. Also a subset of Process: Working Set. |
|
Process: Working Set |
The subset of Process: Virtual Bytes that is currently in RAM and can be referenced without a page fault. |
|
Process: Virtual Bytes |
The total virtual memory allocation of the process, including mapped regions, private committed regions, and private reserved regions. |
|
Paging File: % Usage |
Percentage of the page file space that is currently in use. |
|
Paging File: % Usage Peak |
The highest observed value of Paging File: % Usage |
Commit Charge and Page File Size
The counters in Table 10-14 can assist you in choosing a custom page file size. The default policy based on the amount of RAM works acceptably for most machines, but depending on the workload it can result in a page file that’s unnecessarily large, or not large enough.
To determine how much page file space your system really needs based on the mix of applications that have run since the system booted, examine the peak commit charge in the Memory tab of Process Explorer’s System Information display. This number represents the peak amount of page file space since the system booted that would have been needed if the system had to page out the majority of private committed virtual memory (which rarely happens).
If the page file on your system is too big, the system will not use it any more or less—in other words, increasing the size of the page file does not change system performance, it simply means the system can have more committed virtual memory. If the page file is too small for the mix of applications you are running, you might get the “system running low on virtual memory” error message. In this case, first check to see whether a process has a memory leak by examining the process private bytes count. If no process appears to have a leak, check the system paged pool size—if a device driver is leaking paged pool, this might also explain the error. (See the EXPERIMENT: Troubleshooting a Pool Leak experiment in the Kernel-Mode Heaps (System Memory Pools) section for how to troubleshoot a pool leak.)
EXPERIMENT: VIEWING PAGE FILE USAGE WITH TASK MANAGER
You can also view committed memory usage with Task Manager by clicking its Performance tab. You’ll see the following counters related to page files:
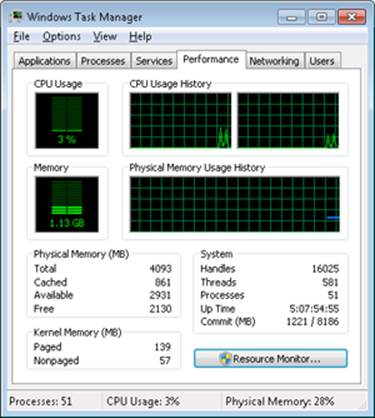
The system commit total is displayed in the lower-right System area as two numbers. The first number represents potential page file usage, not actual page file usage. It is how much page file space would be used if all of the private committed virtual memory in the system had to be paged out all at once. The second number displayed is the commit limit, which displays the maximum virtual memory usage that the system can support before running out of virtual memory (it includes virtual memory backed in physical memory as well as by the paging files). The commit limit is essentially the size of RAM plus the current size of the paging files. It therefore does not account for possible page file expansion.
Process Explorer’s System Information display shows an additional item of information about system commit usage, namely the percentage of the peak as compared to the limit and the current usage as compared to the limit:
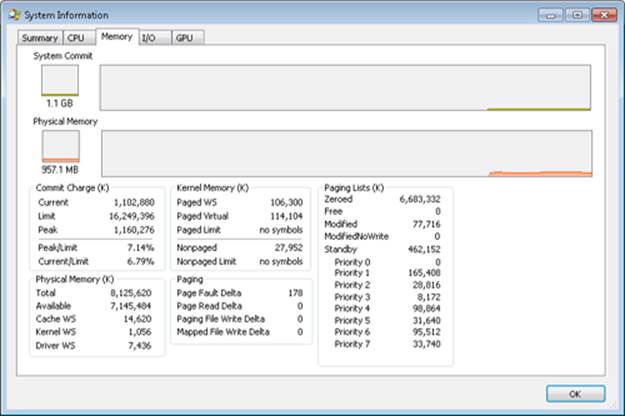
Stacks
Whenever a thread runs, it must have access to a temporary storage location in which to store function parameters, local variables, and the return address after a function call. This part of memory is called a stack. On Windows, the memory manager provides two stacks for each thread, the user stack and the kernel stack, as well as per-processor stacks called DPC stacks. We have already described how the stack can be used to generate stack traces and how exceptions and interrupts store structures on the stack, and we have also talked about how system calls, traps, and interrupts cause the thread to switch from a user stack to its kernel stack. Now, we’ll look at some extra services the memory manager provides to efficiently use stack space.
User Stacks
When a thread is created, the memory manager automatically reserves a predetermined amount of virtual memory, which by default is 1 MB. This amount can be configured in the call to the CreateThread or CreateRemoteThread function or when compiling the application, by using the /STACK:reserve switch in the Microsoft C/C++ compiler, which will store the information in the image header. Although 1 MB is reserved, only the first page of the stack will be committed (unless the PE header of the image specifies otherwise), along with a guard page. When a thread’s stack grows large enough to touch the guard page, an exception will occur, causing an attempt to allocate another guard. Through this mechanism, a user stack doesn’t immediately consume all 1 MB of committed memory but instead grows with demand. (However, it will never shrink back.)
EXPERIMENT: CREATING THE MAXIMUM NUMBER OF THREADS
With only 2 GB of user address space available to each 32-bit process, the relatively large memory that is reserved for each thread’s stack allows for an easy calculation of the maximum number of threads that a process can support: a little less than 2,048, for a total of nearly 2 GB of memory (unless the increaseuserva BCD option is used and the image is large address space aware). By forcing each new thread to use the smallest possible stack reservation size, 64 KB, the limit can grow to about 30,400 threads, which you can test for yourself by using the TestLimit utility from Sysinternals. Here is some sample output:
C:\>testlimit -t
Testlimit - tests Windows limits
By Mark Russinovich
Creating threads ...
Created 30399 threads. Lasterror: 8
If you attempt this experiment on a 64-bit Windows installation (with 8 TB of user address space available), you would expect to see potentially hundreds of thousands of threads created (as long as sufficient memory were available). Interestingly, however, TestLimit will actually create fewer threads than on a 32-bit machine, which has to do with the fact that Testlimit.exe is a 32-bit application and thus runs under the Wow64 environment. (See Chapter 3 in Part 1 for more information on Wow64.) Each thread will therefore have not only its 32-bit Wow64 stack but also its 64-bit stack, thus consuming more than twice the memory, while still keeping only 2 GB of address space. To properly test the thread-creation limit on 64-bit Windows, use theTestlimit64.exe binary instead.
Note that you will need to terminate TestLimit with Process Explorer or Task Manager—using Ctrl+C to break the application will not function because this operation itself creates a new thread, which will not be possible once memory is exhausted.
Kernel Stacks
Although user stack sizes are typically 1 MB, the amount of memory dedicated to the kernel stack is significantly smaller: 12 KB on x86 and 16 KB on x64, followed by another guard PTE (for a total of 16 or 20 KB of virtual address space). Code running in the kernel is expected to have less recursion than user code, as well as contain more efficient variable use and keep stack buffer sizes low. Because kernel stacks live in system address space (which is shared by all processes), their memory usage has a bigger impact of the system.
Although kernel code is usually not recursive, interactions between graphics system calls handled by Win32k.sys and its subsequent callbacks into user mode can cause recursive re-entries in the kernel on the same kernel stack. As such, Windows provides a mechanism for dynamically expanding and shrinking the kernel stack from its initial size of 16 KB. As each additional graphics call is performed from the same thread, another 16-KB kernel stack is allocated (anywhere in system address space; the memory manager provides the ability to jump stacks when nearing the guard page). Whenever each call returns to the caller (unwinding), the memory manager frees the additional kernel stack that had been allocated, as shown in Figure 10-31.
This mechanism allows reliable support for recursive system calls, as well as efficient use of system address space, and is also provided for use by driver developers when performing recursive callouts through the KeExpandKernelStackAndCallout API, as necessary.
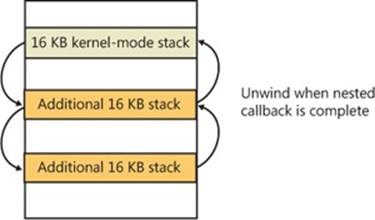
Figure 10-31. Kernel stack jumping
EXPERIMENT: VIEWING KERNEL STACK USAGE
You can use the MemInfo tool from Winsider Seminars & Solutions to display the physical memory currently being occupied by kernel stacks. The –u flag displays physical memory usage for each component, as shown here:
C:\>MemInfo.exe -u | findstr /i "Kernel Stack"
Kernel Stack: 980 ( 3920 kb)
Note the kernel stack after repeating the previous TestLimit experiment:
C:\>MemInfo.exe -u | findstr /i "Kernel Stack"
Kernel Stack: 92169 ( 368676 kb)
Running TestLimit a few more times would easily exhaust physical memory on a 32-bit system, and this limitation results in one of the primary limits on systemwide 32-bit thread count.
DPC Stack
Finally, Windows keeps a per-processor DPC stack available for use by the system whenever DPCs are executing, an approach that isolates the DPC code from the current thread’s kernel stack (which is unrelated to the DPC’s actual operation because DPCs run in arbitrary thread context). The DPC stack is also configured as the initial stack for handling the SYSENTER or SYSCALL instruction during a system call. The CPU is responsible for switching the stack when SYSENTER or SYSCALL is executed, based on one of the model-specific registers (MSRs), but Windows does not want to reprogram the MSR for every context switch, because that is an expensive operation. Windows therefore configures the per-processor DPC stack pointer in the MSR.
Virtual Address Descriptors
The memory manager uses a demand-paging algorithm to know when to load pages into memory, waiting until a thread references an address and incurs a page fault before retrieving the page from disk. Like copy-on-write, demand paging is a form of lazy evaluation—waiting to perform a task until it is required.
The memory manager uses lazy evaluation not only to bring pages into memory but also to construct the page tables required to describe new pages. For example, when a thread commits a large region of virtual memory with VirtualAlloc or VirtualAllocExNuma, the memory manager could immediately construct the page tables required to access the entire range of allocated memory. But what if some of that range is never accessed? Creating page tables for the entire range would be a wasted effort. Instead, the memory manager waits to create a page table until a thread incurs a page fault, and then it creates a page table for that page. This method significantly improves performance for processes that reserve and/or commit a lot of memory but access it sparsely.
The virtual address space that would be occupied by such as-yet-nonexistent page tables is charged to the process page file quota and to the system commit charge. This ensures that space will be available for them should they be actually created. With the lazy-evaluation algorithm, allocating even large blocks of memory is a fast operation. When a thread allocates memory, the memory manager must respond with a range of addresses for the thread to use. To do this, the memory manager maintains another set of data structures to keep track of which virtual addresses have been reserved in the process’s address space and which have not. These data structures are known as virtual address descriptors (VADs). VADs are allocated in nonpaged pool.
Process VADs
For each process, the memory manager maintains a set of VADs that describes the status of the process’s address space. VADs are organized into a self-balancing AVL tree (named after its inventors, Adelson-Velskii and Landis) that optimally balances the tree. This results in, on average, the fewest number of comparisons when searching for a VAD corresponding with a virtual address. There is one virtual address descriptor for each virtually contiguous range of not-free virtual addresses that all have the same characteristics (reserved versus committed versus mapped, memory access protection, and so on). A diagram of a VAD tree is shown in Figure 10-32.
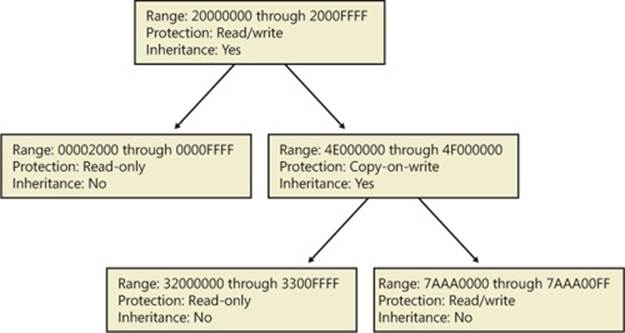
Figure 10-32. Virtual address descriptors
When a process reserves address space or maps a view of a section, the memory manager creates a VAD to store any information supplied by the allocation request, such as the range of addresses being reserved, whether the range will be shared or private, whether a child process can inherit the contents of the range, and the page protection applied to pages in the range.
When a thread first accesses an address, the memory manager must create a PTE for the page containing the address. To do so, it finds the VAD whose address range contains the accessed address and uses the information it finds to fill in the PTE. If the address falls outside the range covered by the VAD or in a range of addresses that are reserved but not committed, the memory manager knows that the thread didn’t allocate the memory before attempting to use it and therefore generates an access violation.
EXPERIMENT: VIEWING VIRTUAL ADDRESS DESCRIPTORS
You can use the kernel debugger’s !vad command to view the VADs for a given process. First find the address of the root of the VAD tree with the !process command. Then specify that address to the !vad command, as shown in the following example of the VAD tree for a process running Notepad.exe:
lkd> !process 0 1 notepad.exe
PROCESS 8718ed90 SessionId: 1 Cid: 1ea68 Peb: 7ffdf000 ParentCid: 0680
DirBase: ce2aa880 ObjectTable: ee6e01b0 HandleCount: 48.
Image: notepad.exe
VadRoot 865f10e0 Vads 51 Clone 0 Private 210. Modified 0. Locked 0.
lkd> !vad 865f10e0
VAD level start end commit
8a05bf88 ( 6) 10 1f 0 Mapped READWRITE
88390ad8 ( 5) 20 20 1 Private READWRITE
87333740 ( 6) 30 33 0 Mapped READONLY
86d09d10 ( 4) 40 41 0 Mapped READONLY
882b49a0 ( 6) 50 50 1 Private READWRITE
...
Total VADs: 51 average level: 5 maximum depth: 6
Rotate VADs
A video card driver must typically copy data from the user-mode graphics application to various other system memory, including the video card memory and the AGP port’s memory, both of which have different caching attributes as well as addresses. In order to quickly allow these different views of memory to be mapped into a process, and to support the different cache attributes, the memory manager implements rotate VADs, which allow video drivers to transfer data directly by using the GPU and to rotate unneeded memory in and out of the process view pages on demand. Figure 10-33 shows an example of how the same virtual address can rotate between video RAM and virtual memory.
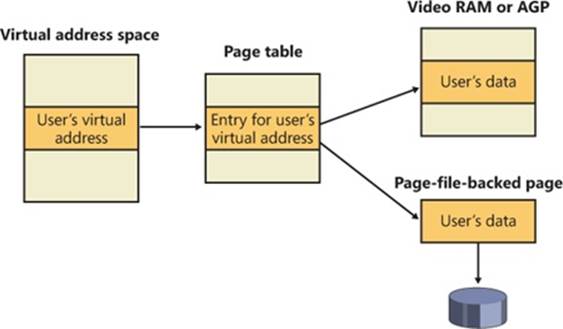
Figure 10-33. Rotate virtual address descriptors
NUMA
Each new release of Windows provides new enhancements to the memory manager to better make use of Non Uniform Memory Architecture (NUMA) machines, such as large server systems (but also Intel i7 and AMD Opteron SMP workstations). The NUMA support in the memory manager adds intelligent knowledge of node information such as location, topology, and access costs to allow applications and drivers to take advantage of NUMA capabilities, while abstracting the underlying hardware details.
When the memory manager is initializing, it calls the MiComputeNumaCosts function to perform various page and cache operations on different nodes and then computes the time it took for those operations to complete. Based on this information, it builds a node graph of access costs (the distance between a node and any other node on the system). When the system requires pages for a given operation, it consults the graph to choose the most optimal node (that is, the closest). If no memory is available on that node, it chooses the next closest node, and so on.
Although the memory manager ensures that, whenever possible, memory allocations come from the ideal processor’s node (the ideal node) of the thread making the allocation, it also provides functions that allow applications to choose their own node, such as the VirtualAllocExNuma, CreateFileMappingNuma, MapViewOfFileExNuma, and AllocateUserPhysicalPagesNuma APIs.
The ideal node isn’t used only when applications allocate memory but also during kernel operation and page faults. For example, when a thread is running on a nonideal processor and takes a page fault, the memory manager won’t use the current node but will instead allocate memory from the thread’s ideal node. Although this might result in slower access time while the thread is still running on this CPU, overall memory access will be optimized as the thread migrates back to its ideal node. In any case, if the ideal node is out of resources, the closest node to the ideal node is chosen and not a random other node. Just like user-mode applications, however, drivers can specify their own node when using APIs such as MmAllocatePagesforMdlEx or MmAllocateContiguousMemorySpecifyCacheNode.
Various memory manager pools and data structures are also optimized to take advantage of NUMA nodes. The memory manager tries to evenly use physical memory from all the nodes on the system to hold the nonpaged pool. When a nonpaged pool allocation is made, the memory manager looks at the ideal node and uses it as an index to choose a virtual memory address range inside nonpaged pool that corresponds to physical memory belonging to this node. In addition, per-NUMA node pool freelists are created to efficiently leverage these types of memory configurations. Apart from nonpaged pool, the system cache and system PTEs are also similarly allocated across all nodes, as well as the memory manager’s look-aside lists.
Finally, when the system needs to zero pages, it does so in parallel across different NUMA nodes by creating threads with NUMA affinities that correspond to the nodes in which the physical memory is located. The logical prefetcher and Superfetch (described later) also use the ideal node of the target process when prefetching, while soft page faults cause pages to migrate to the ideal node of the faulting thread.
Section Objects
As you’ll remember from the section on shared memory earlier in the chapter, the section object, which the Windows subsystem calls a file mapping object, represents a block of memory that two or more processes can share. A section object can be mapped to the paging file or to another file on disk.
The executive uses sections to load executable images into memory, and the cache manager uses them to access data in a cached file. (See Chapter 11 for more information on how the cache manager uses section objects.) You can also use section objects to map a file into a process address space. The file can then be accessed as a large array by mapping different views of the section object and reading or writing to memory rather than to the file (an activity called mapped file I/O). When the program accesses an invalid page (one not in physical memory), a page fault occurs and the memory manager automatically brings the page into memory from the mapped file (or page file). If the application modifies the page, the memory manager writes the changes back to the file during its normal paging operations (or the application can flush a view by using the Windows FlushViewOfFile function).
Section objects, like other objects, are allocated and deallocated by the object manager. The object manager creates and initializes an object header, which it uses to manage the objects; the memory manager defines the body of the section object. The memory manager also implements services that user-mode threads can call to retrieve and change the attributes stored in the body of section objects. The structure of a section object is shown in Figure 10-34.
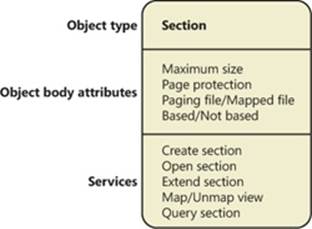
Figure 10-34. A section object
Table 10-15 summarizes the unique attributes stored in section objects.
Table 10-15. Section Object Body Attributes
|
Attribute |
Purpose |
|
Maximum size |
The largest size to which the section can grow in bytes; if mapping a file, the maximum size is the size of the file. |
|
Page protection |
Page-based memory protection assigned to all pages in the section when it is created. |
|
Paging file/Mapped file |
Indicates whether the section is created empty (backed by the paging file—as explained earlier, page-file-backed sections use page-file resources only when the pages need to be written out to disk) or loaded with a file (backed by the mapped file). |
|
Based/Not based |
Indicates whether a section is a based section, which must appear at the same virtual address for all processes sharing it, or a nonbased section, which can appear at different virtual addresses for different processes. |
EXPERIMENT: VIEWING SECTION OBJECTS
With the Object Viewer (Winobj.exe from Sysinternals), you can see the list of sections that have names. You can list the open handles to section objects with any of the tools described in the “Object Manager” section in Chapter 3 in Part 1 that list the open handle table. (As explained in Chapter 3, these names are stored in the object manager directory \Sessions\x\BaseNamed-Objects, where x is the appropriate Session directory. Unnamed section objects are not visible.
As mentioned earlier, you can use Process Explorer from Sysinternals to see files mapped by a process. Select DLLs from the Lower Pane View entry of the View menu, and enable the Mapping Type column in the DLL section of View | Select Columns. Files marked as “Data” in the Mapping column are mapped files (rather than DLLs and other files the image loader loads as modules). We saw this example earlier:
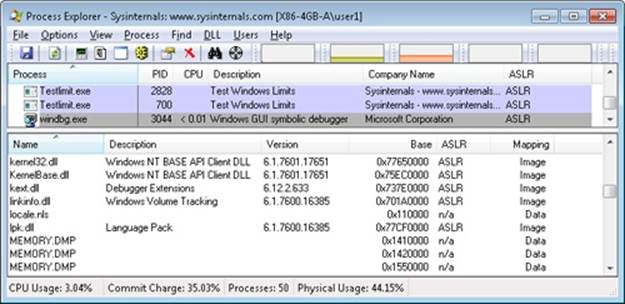
The data structures maintained by the memory manager that describe mapped sections are shown in Figure 10-35. These structures ensure that data read from mapped files is consistent, regardless of the type of access (open file, mapped file, and so on).
For each open file (represented by a file object), there is a single section object pointers structure. This structure is the key to maintaining data consistency for all types of file access as well as to providing caching for files. The section object pointers structure points to one or twocontrol areas. One control area is used to map the file when it is accessed as a data file, and one is used to map the file when it is run as an executable image.
A control area in turn points to subsection structures that describe the mapping information for each section of the file (read-only, read/write, copy-on-write, and so on). The control area also points to a segment structure allocated in paged pool, which in turn points to the prototype PTEs used to map to the actual pages mapped by the section object. As described earlier in the chapter, process page tables point to these prototype PTEs, which in turn map the pages being referenced.
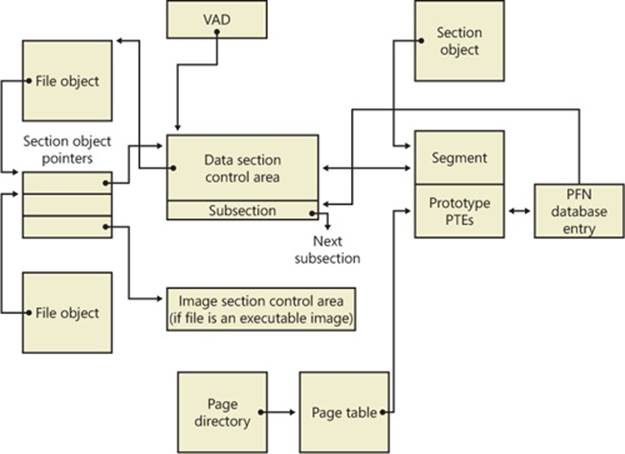
Figure 10-35. Internal section structures
Although Windows ensures that any process that accesses (reads or writes) a file will always see the same, consistent data, there is one case in which two copies of pages of a file can reside in physical memory (but even in this case, all accessors get the latest copy and data consistency is maintained). This duplication can happen when an image file has been accessed as a data file (having been read or written) and then run as an executable image (for example, when an image is linked and then run—the linker had the file open for data access, and then when the image was run, the image loader mapped it as an executable). Internally, the following actions occur:
1. If the executable file was created using the file mapping APIs (or the cache manager), a data control area is created to represent the data pages in the image file being read or written.
2. When the image is run and the section object is created to map the image as an executable, the memory manager finds that the section object pointers for the image file point to a data control area and flushes the section. This step is necessary to ensure that any modified pages have been written to disk before accessing the image through the image control area.
3. The memory manager then creates a control area for the image file.
4. As the image begins execution, its (read-only) pages are faulted in from the image file (or copied directly over from the data file if the corresponding data page is resident).
Because the pages mapped by the data control area might still be resident (on the standby list), this is the one case in which two copies of the same data are in two different pages in memory. However, this duplication doesn’t result in a data consistency issue because, as mentioned, the data control area has already been flushed to disk, so the pages read from the image are up to date (and these pages are never written back to disk).
EXPERIMENT: VIEWING CONTROL AREAS
To find the address of the control area structures for a file, you must first get the address of the file object in question. You can obtain this address through the kernel debugger by dumping the process handle table with the !handle command and noting the object address of a file object. Although the kernel debugger !file command displays the basic information in a file object, it doesn’t display the pointer to the section object pointers structure. Then, using the dt command, format the file object to get the address of the section object pointers structure. This structure consists of three pointers: a pointer to the data control area, a pointer to the shared cache map (explained in Chapter 11), and a pointer to the image control area. From the section object pointers structure, you can obtain the address of a control area for the file (if one exists) and feed that address into the !ca command.
For example, if you open a PowerPoint file and display the handle table for that process using !handle, you will find an open handle to the PowerPoint file as shown here. (For information on using !handle, see the “Object Manager” section in Chapter 3 in Part 1.)
lkd> !handle 1 f 86f57d90 File
.
.
0324: Object: 865d2768 GrantedAccess: 00120089 Entry: c848e648
Object: 865d2768 Type: (8475a2c0) File
ObjectHeader: 865d2750 (old version)
HandleCount: 1 PointerCount: 1
Directory Object: 00000000 Name: \Users\Administrator\Documents\Downloads\
SVR-T331_WH07 (1).pptx {HarddiskVolume3}
Taking the file object address (865d2768 ) and formatting it with dt results in this:
lkd> dt nt!_FILE_OBJECT 865d2768
+0x000 Type : 5
+0x002 Size : 128
+0x004 DeviceObject : 0x84a62320 _DEVICE_OBJECT
+0x008 Vpb : 0x84a60590 _VPB
+0x00c FsContext : 0x8cee4390
+0x010 FsContext2 : 0xbf910c80
+0x014 SectionObjectPointer : 0x86c45584 _SECTION_OBJECT_POINTERS
Then taking the address of the section object pointers structure (0x86c45584) and formatting it with dt results in this:
lkd> dt 0x86c45584 nt!_SECTION_OBJECT_POINTERS
+0x000 DataSectionObject : 0x863d3b00
+0x004 SharedCacheMap : 0x86f10ec0
+0x008 ImageSectionObject : (null)
Finally, use !ca to display the control area using the address:
lkd> !ca 0x863d3b00
ControlArea @ 863d3b00
Segment b1de9d48 Flink 00000000 Blink 8731f80c
Section Ref 1 Pfn Ref 48 Mapped Views 2
User Ref 0 WaitForDel 0 Flush Count 0
File Object 86cf6188 ModWriteCount 0 System Views 2
WritableRefs 0
Flags (c080) File WasPurged Accessed
No name for file
Segment @ b1de9d48
ControlArea 863d3b00 ExtendInfo 00000000
Total Ptes 100
Segment Size 100000 Committed 0
Flags (c0000) ProtectionMask
Subsection 1 @ 863d3b48
ControlArea 863d3b00 Starting Sector 0 Number Of Sectors 100
Base Pte bf85e008 Ptes In Subsect 100 Unused Ptes 0
Flags d Sector Offset 0 Protection 6
Accessed
Flink 00000000 Blink 8731f87c MappedViews 2
Another technique is to display the list of all control areas with the !memusage command. The following excerpt is from the output of this command:
lkd> !memusage
loading PFN database
loading (100% complete)
Compiling memory usage data (99% Complete).
Zeroed: 2654 ( 10616 kb)
Free: 584 ( 2336 kb)
Standby: 402938 (1611752 kb)
Modified: 12732 ( 50928 kb)
ModifiedNoWrite: 3 ( 12 kb)
Active/Valid: 431478 (1725912 kb)
Transition: 1186 ( 4744 kb)
Bad: 0 ( 0 kb)
Unknown: 0 ( 0 kb)
TOTAL: 851575 (3406300 kb)
Building kernel map
Finished building kernel map
Scanning PFN database - (100% complete)
Usage Summary (in Kb):
Control Valid Standby Dirty Shared Locked PageTables name
86d75f18 0 64 0 0 0 0 mapped_file( netcfgx.dll )
8a124ef8 0 4 0 0 0 0 No Name for File
8747af80 0 52 0 0 0 0 mapped_file( iebrshim.dll )
883a2e58 24 8 0 0 0 0 mapped_file( WINWORD.EXE )
86d6eae0 0 16 0 0 0 0 mapped_file( oem13.CAT )
84b19af8 8 0 0 0 0 0 No Name for File
b1672ab0 4 0 0 0 0 0 No Name for File
88319da8 0 20 0 0 0 0 mapped_file( Microsoft-Windows-MediaPlayer-
Package~31bf3856ad364e35~x86~en-US~6.0.6001.18000.cat )
8a04db00 0 48 0 0 0 0 mapped_file( eapahost.dll )
The Control column points to the control area structure that describes the mapped file. You can display control areas, segments, and subsections with the kernel debugger !ca command. For example, to dump the control area for the mapped file Winword.exe in this example, type the !ca command followed by the Control number, as shown here:
lkd> !ca 883a2e58
ControlArea @ 883a2e58
Segment ee613998 Flink 00000000 Blink 88a985a4
Section Ref 1 Pfn Ref 8 Mapped Views 1
User Ref 2 WaitForDel 0 Flush Count 0
File Object 88b45180 ModWriteCount 0 System Views ffff
WritableRefs 80000006
Flags (40a0) Image File Accessed
File: \PROGRA~1\MICROS~1\Office12\WINWORD.EXE
Segment @ ee613998
ControlArea 883a2e58 BasedAddress 2f510000
Total Ptes 57
Segment Size 57000 Committed 0
Image Commit 1 Image Info ee613c80
ProtoPtes ee6139c8
Flags (20000) ProtectionMask
Subsection 1 @ 883a2ea0
ControlArea 883a2e58 Starting Sector 0 Number Of Sectors 2
Base Pte ee6139c8 Ptes In Subsect 1 Unused Ptes 0
Flags 2 Sector Offset 0 Protection 1
Subsection 2 @ 883a2ec0
ControlArea 883a2e58 Starting Sector 2 Number Of Sectors a
Base Pte ee6139d0 Ptes In Subsect 2 Unused Ptes 0
Flags 6 Sector Offset 0 Protection 3
Subsection 3 @ 883a2ee0
ControlArea 883a2e58 Starting Sector c Number Of Sectors 1
Base Pte ee6139e0 Ptes In Subsect 1 Unused Ptes 0
Flags a Sector Offset 0 Protection 5
Subsection 4 @ 883a2f00
ControlArea 883a2e58 Starting Sector d Number Of Sectors 28b
Base Pte ee6139e8 Ptes In Subsect 52 Unused Ptes 0
Flags 2 Sector Offset 0 Protection 1
Subsection 5 @ 883a2f20
ControlArea 883a2e58 Starting Sector 298 Number Of Sectors 1
Base Pte ee613c78 Ptes In Subsect 1 Unused Ptes 0
Flags 2 Sector Offset 0 Protection 1
Driver Verifier
As introduced in Chapter 8, Driver Verifier is a mechanism that can be used to help find and isolate commonly found bugs in device driver or other kernel-mode system code. This section describes the memory management–related verification options Driver Verifier provides (the options related to device drivers are described in Chapter 8).
The verification settings are stored in the registry under HKLM\SYSTEM\CurrentControlSet\Control\Session Manager\Memory Management. The value VerifyDriverLevel contains a bitmask that represents the verification types enabled. The VerifyDrivers value contains the names of the drivers to validate. (These values won’t exist in the registry until you select drivers to verify in the Driver Verifier Manager.) If you choose to verify all drivers, VerifyDrivers is set to an asterisk (*) character. Depending on the settings you have made, you might need to reboot the system for the selected verification to occur.
Early in the boot process, the memory manager reads the Driver Verifier registry values to determine which drivers to verify and which Driver Verifier options you enabled. (Note that if you boot in safe mode, any Driver Verifier settings are ignored.) Subsequently, if you’ve selected at least one driver for verification, the kernel checks the name of every device driver it loads into memory against the list of drivers you’ve selected for verification. For every device driver that appears in both places, the kernel invokes the VfLoadDriver function, which calls other internal Vf* functions to replace the driver’s references to a number of kernel functions with references to Driver Verifier–equivalent versions of those functions. For example, ExAllocatePool is replaced with a call to VerifierAllocatePool. The windowing system driver (Win32k.sys) also makes similar changes to use Driver Verifier–equivalent functions.
Now that we’ve reviewed how Driver Verifier is set up, we’ll examine the six memory-related verification options that can be applied to device drivers: Special Pool, Pool Tracking, Force IRQL Checking, Low Resources Simulation, Miscellaneous Checks, and Automatic Checks
Special Pool The Special Pool option causes the pool allocation routines to bracket pool allocations with an invalid page so that references before or after the allocation will result in a kernel-mode access violation, thus crashing the system with the finger pointed at the buggy driver. Special pool also causes some additional validation checks to be performed when a driver allocates or frees memory.
When special pool is enabled, the pool allocation routines allocate a region of kernel memory for Driver Verifier to use. Driver Verifier redirects memory allocation requests that drivers under verification make to the special pool area rather than to the standard kernel-mode memory pools. When a device driver allocates memory from special pool, Driver Verifier rounds up the allocation to an even-page boundary. Because Driver Verifier brackets the allocated page with invalid pages, if a device driver attempts to read or write past the end of the buffer, the driver will access an invalid page, and the memory manager will raise a kernel-mode access violation.
Figure 10-36 shows an example of the special pool buffer that Driver Verifier allocates to a device driver when Driver Verifier checks for overrun errors.
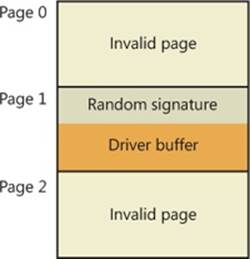
Figure 10-36. Layout of special pool allocations
By default, Driver Verifier performs overrun detection. It does this by placing the buffer that the device driver uses at the end of the allocated page and fills the beginning of the page with a random pattern. Although the Driver Verifier Manager doesn’t let you specify underrundetection, you can set this type of detection manually by adding the DWORD registry value HKLM\SYSTEM\CurrentControlSet\Control\Session Manager\Memory Management\PoolTagOverruns and setting it to 0 (or by running the Gflags utility and selecting the Verify Start option instead of the default option, Verify End). When Windows enforces underrun detection, Driver Verifier allocates the driver’s buffer at the beginning of the page rather than at the end.
The overrun-detection configuration includes some measure of underrun detection as well. When the driver frees its buffer to return the memory to Driver Verifier, Driver Verifier ensures that the pattern preceding the buffer hasn’t changed. If the pattern is modified, the device driver has underrun the buffer and written to memory outside the buffer.
Special pool allocations also check to ensure that the processor IRQL at the time of an allocation and deallocation is legal. This check catches an error that some device drivers make: allocating pageable memory from an IRQL at DPC/dispatch level or above.
You can also configure special pool manually by adding the DWORD registry value HKLM\SYSTEM\CurrentControlSet\Control\Session Manager\Memory Management\PoolTag, which represents the allocation tags the system uses for special pool. Thus, even if Driver Verifier isn’t configured to verify a particular device driver, if the tag the driver associates with the memory it allocates matches what is specified in the PoolTag registry value, the pool allocation routines will allocate the memory from special pool. If you set the value of PoolTag to 0x0000002a or to the wildcard (*), all memory that drivers allocate is from special pool, provided there’s enough virtual and physical memory. (The drivers will revert to allocating from regular pool if there aren’t enough free pages—bounding exists, but each allocation uses two pages.)
Pool Tracking If pool tracking is enabled, the memory manager checks at driver unload time whether the driver freed all the memory allocations it made. If it didn’t, it crashes the system, indicating the buggy driver. Driver Verifier also shows general pool statistics on the Driver Verifier Manager’s Pool Tracking tab. You can also use the !verifier kernel debugger command. This command shows more information than Driver Verifier and is useful to driver writers.
Pool tracking and special pool cover not only explicit allocation calls, such as ExAllocatePoolWithTag, but also calls to other kernel APIs that implicitly allocate pool: IoAllocateMdl, IoAllocateIrp, and other IRP allocation calls; various Rtl string APIs; and IoSetCompletionRoutineEx.
Another driver verified function enabled by the Pool Tracking option has to do with pool quota charges. The call ExAllocatePoolWithQuotaTag charges the current process’s pool quota for the number of bytes allocated. If such a call is made from a deferred procedure call (DPC) routine, the process that is charged is unpredictable because DPC routines may execute in the context of any process. The Pool Tracking option checks for calls to this routine from DPC routine context.
Driver Verifier can also perform locked memory page tracking, which additionally checks for pages that have been left locked after an I/O operation and generates the DRIVER_LEFT_LOCKED_PAGES_IN_PROCESS instead of the PROCESS_HAS_LOCKED_PAGES crash code—the former indicates the driver responsible for the error as well as the function responsible for the locking of the pages.
Force IRQL Checking One of the most common device driver bugs occurs when a driver accesses pageable data or code when the processor on which the device driver is executing is at an elevated IRQL. As explained in Chapter 3 in Part 1, the memory manager can’t service a page fault when the IRQL is DPC/dispatch level or above. The system often doesn’t detect instances of a device driver accessing pageable data when the processor is executing at a high IRQL level because the pageable data being accessed happens to be physically resident at the time. At other times, however, the data might be paged out, which results in a system crash with the stop code IRQL_NOT_LESS_OR_EQUAL (that is, the IRQL wasn’t less than or equal to the level required for the operation attempted—in this case, accessing pageable memory).
Although testing device drivers for this kind of bug is usually difficult, Driver Verifier makes it easy. If you select the Force IRQL Checking option, Driver Verifier forces all kernel-mode pageable code and data out of the system working set whenever a device driver under verification raises the IRQL. The internal function that does this is MiTrimAllSystemPagableMemory. With this setting enabled, whenever a device driver under verification accesses pageable memory when the IRQL is elevated, the system instantly detects the violation, and the resulting system crash identifies the faulty driver.
Another common driver crash that results from incorrect IRQL usage occurs when synchronization objects are part of data structures that are paged and then waited on. Synchronization objects should never be paged because the dispatcher needs to access them at an elevated IRQL, which would cause a crash. Driver Verifier checks whether any of the following structures are present in pageable memory: KTIMER, KMUTEX, KSPIN_LOCK, KEVENT, KSEMAPHORE, ERESOURCE, FAST_MUTEX.
Low Resources Simulation Enabling Low Resources Simulation causes Driver Verifier to randomly fail memory allocations that verified device drivers perform. In the past, developers wrote many device drivers under the assumption that kernel memory would always be available and that if memory ran out, the device driver didn’t have to worry about it because the system would crash anyway. However, because low-memory conditions can occur temporarily, it’s important that device drivers properly handle allocation failures that indicate kernel memory is exhausted.
The driver calls that will be injected with random failures include the ExAllocatePool*, MmProbeAndLockPages, MmMapLockedPagesSpecifyCache, MmMapIoSpace, MmAllocateContiguousMemory, MmAllocatePagesForMdl, IoAllocateIrp, IoAllocateMdl, IoAllocateWorkItem, IoAllocateErrorLogEntry, IOSetCompletionRoutineEx, and various Rtl string APIs that allocate pool. Additionally, you can specify the probability that allocation will fail (6 percent by default), which applications should be subject to the simulation (all are by default), which pool tags should be affected (all are by default), and what delay should be used before fault injection starts (the default is 7 minutes after the system boots, which is enough time to get past the critical initialization period in which a low-memory condition might prevent a device driver from loading).
After the delay period, Driver Verifier starts randomly failing allocation calls for device drivers it is verifying. If a driver doesn’t correctly handle allocation failures, this will likely show up as a system crash.
Miscellaneous Checks Some of the checks that Driver Verifier calls “miscellaneous” allow Driver Verifier to detect the freeing of certain system structures in the pool that are still active. For example, Driver Verifier will check for:
§ Active work items in freed memory (a driver calls ExFreePool to free a pool block in which one or more work items queued with IoQueueWorkItem are present).
§ Active resources in freed memory (a driver calls ExFreePool before calling ExDeleteResource to destroy an ERESOURCE object).
§ Active look-aside lists in freed memory (a driver calls ExFreePool before calling ExDeleteNPagedLookasideList or ExDeletePagedLookasideList to delete the look-aside list).
Finally, when verification is enabled, Driver Verifier also performs certain automatic checks that cannot be individually enabled or disabled. These include:
§ Calling MmProbeAndLockPages or MmProbeAndLockProcessPages on a memory descriptor list (MDL) having incorrect flags. For example, it is incorrect to call MmProbeAndLockPages for an MDL setup by calling MmBuildMdlForNonPagedPool.
§ Calling MmMapLockedPages on an MDL having incorrect flags. For example, it is incorrect to call MmMapLockedPages for an MDL that is already mapped to a system address. Another example of incorrect driver behavior is calling MmMapLockedPages for an MDL that was not locked.
§ Calling MmUnlockPages or MmUnmapLockedPages on a partial MDL (created by using IoBuildPartialMdl).
§ Calling MmUnmapLockedPages on an MDL that is not mapped to a system address.
§ Allocating synchronization objects such as events or mutexes from NonPagedPoolSession memory.
Driver Verifier is a valuable addition to the arsenal of verification and debugging tools available to device driver writers. Many device drivers that first ran with Driver Verifier had bugs that Driver Verifier was able to expose. Thus, Driver Verifier has resulted in an overall improvement in the quality of all kernel-mode code running in Windows.
Page Frame Number Database
In several previous sections, we’ve concentrated on the virtual view of a Windows process—page tables, PTEs, and VADs. In the remainder of this chapter, we’ll explain how Windows manages physical memory, starting with how Windows keeps track of physical memory. Whereas working sets describe the resident pages owned by a process or the system, the page frame number (PFN) database describes the state of each page in physical memory. The page states are listed in Table 10-16.
Table 10-16. Page States
|
Status |
Description |
|
Active (also called Valid) |
The page is part of a working set (either a process working set, a session working set, or a system working set), or it’s not in any working set (for example, nonpaged kernel page) and a valid PTE usually points to it. |
|
Transition |
A temporary state for a page that isn’t owned by a working set and isn’t on any paging list. A page is in this state when an I/O to the page is in progress. The PTE is encoded so that collided page faults can be recognized and handled properly. (Note that this use of the term “transition” differs from the use of the word in the section on invalid PTEs; an invalid transition PTE refers to a page on the standby or modified list.) |
|
Standby |
The page previously belonged to a working set but was removed (or was prefetched/clustered directly into the standby list). The page wasn’t modified since it was last written to disk. The PTE still refers to the physical page but is marked invalid and in transition. |
|
Modified |
The page previously belonged to a working set but was removed. However, the page was modified while it was in use and its current contents haven’t yet been written to disk or remote storage. The PTE still refers to the physical page but is marked invalid and in transition. It must be written to the backing store before the physical page can be reused. |
|
Modified no-write |
Same as a modified page, except that the page has been marked so that the memory manager’s modified page writer won’t write it to disk. The cache manager marks pages as modified no-write at the request of file system drivers. For example, NTFS uses this state for pages containing file system metadata so that it can first ensure that transaction log entries are flushed to disk before the pages they are protecting are written to disk. (NTFS transaction logging is explained in Chapter 12.) |
|
Free |
The page is free but has unspecified dirty data in it. (These pages can’t be given as a user page to a user process without being initialized with zeros, for security reasons.) |
|
Zeroed |
The page is free and has been initialized with zeros by the zero page thread (or was determined to already contain zeros). |
|
Rom |
The page represents read-only memory |
|
Bad |
The page has generated parity or other hardware errors and can’t be used. |
The PFN database consists of an array of structures that represent each physical page of memory on the system. The PFN database and its relationship to page tables are shown in Figure 10-37. As this figure shows, valid PTEs usually point to entries in the PFN database, and the PFN database entries (for nonprototype PFNs) point back to the page table that is using them (if it is being used by a page table). For prototype PFNs, they point back to the prototype PTE.
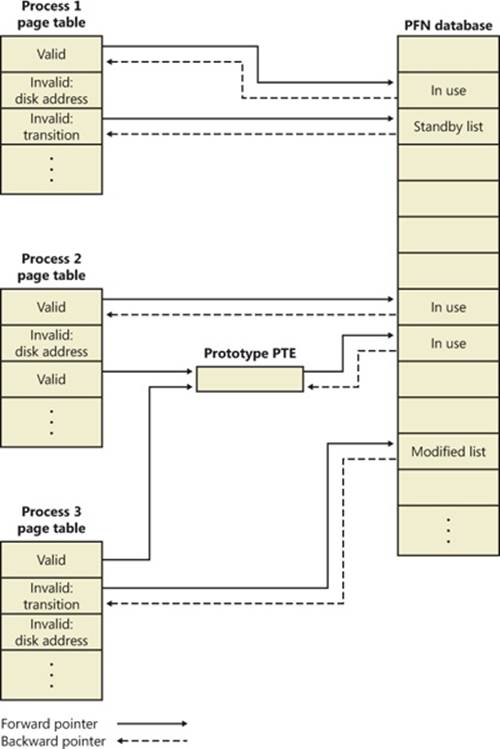
Figure 10-37. Page tables and the page frame number database
Of the page states listed in Table 10-16, six are organized into linked lists so that the memory manager can quickly locate pages of a specific type. (Active/valid pages, transition pages, and overloaded “bad” pages aren’t in any systemwide page list.) Additionally, the standby state is actually associated with eight different lists ordered by priority (we’ll talk about page priority later in this section). Figure 10-38 shows an example of how these entries are linked together.
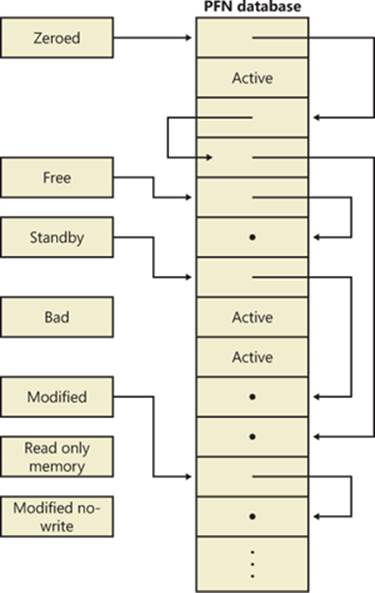
Figure 10-38. Page lists in the PFN database
In the next section, you’ll find out how these linked lists are used to satisfy page faults and how pages move to and from the various lists.
EXPERIMENT: VIEWING THE PFN DATABASE
You can use the MemInfo tool from Winsider Seminars & Solutions to dump the size of the various paging lists by using the –s flag. The following is the output from this command:
C:\>MemInfo.exe -s
MemInfo v2.10 - Show PFN database information
Copyright (C) 2007-2009 Alex Ionescu
www.alex-ionescu.com
Initializing PFN Database... Done
PFN Database List Statistics
Zeroed: 487 ( 1948 kb)
Free: 0 ( 0 kb)
Standby: 379745 (1518980 kb)
Modified: 1052 ( 4208 kb)
ModifiedNoWrite: 0 ( 0 kb)
Active/Valid: 142703 ( 570812 kb)
Transition: 184 ( 736 kb)
Bad: 0 ( 0 kb)
Unknown: 2 ( 8 kb)
TOTAL: 524173 (2096692 kb)
Using the kernel debugger !memusage command, you can obtain similar information, although this will take considerably longer and will require booting into debugging mode.
Page List Dynamics
Figure 10-39 shows a state diagram for page frame transitions. For simplicity, the modified-no-write list isn’t shown.
Page frames move between the paging lists in the following ways:
§ When the memory manager needs a zero-initialized page to service a demand-zero page fault (a reference to a page that is defined to be all zeros or to a user-mode committed private page that has never been accessed), it first attempts to get one from the zero page list. If the list is empty, it gets one from the free page list and zeroes the page. If the free list is empty, it goes to the standby list and zeroes that page.
One reason zero-initialized pages are required is to meet various security requirements, such as the Common Criteria. Most Common Criteria profiles specify that user-mode processes must be given initialized page frames to prevent them from reading a previous process’s memory contents. Therefore, the memory manager gives user-mode processes zeroed page frames unless the page is being read in from a backing store. If that’s the case, the memory manager prefers to use nonzeroed page frames, initializing them with the data off the disk or remote storage.
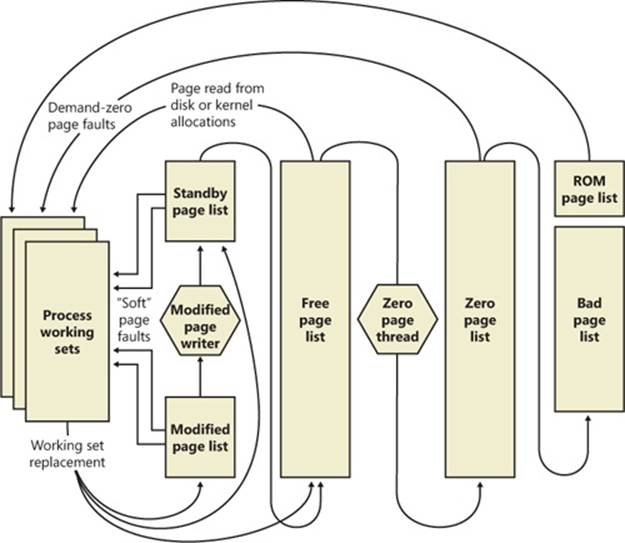
Figure 10-39. State diagram for page frames
The zero page list is populated from the free list by a system thread called the zero page thread (thread 0 in the System process). The zero page thread waits on a gate object to signal it to go to work. When the free list has eight or more pages, this gate is signaled. However, the zero page thread will run only if at least one processor has no other threads running, because the zero page thread runs at priority 0 and the lowest priority that a user thread can be set to is 1.
NOTE
Because the zero page thread actually waits on an event dispatcher object, it receives a priority boost (see the section “Priority Boosts” in Chapter 5 in Part 1), which results in it executing at priority 1 for at least part of the time. This is a bug in the current implementation.
NOTE
When memory needs to be zeroed as a result of a physical page allocation by a driver that calls MmAllocatePagesForMdl or MmAllocatePagesForMdlEx, by a Windows application that calls AllocateUserPhysicalPages or AllocateUserPhysicalPagesNuma, or when an application allocates large pages, the memory manager zeroes the memory by using a higher performing function called MiZeroInParallel that maps larger regions than the zero page thread, which only zeroes a page at a time. In addition, on multiprocessor systems, the memory manager creates additional system threads to perform the zeroing in parallel (and in a NUMA-optimized fashion on NUMA platforms).
§ When the memory manager doesn’t require a zero-initialized page, it goes first to the free list. If that’s empty, it goes to the zeroed list. If the zeroed list is empty, it goes to the standby lists. Before the memory manager can use a page frame from the standby lists, it must first backtrack and remove the reference from the invalid PTE (or prototype PTE) that still points to the page frame. Because entries in the PFN database contain pointers back to the previous user’s page table page (or to a page of prototype PTE pool for shared pages), the memory manager can quickly find the PTE and make the appropriate change.
§ When a process has to give up a page out of its working set (either because it referenced a new page and its working set was full or the memory manager trimmed its working set), the page goes to the standby lists if the page was clean (not modified) or to the modified list if the page was modified while it was resident.
§ When a process exits, all the private pages go to the free list. Also, when the last reference to a page-file-backed section is closed, and the section has no remaining mapped views, these pages also go to the free list.
EXPERIMENT: THE FREE AND ZERO PAGE LISTS
You can observe the release of private pages at process exit with Process Explorer’s System Information display. Begin by creating a process with a large number of private pages in its working set. We did this in an earlier experiment with the TestLimit utility:
C:\temp>testlimit -d 1 -c 800
Testlimit v5.1 - test Windows limits
Copyright (C) 2012 Mark Russinovich
Sysinternals - wwww.sysinternals.com
Leaking private bytes 1 MB at a time ...
Leaked 800 MB of private memory (800 MB total leaked). Lasterror: 0
The operation completed successfully.
The –d option causes TestLimit to not only allocate the memory as private committed, but to “touch” it—that is, to access it. This causes physical memory to be allocated and assigned to the process to realize the area of private committed virtual memory. If there is sufficient available RAM on the system, the entire 800 MB should be in RAM for the process.
This process will now wait until you cause it to exit or terminate (perhaps by using Ctrl+C in its command window). Open Process Explorer and select View, System Information. Observe the Free and Zeroed list sizes.
Now terminate or exit the TestLimit process. You may see the free page list briefly increase in size:
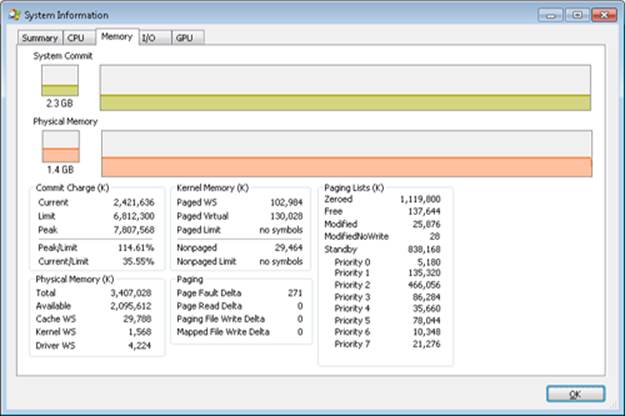
We say “may” because the zero page thread is awakened as soon as there are only eight pages on the zero list, and it acts very quickly. Notice that in this example, we freed 800 MB of private memory but only about 138 MB appear here on the free list. Process Explorer updates this display only once per second, and it is likely that the rest of the pages were already zeroed and moved to the zeroed page list before it happened to “catch” this state.
If you are able to see the temporary increase in the free list, you will then see it drop to zero, and a corresponding increase will occur in the zeroed page list. If not, you will simply see the increase in the zeroed list.
EXPERIMENT: THE MODIFIED AND STANDBY PAGE LISTS
The movement of pages from process working set to the modified page list and then to the standby page list can also be observed with the Sysinternals tools VMMap and RAMMap and the live kernel debugger.
The first step is to open RAMMap and observe the state of the quiet system:
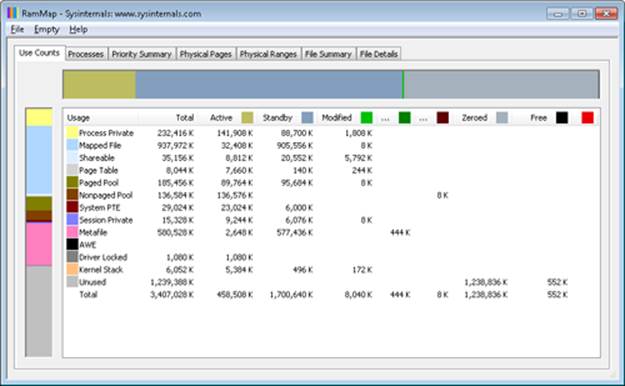
This is an x86 system with about 3.4 GB of RAM usable by Windows. The columns in this display represent the various page states shown in Figure 10-39. (A few of the columns not important to this discussion have been narrowed for ease of reference.)
The system has about 1.2 GB of RAM free (sum of the free and zeroed page lists). About 1,700 MB is on the standby list (hence part of “available,” but likely containing data recently lost from processes or being used by Superfetch). About 448 MB is “active,” being mapped directly to virtual addresses via valid page table entries.
Each row further breaks down into page state by usage or origin (process private, mapped file, and so on). For example, at the moment, of the active 448 MB, about 138 MB is due to process private allocations.
Now, as in the previous experiment, use the TestLimit utility to create a process with a large number of pages in its working set. Again we will use the –d option to cause TestLimit to write to each page, but this time we will use it without a limit, so as to create as many private modified pages as possible:
C:\Users\user1>testlimit -d
Testlimit v5.21 - test Windows limits
Copyright (C) 2012 Mark Russinovich
Sysinternals - www.sysinternals.com
Process ID: 1000
Leaking private bytes with touch (MB) ...
Leaked 2017 MB of private memory (2017 MB total leaked). Lasterror: 8
Not enough storage is available to process this command.
TestLimit has now created 2,017 allocations of 1 MB each.
In RAMMap, use the File, Refresh command to update the display (because of the cost of gathering its information, RAMMap does not update continuously).
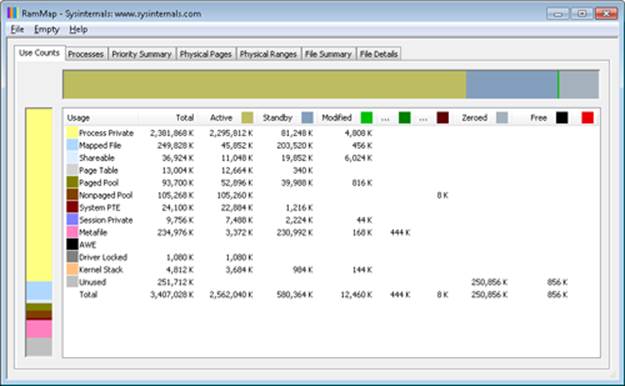
You will see that over 2 GB are now active and in the Process Private row. This is due to the memory allocated and accessed by the TestLimit process. Note also that the standby, zeroed, and free lists are now much smaller. Most of the RAM allocated to TestLimit came from these lists.
Next, in RAMMap, check the process’s physical page allocations. Change to the Physical Pages tab, and set the filter at the bottom to the column Process and the value Testlimit.exe. This display shows all the physical pages that are part of the process working set.
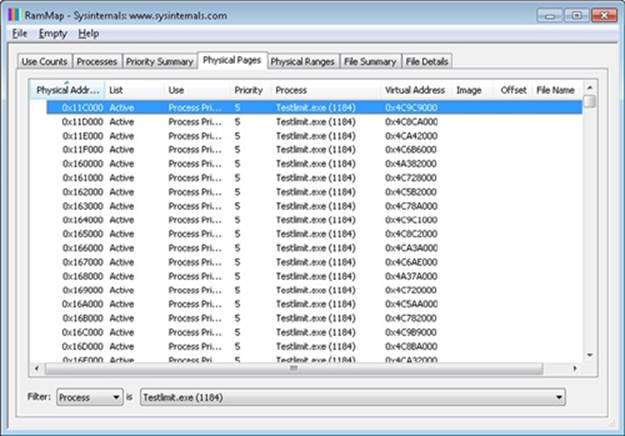
We would like to identify a physical page involved in the allocation of virtual address space done by TestLimit’s –d option. RAMMap does not give an indication about which virtual allocations are associated with RAMMap’s VirtualAlloc calls. However, we can get a good hint of this through the VMMap tool. Using VMMap on the same process, we find the following:
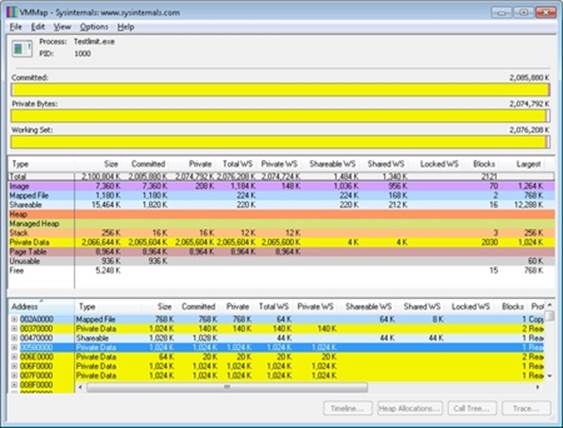
In the lower part of the display, we find hundreds of allocations of process private data, each 1 MB in size and with 1 MB committed. These match the size of the allocations done by TestLimit. The first of these is highlighted in the preceding screen shot. Note the starting virtual address, 0x580000.
Now go back to RAMMap’s physical memory display. Arrange the columns to make the Virtual Address column easily visible, click on it to sort by that value, and you can find that virtual address:
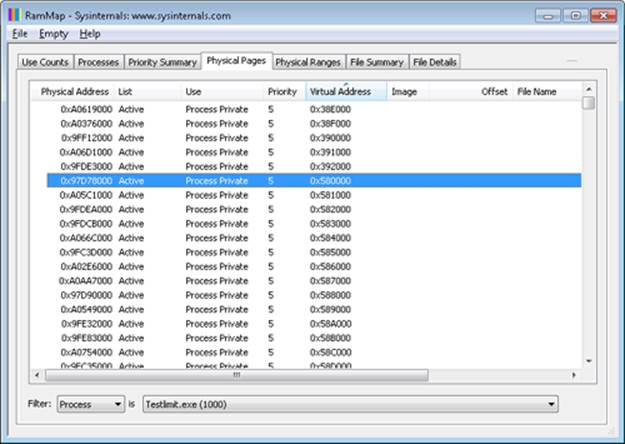
This shows that the virtual page starting at 0x01340000 is currently mapped to physical address 0x97D78000.
TestLimit’s –d option writes the program’s own name to the first bytes of each allocation. We can demonstrate this with the !dc (display characters using physical address) command in the local kernel debugger:
lkd> !dc 0x97d78000
#97d78000 74736554 696d694c 00000074 00000000 TestLimit.......
#97d78010 00000000 00000000 00000000 00000000 ................
#97d78020 00000000 00000000 00000000 00000000 ................
...
For the final leg of the experiment, we will demonstrate that this data remains intact (for a while, anyway) after the process working set is reduced and this page is moved to the modified and then the standby page list.
In VMMap, having selected the TestLimit process, use the View, Empty Working Set command to reduce the process’s working set to the bare minimum. VMMap’s display should now look like this:
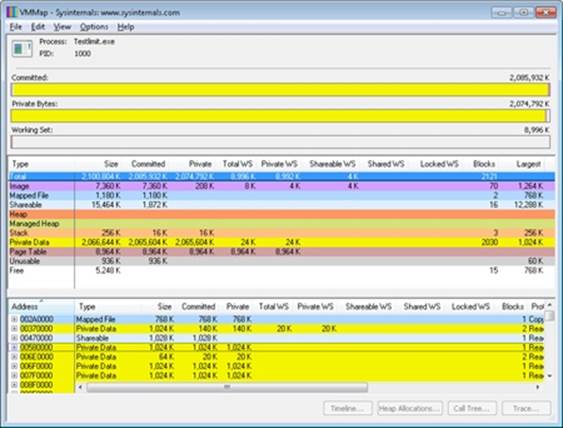
Notice that the Working Set bar graph is practically empty. In the middle section, the process shows a total working set of only 9 MB, and almost all of it is in page tables, with a tiny 32 KB total paged in of image files and private data. Now return to RAMMap. On the Use Counts tab, you will find that active pages have been reduced tremendously, with a large number of pages on the modified list and a significant number on the standby list:
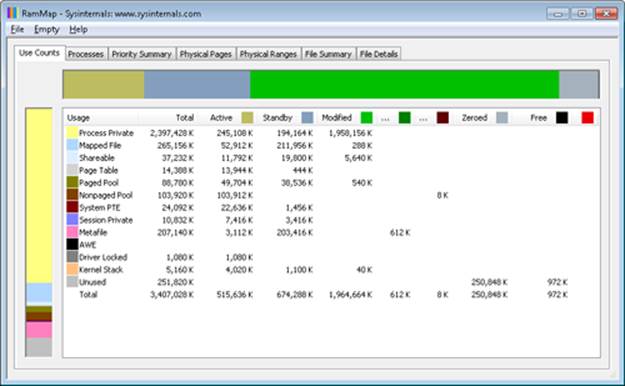
RAMMap’s Processes tab confirms that the TestLimit process contributed most of those pages to those lists:
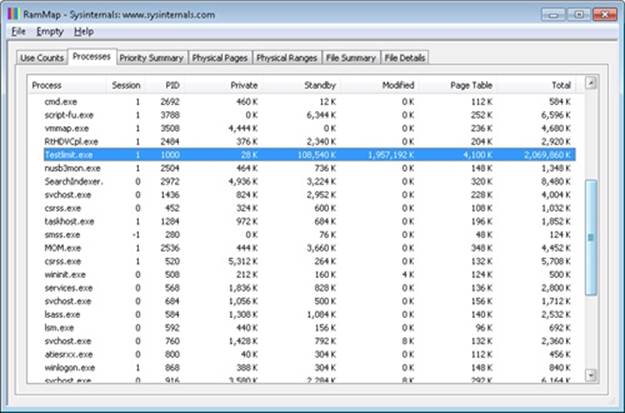
Still in RAMMap, show the Physical Pages tab. Sort by Physical Address, and find the page previously examined (in this case, physical address 0xc09fa000). RAMMap will almost certainly show that it is on the standby or modified list.
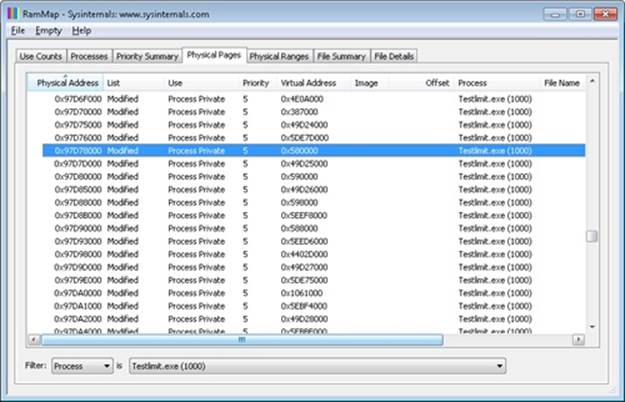
Note that the page is still associated with the TestLimit process and with its virtual address.
Finally, we can again use the kernel debugger to verify the page has not been overwritten:
lkd> !dc 0x97d78000
#97d78000 74736554 696d694c 00000074 00000000 TestLimit.......
#97d78010 00000000 00000000 00000000 00000000 ................
#97d78020 00000000 00000000 00000000 00000000 ................
...
We can also use the local kernel debugger to show the page frame number, or PFN, entry for the page. (The PFN database is described earlier in the chapter.)
lkd> !pfn 97d78
PFN 00097D78 at address 84E9B920
flink 000A0604 blink / share count 000A05C1 pteaddress C0002C00
reference count 0000 Cached color 0 Priority 5
restore pte 00000080 containing page 097D60 Modified M
Modified
Note that the page is still associated with the TestLimit process and with its virtual address.
Page Priority
Every physical page in the system has a page priority value assigned to it by the memory manager. The page priority is a number in the range 0 to 7. Its main purpose is to determine the order in which pages are consumed from the standby list. The memory manager divides the standby list into eight sublists that each store pages of a particular priority. When the memory manager wants to take a page from the standby list, it takes pages from low-priority lists first, as shown in Figure 10-40.
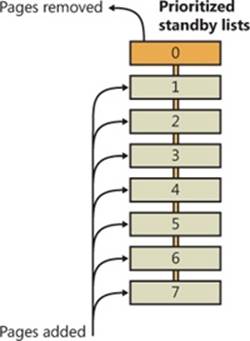
Figure 10-40. Prioritized standby lists
Each thread and process in the system is also assigned a page priority. A page’s priority usually reflects the page priority of the thread that first causes its allocation. (If the page is shared, it reflects the highest page priority among the sharing threads.) A thread inherits its page-priority value from the process to which it belongs. The memory manager uses low priorities for pages it reads from disk speculatively when anticipating a process’s memory accesses.
By default, processes have a page-priority value of 5, but functions allow applications and the system to change process and thread page-priority values. You can look at the memory priority of a thread with Process Explorer (per-page priority can be displayed by looking at the PFN entries, as you’ll see in an experiment later in the chapter). Figure 10-41 shows Process Explorer’s Threads tab displaying information about Winlogon’s main thread. Although the thread priority itself is high, the memory priority is still the standard 5.
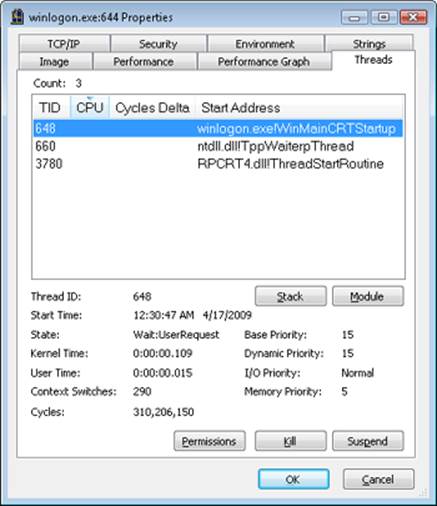
Figure 10-41. Process Explorer’s Threads tab.
The real power of memory priorities is realized only when the relative priorities of pages are understood at a high level, which is the role of Superfetch, covered at the end of this chapter.
EXPERIMENT: VIEWING THE PRIORITIZED STANDBY LISTS
You can use the MemInfo tool from Winsider Seminars & Solutions to dump the size of each standby paging list by using the –c flag. MemInfo will also display the number of repurposed pages for each standby list—this corresponds to the number of pages in each list that had to be reused to satisfy a memory allocation, and thus thrown out of the standby page lists. The following is the relevant output from the following command.
C:\Windows\system32>meminfo -c
MemInfo v2.10 - Show PFN database information
Copyright (C) 2007-2009 Alex Ionescu
www.alex-ionescu.com
Initializing PFN Database... Done
Priority Standby Repurposed
0 - Idle 0 ( 0 KB) 0 ( 0 KB)
1 - Very Low 41352 ( 165408 KB) 0 ( 0 KB)
2 - Low 7201 ( 28804 KB) 0 ( 0 KB)
3 - Background 2043 ( 8172 KB) 0 ( 0 KB)
4 - Background 24715 ( 98860 KB) 0 ( 0 KB)
5 - Normal 7895 ( 31580 KB) 0 ( 0 KB)
6 - Superfetch 23877 ( 95508 KB) 0 ( 0 KB)
7 - Superfetch 8435 ( 33740 KB) 0 ( 0 KB)
TOTAL 115518 ( 462072 KB) 0 ( 0 KB)
You can add the –i flag to MemInfo to continuously display the state of the standby page lists and repurpose counts, which is useful for tracking memory usage as well as the following experiment. Additionally, the System Information panel in Process Explorer (choose View, System Information) can also be used to display the live state of the prioritized standby lists, as shown in this screen shot:
On the recently started x64 system used in this experiment (see the previous MemInfo output), there is no data cached at priority 0, about 165 MB at priority 1, and about 29 MB at priority 2. Your system probably has some data in those priorities as well.
The following shows what happens when we use the TestLimit tool from Sysinternals to commit and touch 1 GB of memory. Here is the command you use (to leak and touch memory in 20 chunks of 50 MB):
testlimit -d 50 -c 20
Here is the output of MemInfo just before the run:
Priority Standby Repurposed
0 - Idle 0 ( 0 KB) 2554 ( 10216 KB)
1 - Very Low 92915 ( 371660 KB) 141352 ( 565408 KB)
2 - Low 35783 ( 143132 KB) 0 ( 0 KB)
3 - Background 50666 ( 202664 KB) 0 ( 0 KB)
4 - Background 15236 ( 60944 KB) 0 ( 0 KB)
5 - Normal 34197 ( 136788 KB) 0 ( 0 KB)
6 - Superfetch 2912 ( 11648 KB) 0 ( 0 KB)
7 - Superfetch 5876 ( 23504 KB) 0 ( 0 KB)
TOTAL 237585 ( 950340 KB) 143906 ( 575624 KB)
And here is the output after the allocations are done but the TestLimit process still exists:
Priority Standby Repurposed
0 - Idle 0 ( 0 KB) 2554 ( 10216 KB)
1 - Very Low 5 ( 20 KB) 234351 ( 937404 KB)
2 - Low 0 ( 0 KB) 35830 ( 143320 KB)
3 - Background 9586 ( 38344 KB) 41654 ( 166616 KB)
4 - Background 15371 ( 61484 KB) 0 ( 0 KB)
5 - Normal 34208 ( 136832 KB) 0 ( 0 KB)
6 - Superfetch 2914 ( 11656 KB) 0 ( 0 KB)
7 - Superfetch 5881 ( 23524 KB) 0 ( 0 KB)
TOTAL 67965 ( 271860 KB) 314389 (1257556 KB)
Note how the lower-priority standby page lists were used first (shown by the repurposed count) and are now depleted, while the higher lists still contain valuable cached data.
Modified Page Writer
The memory manager employs two system threads to write pages back to disk and move those pages back to the standby lists (based on their priority). One system thread writes out modified pages (MiModifiedPageWriter) to the paging file, and a second one writes modified pages tomapped files (MiMappedPageWriter). Two threads are required to avoid creating a deadlock, which would occur if the writing of mapped file pages caused a page fault that in turn required a free page when no free pages were available (thus requiring the modified page writer to create more free pages). By having the modified page writer perform mapped file paging I/Os from a second system thread, that thread can wait without blocking regular page file I/O.
Both threads run at priority 17, and after initialization they wait for separate objects to trigger their operation. The mapped page writer waits on an event, MmMappedPageWriterEvent. It can be signaled in the following cases:
§ During a page list operation (MiInsertPageInLockedList or MiInsertPageInList). These routines signal this event if the number of file-system-destined pages on the modified page list has reached more than 800 and the number of available pages has fallen below 1,024, or if the number of available pages is less than 256.
§ In an attempt to obtain free pages (MiObtainFreePages).
§ By the memory manager’s working set manager (MmWorkingSetManager), which runs as part of the kernel’s balance set manager (once every second). The working set manager signals this event if the number of file-system-destined pages on the modified page list has reached more than 800.
§ Upon a request to flush all modified pages (MmFlushAllPages).
§ Upon a request to flush all file-system-destined modified pages (MmFlushAllFilesystemPages). Note that in most cases, writing modified mapped pages to their backing store files does not occur if the number of mapped pages on the modified page list is less than the maximum “write cluster” size, which is 16 pages. This check is not made in MmFlushAllFilesystemPages or MmFlushAllPages.
The mapped page writer also waits on an array of MiMappedPageListHeadEvent events associated with the 16 mapped page lists. Each time a mapped page is dirtied, it is inserted into one of these 16 mapped page lists based on a bucket number (MiCurrentMappedPageBucket). This bucket number is updated by the working set manager whenever the system considers that mapped pages have gotten old enough, which is currently 100 seconds (the MiWriteGapCounter variable controls this and is incremented whenever the working set manager runs). The reason for these additional events is to reduce data loss in the case of a system crash or power failure by eventually writing out modified mapped pages even if the modified list hasn’t reached its threshold of 800 pages.
The modified page writer waits on a single gate object (MmModifiedPageWriterGate), which can be signaled in the following scenarios:
§ A request to flush all pages has been received.
§ The number of available pages (MmAvailablePages) drops below 128 pages.
§ The total size of the zeroed and free page lists has dropped below 20,000 pages, and the number of modified pages destined for the paging file is greater than the smaller of one-sixteenth of the available pages or 64 MB (16,384 pages).
§ When a working set is being trimmed to accommodate additional pages, if the number of pages available is less than 15,000.
§ During a page list operation (MiInsertPageInLockedList or MiInsertPageInList). These routines signal this gate if the number of page-file-destined pages on the modified page list has reached more than 800 and the number of available pages has fallen below 1,024, or if the number of available pages is less than 256.
Additionally, the modified page writer waits on an event (MiRescanPageFilesEvent) and an internal event in the paging file header (MmPagingFileHeader), which allows the system to manually request flushing out data to the paging file when needed.
When invoked, the mapped page writer attempts to write as many pages as possible to disk with a single I/O request. It accomplishes this by examining the original PTE field of the PFN database elements for pages on the modified page list to locate pages in contiguous locations on the disk. Once a list is created, the pages are removed from the modified list, an I/O request is issued, and, at successful completion of the I/O request, the pages are placed at the tail of the standby list corresponding to their priority.
Pages that are in the process of being written can be referenced by another thread. When this happens, the reference count and the share count in the PFN entry that represents the physical page are incremented to indicate that another process is using the page. When the I/O operation completes, the modified page writer notices that the reference count is no longer 0 and doesn’t place the page on any standby list.
PFN Data Structures
Although PFN database entries are of fixed length, they can be in several different states, depending on the state of the page. Thus, individual fields have different meanings depending on the state. Figure 10-42 shows the formats of PFN entries for different states.
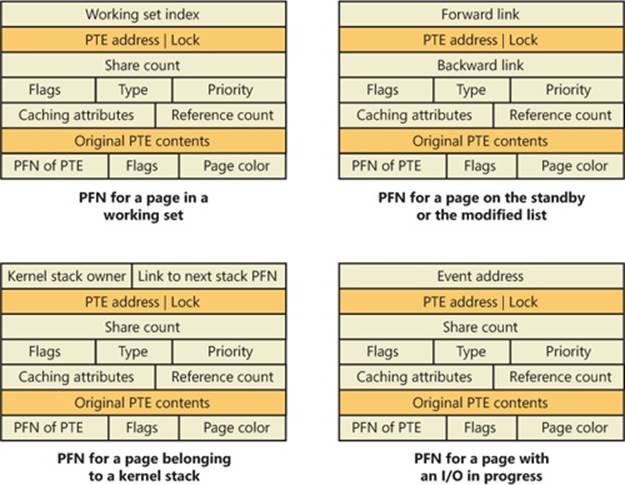
Figure 10-42. States of PFN database entries. (Specific layouts are conceptual)
Several fields are the same for several PFN types, but others are specific to a given type of PFN. The following fields appear in more than one PFN type:
§ PTE address Virtual address of the PTE that points to this page. Also, since PTE addresses will always be aligned on a 4-byte boundary (8 bytes on 64-bit systems), the two low-order bits are used as a locking mechanism to serialize access to the PFN entry.
§ Reference count The number of references to this page. The reference count is incremented when a page is first added to a working set and/or when the page is locked in memory for I/O (for example, by a device driver). The reference count is decremented when the share count becomes 0 or when pages are unlocked from memory. When the share count becomes 0, the page is no longer owned by a working set. Then, if the reference count is also zero, the PFN database entry that describes the page is updated to add the page to the free, standby, ormodified list.
§ Type The type of page represented by this PFN. (Types include active/valid, standby, modified, modified-no-write, free, zeroed, bad, and transition.)
§ Flags The information contained in the flags field is shown in Table 10-17.
§ Priority The priority associated with this PFN, which will determine on which standby list it will be placed.
§ Original PTE contents All PFN database entries contain the original contents of the PTE that pointed to the page (which could be a prototype PTE). Saving the contents of the PTE allows it to be restored when the physical page is no longer resident. PFN entries for AWE allocations are exceptions; they store the AWE reference count in this field instead.
§ PFN of PTE Physical page number of the page table page containing the PTE that points to this page.
§ Color Besides being linked together on a list, PFN database entries use an additional field to link physical pages by “color,” which is the page’s NUMA node number.
§ Flags A second flags field is used to encode additional information on the PTE. These flags are described in Table 10-18.
Table 10-17. Flags Within PFN Database Entries
|
Flag |
Meaning |
|
Write in progress |
Indicates that a page write operation is in progress. The first DWORD contains the address of the event object that will be signaled when the I/O is complete. |
|
Modified state |
Indicates whether the page was modified. (If the page was modified, its contents must be saved to disk before removing it from memory.) |
|
Read in progress |
Indicates that an in-page operation is in progress for the page. The first DWORD contains the address of the event object that will be signaled when the I/O is complete. |
|
Rom |
Indicates that this page comes from the computer’s firmware or another piece of read-only memory such as a device register. |
|
In-page error |
Indicates that an I/O error occurred during the in-page operation on this page. (In this case, the first field in the PFN contains the error code.) |
|
Kernel stack |
Indicates that this page is being used to contain a kernel stack. In this case, the PFN entry contains the owner of the stack and the next stack PFN for this thread. |
|
Removal requested |
Indicates that the page is the target of a remove (due to ECC/scrubbing or hot memory removal). |
|
Parity error |
Indicates that the physical page contains parity or error correction control errors. |
Table 10-18. Secondary Flags Within PFN Database Entries
|
Flag |
Meaning |
|
PFN image verified |
The code signature for this PFN (contained in the cryptographic signature catalog for the image being backed by this PFN) has been verified. |
|
AWE allocation |
This PFN backs an AWE allocation. |
|
Prototype PTE |
Indicates that the PTE referenced by the PFN entry is a prototype PTE. (For example, this page is shareable.) |
The remaining fields are specific to the type of PFN. For example, the first PFN in Figure 10-42 represents a page that is active and part of a working set. The share count field represents the number of PTEs that refer to this page. (Pages marked read-only, copy-on-write, or shared read/write can be shared by multiple processes.) For page table pages, this field is the number of valid and transition PTEs in the page table. As long as the share count is greater than 0, the page isn’t eligible for removal from memory.
The working set index field is an index into the process working set list (or the system or session working set list, or zero if not in any working set) where the virtual address that maps this physical page resides. If the page is a private page, the working set index field refers directly to the entry in the working set list because the page is mapped only at a single virtual address. In the case of a shared page, the working set index is a hint that is guaranteed to be correct only for the first process that made the page valid. (Other processes will try to use the same index where possible.) The process that initially sets this field is guaranteed to refer to the proper index and doesn’t need to add a working set list hash entry referenced by the virtual address into its working set hash tree. This guarantee reduces the size of the working set hash tree and makes searches faster for these particular direct entries.
The second PFN in Figure 10-42 is for a page on either the standby or the modified list. In this case, the forward and backward link fields link the elements of the list together within the list. This linking allows pages to be easily manipulated to satisfy page faults. When a page is on one of the lists, the share count is by definition 0 (because no working set is using the page) and therefore can be overlaid with the backward link. The reference count is also 0 if the page is on one of the lists. If it is nonzero (because an I/O could be in progress for this page—for example, when the page is being written to disk), it is first removed from the list.
The third PFN in Figure 10-42 is for a page that belongs to a kernel stack. As mentioned earlier, kernel stacks in Windows are dynamically allocated, expanded, and freed whenever a callback to user mode is performed and/or returns, or when a driver performs a callback and requests stack expansion. For these PFNs, the memory manager must keep track of the thread actually associated with the kernel stack, or if it is free it keeps a link to the next free look-aside stack.
The fourth PFN in Figure 10-42 is for a page that has an I/O in progress (for example, a page read). While the I/O is in progress, the first field points to an event object that will be signaled when the I/O completes. If an in-page error occurs, this field contains the Windows error status code representing the I/O error. This PFN type is used to resolve collided page faults.
In addition to the PFN database, the system variables in Table 10-19 describe the overall state of physical memory.
Table 10-19. System Variables That Describe Physical Memory
|
Variable |
Description |
|
MmNumberOfPhysicalPages |
Total number of physical pages available on the system |
|
MmAvailablePages |
Total number of available pages on the system—the sum of the pages on the zeroed, free, and standby lists |
|
MmResidentAvailablePages |
Total number of physical pages that would be available if every process was trimmed to its minimum working set size and all modified pages were flushed to disk |
EXPERIMENT: VIEWING PFN ENTRIES
You can examine individual PFN entries with the kernel debugger !pfn command. You need to supply the PFN as an argument. (For example, !pfn 1 shows the first entry, !pfn 2 shows the second, and so on.) In the following example, the PTE for virtual address 0x50000 is displayed, followed by the PFN that contains the page directory, and then the actual page:
lkd> !pte 50000
VA 00050000
PDE at 00000000C0600000 PTE at 00000000C0000280
contains 000000002C9F7867 contains 800000002D6C1867
pfn 2c9f7 ---DA--UWEV pfn 2d6c1 ---DA--UW-V
lkd> !pfn 2c9f7
PFN 0002C9F7 at address 834E1704
flink 00000026 blink / share count 00000091 pteaddress C0600000
reference count 0001 Cached color 0 Priority 5
restore pte 00000080 containing page 02BAA5 Active M
Modified
lkd> !pfn 2d6c1
PFN 0002D6C1 at address 834F7D1C
flink 00000791 blink / share count 00000001 pteaddress C0000280
reference count 0001 Cached color 0 Priority 5
restore pte 00000080 containing page 02C9F7 Active M
Modified
You can also use the MemInfo tool to obtain information about a PFN. MemInfo can sometimes give you more information than the debugger’s output, and it does not require being booted into debugging mode. Here’s MemInfo’s output for those same two PFNs:
C:\>meminfo -p 2c9f7
PFN: 2c9f7
PFN List: Active and Valid
PFN Type: Page Table
PFN Priority: 5
Page Directory: 0x866168C8
Physical Address: 0x2C9F7000
C:\>meminfo -p 2d6c1
PFN: 2d6c1
PFN List: Active and Valid
PFN Type: Process Private
PFN Priority: 5
EPROCESS: 0x866168C8 [windbg.exe]
Physical Address: 0x2D6C1000
MemInfo correctly recognized that the first PFN was a page table and that the second PFN belongs to WinDbg, which was the active process when the !pte 50000 command was used in the debugger.
Physical Memory Limits
Now that you’ve learned how Windows keeps track of physical memory, we’ll describe how much of it Windows can actually support. Because most systems access more code and data than can fit in physical memory as they run, physical memory is in essence a window into the code and data used over time. The amount of memory can therefore affect performance, because when data or code that a process or the operating system needs is not present, the memory manager must bring it in from disk or remote storage.
Besides affecting performance, the amount of physical memory impacts other resource limits. For example, the amount of nonpaged pool, operating system buffers backed by physical memory, is obviously constrained by physical memory. Physical memory also contributes to thesystem virtual memory limit, which is the sum of roughly the size of physical memory plus the current configured size of any paging files. Physical memory also can indirectly limit the maximum number of processes.
Windows support for physical memory is dictated by hardware limitations, licensing, operating system data structures, and driver compatibility. Table 10-20 lists the currently supported amounts of physical memory across the various editions of Windows along with the limiting factors.
Table 10-20. Physical Memory Support
|
Version |
32-Bit Limit |
64-Bit Limit |
Limiting Factors |
|
Ultimate, Enterprise, and Professional |
4 GB |
192 GB |
Licensing on 64-bit; licensing, hardware support, and driver compatibility on 32-bit |
|
Home Premium |
4 GB |
16 GB |
Licensing on 64-bit; licensing, hardware support, and driver compatibility on 32-bit |
|
Home Basic |
4 GB |
8 GB |
Licensing on 64-bit; licensing, hardware support, and driver compatibility on 32-bit |
|
Starter |
2 GB |
2 GB |
Licensing |
|
Server Datacenter, Enterprise, and Server for Itanium |
N/A |
2 TB |
Testing and available systems |
|
Server Foundation |
N/A |
8 GB |
Licensing |
|
Server Standard and Web Server |
N/A |
32 GB |
Licensing |
|
Server HPC Edition |
N/A |
128 GB |
Licensing |
The maximum 2-TB physical memory limit doesn’t come from any implementation or hardware limitation, but because Microsoft will support only configurations it can test. As of this writing, the largest tested and supported memory configuration was 2 TB.
Windows Client Memory Limits
64-bit Windows client editions support different amounts of memory as a differentiating feature, with the low end being 2 GB for Starter Edition, increasing to 192 GB for the Ultimate, Enterprise, and Professional editions. All 32-bit Windows client editions, however, support a maximum of 4 GB of physical memory, which is the highest physical address accessible with the standard x86 memory management mode.
Although client SKUs support PAE addressing modes on x86 systems in order to provide hardware no-execute protection (which would also enable access to more than 4 GB of physical memory), testing revealed that systems would crash, hang, or become unbootable because some device drivers, commonly those for video and audio devices found typically on clients but not servers, were not programmed to expect physical addresses larger than 4 GB. As a result, the drivers truncated such addresses, resulting in memory corruptions and corruption side effects. Server systems commonly have more generic devices, with simpler and more stable drivers, and therefore had not generally revealed these problems. The problematic client driver ecosystem led to the decision for client editions to ignore physical memory that resides above 4 GB, even though they can theoretically address it. Driver developers are encouraged to test their systems with the nolowmem BCD option, which will force the kernel to use physical addresses above 4 GB only if sufficient memory exists on the system to allow it. This will immediately lead to the detection of such issues in faulty drivers.
32-Bit Client Effective Memory Limits
While 4 GB is the licensed limit for 32-bit client editions, the effective limit is actually lower and dependent on the system’s chipset and connected devices. The reason is that the physical address map includes not only RAM but device memory, and x86 and x64 systems typically map all device memory below the 4 GB address boundary to remain compatible with 32-bit operating systems that don’t know how to handle addresses larger than 4 GB. Newer chipsets do support PAE-based device remapping, but client editions of Windows do not support this feature for the driver compatibility problems explained earlier (otherwise, drivers would receive 64-bit pointers to their device memory).
If a system has 4 GB of RAM and devices such as video, audio, and network adapters that implement windows into their device memory that sum to 500 MB, 500 MB of the 4 GB of RAM will reside above the 4 GB address boundary, as seen in Figure 10-43.
The result is that if you have a system with 3 GB or more of memory and you are running a 32-bit Windows client, you may not be getting the benefit of all of the RAM. You can see how much RAM Windows has detected as being installed in the System Properties dialog box, but to see how much memory is actually available to Windows, you need to look at Task Manager’s Performance page or the Msinfo32 and Winver utilities. On one particular 4-GB laptop, when booted with 32-bit Windows, the amount of physical memory available is 3.5 GB, as seen in the Msinfo32 utility:
|
Installed Physical Memory (RAM) |
4.00 GB |
|
Total Physical Memory |
3.50 GB |
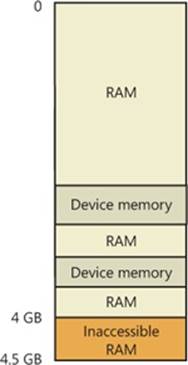
Figure 10-43. Physical memory layout on a 4-GB system
You can see the physical memory layout with the MemInfo tool from Winsider Seminars & Solutions. Figure 10-44 shows the output of MemInfo when run on a 32-bit system, using the –r switch to dump physical memory ranges:
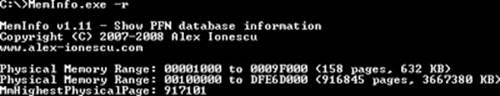
Figure 10-44. Memory ranges on a 32-bit Windows system
Note the gap in the memory address range from page 9F0000 to page 100000, and another gap from DFE6D000 to FFFFFFFF (4 GB). When the system is booted with 64-bit Windows, on the other hand, all 4 GB show up as available (see Figure 10-45), and you can see how Windows uses the remaining 500 MB of RAM that are above the 4-GB boundary.
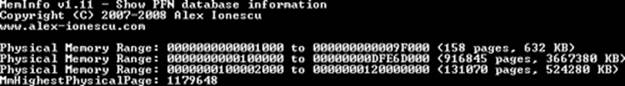
Figure 10-45. Memory ranges on an x64 Windows system
You can use Device Manager on your machine to see what is occupying the various reserved memory regions that can’t be used by Windows (and that will show up as holes in MemInfo’s output). To check Device Manager, run Devmgmt.msc, select Resources By Connection on the View menu, and then expand the Memory node. On the laptop computer used for the output shown in Figure 10-46, the primary consumer of mapped device memory is, unsurprisingly, the video card, which consumes 256 MB in the range E0000000-EFFFFFFF.
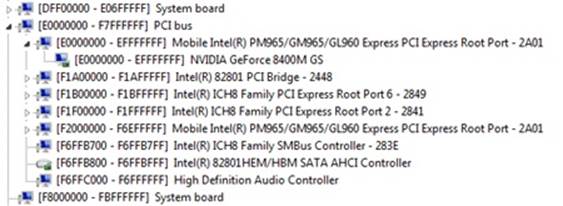
Figure 10-46. Hardware-reserved memory ranges on a 32-bit Windows system
Other miscellaneous devices account for most of the rest, and the PCI bus reserves additional ranges for devices as part of the conservative estimation the firmware uses during boot.
The consumption of memory addresses below 4 GB can be drastic on high-end gaming systems with large video cards. For example, on a test machine with 8 GB of RAM and two 1-GB video cards, only 2.2 GB of the memory was accessible by 32-bit Windows. A large memory hole from 8FEF0000 to FFFFFFFF is visible in the MemInfo output from the system on which 64-bit Windows is installed, shown in Figure 10-47.
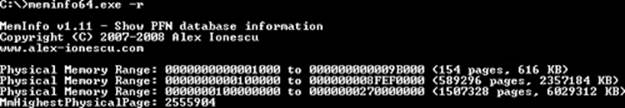
Figure 10-47. Memory ranges on a 64-bit Windows system
Device Manager revealed that 512 MB of the more than 2-GB gap is for the video cards (256 MB each) and that the PCI bus driver had reserved more either for dynamic mappings or alignment requirements, or perhaps because the devices claimed larger areas than they actually needed. Finally, even systems with as little as 2 GB can be prevented from having all their memory usable under 32-bit Windows because of chipsets that aggressively reserve memory regions for devices.
Working Sets
Now that we’ve looked at how Windows keeps track of physical memory, and how much memory it can support, we’ll explain how Windows keeps a subset of virtual addresses in physical memory.
As you’ll recall, the term used to describe a subset of virtual pages resident in physical memory is called a working set. There are three kinds of working sets:
§ Process working sets contain the pages referenced by threads within a single process.
§ System working sets contains the resident subset of the pageable system code (for example, Ntoskrnl.exe and drivers), paged pool, and the system cache.
§ Each session has a working set that contains the resident subset of the kernel-mode session-specific data structures allocated by the kernel-mode part of the Windows subsystem (Win32k.sys), session paged pool, session mapped views, and other session-space device drivers.
Before examining the details of each type of working set, let’s look at the overall policy for deciding which pages are brought into physical memory and how long they remain. After that, we’ll explore the various types of working sets.
Demand Paging
The Windows memory manager uses a demand-paging algorithm with clustering to load pages into memory. When a thread receives a page fault, the memory manager loads into memory the faulted page plus a small number of pages preceding and/or following it. This strategy attempts to minimize the number of paging I/Os a thread will incur. Because programs, especially large ones, tend to execute in small regions of their address space at any given time, loading clusters of virtual pages reduces the number of disk reads. For page faults that reference data pages in images, the cluster size is three pages. For all other page faults, the cluster size is seven pages.
However, a demand-paging policy can result in a process incurring many page faults when its threads first begin executing or when they resume execution at a later point. To optimize the startup of a process (and the system), Windows has an intelligent prefetch engine called thelogical prefetcher, described in the next section. Further optimization and prefetching is performed by another component, called Superfetch, that we’ll describe later in the chapter.
Logical Prefetcher
During a typical system boot or application startup, the order of faults is such that some pages are brought in from one part of a file, then perhaps from a distant part of the same file, then from a different file, perhaps from a directory, and then again from the first file. This jumping around slows down each access considerably and, thus, analysis shows that disk seek times are a dominant factor in slowing boot and application startup times. By prefetching batches of pages all at once, a more sensible ordering of access, without excessive backtracking, can be achieved, thus improving the overall time for system and application startup. The pages that are needed can be known in advance because of the high correlation in accesses across boots or application starts.
The prefetcher tries to speed the boot process and application startup by monitoring the data and code accessed by boot and application startups and using that information at the beginning of a subsequent boot or application startup to read in the code and data. When the prefetcher is active, the memory manager notifies the prefetcher code in the kernel of page faults, both those that require that data be read from disk (hard faults) and those that simply require data already in memory be added to a process’s working set (soft faults). The prefetcher monitors the first 10 seconds of application startup. For boot, the prefetcher by default traces from system start through the 30 seconds following the start of the user’s shell (typically Explorer) or, failing that, up through 60 seconds following Windows service initialization or through 120 seconds, whichever comes first.
The trace assembled in the kernel notes faults taken on the NTFS master file table (MFT) metadata file (if the application accesses files or directories on NTFS volumes), on referenced files, and on referenced directories. With the trace assembled, the kernel prefetcher code waits for requests from the prefetcher component of the Superfetch service (%SystemRoot%\System32\Sysmain.dll), running in a copy of Svchost. The Superfetch service is responsible for both the logical prefetching component in the kernel and for the Superfetch component that we’ll talk about later. The prefetcher signals the event \KernelObjects\PrefetchTracesReady to inform the Superfetch service that it can now query trace data.
NOTE
You can enable or disable prefetching of the boot or application startups by editing the DWORD registry value HKLM\SYSTEM\CurrentControlSet\Control\Session Manager\Memory Management\PrefetchParameters\EnablePrefetcher. Set it to 0 to disable prefetching altogether, 1 to enable prefetching of only applications, 2 for prefetching of boot only, and 3 for both boot and applications.
The Superfetch service (which hosts the logical prefetcher, although it is a completely separate component from the actual Superfetch functionality) performs a call to the internal NtQuerySystemInformation system call requesting the trace data. The logical prefetcher post-processes the trace data, combining it with previously collected data, and writes it to a file in the %SystemRoot%\Prefetch folder, which is shown in Figure 10-48. The file’s name is the name of the application to which the trace applies followed by a dash and the hexadecimal representation of a hash of the file’s path. The file has a .pf extension; an example would be NOTEPAD.EXE-AF43252301.PF.
There are two exceptions to the file name rule. The first is for images that host other components, including the Microsoft Management Console (%SystemRoot%\System32\Mmc.exe), the Service Hosting Process (%SystemRoot%\System32\Svchost.exe), the Run DLL Component (%SystemRoot%\System32\Rundll32.exe), and Dllhost (%SystemRoot%\System32\Dllhost.exe). Because add-on components are specified on the command line for these applications, the prefetcher includes the command line in the generated hash. Thus, invocations of these applications with different components on the command line will result in different traces.
The other exception to the file name rule is the file that stores the boot’s trace, which is always named NTOSBOOT-B00DFAAD.PF. (If read as a word, “boodfaad” sounds similar to the English words boot fast.) Only after the prefetcher has finished the boot trace (the time of which was defined earlier) does it collect page fault information for specific applications.
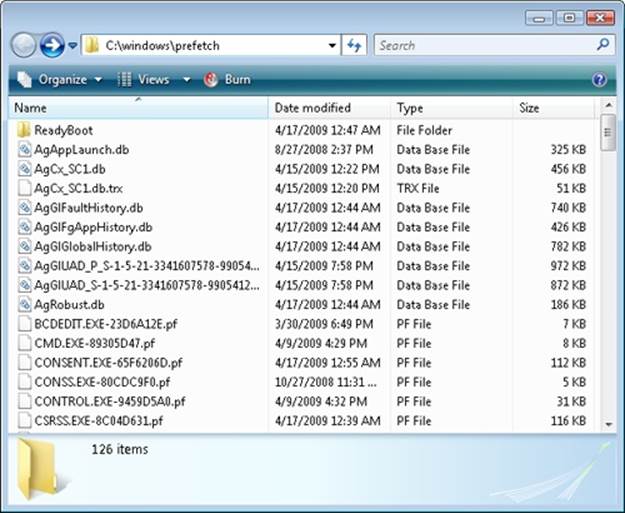
Figure 10-48. Prefetch folder
EXPERIMENT: LOOKING INSIDE A PREFETCH FILE
A prefetch file’s contents serve as a record of files and directories accessed during the boot or an application startup, and you can use the Strings utility from Sysinternals to see the record. The following command lists all the files and directories referenced during the last boot:
C:\Windows\Prefetch>Strings -n 5 ntosboot-b00dfaad.pf
Strings v2.4
Copyright (C) 1999-2007 Mark Russinovich
Sysinternals - www.sysinternals.com
4NTOSBOOT
\DEVICE\HARDDISKVOLUME1\$MFT
\DEVICE\HARDDISKVOLUME1\WINDOWS\SYSTEM32\DRIVERS\TUNNEL.SYS
\DEVICE\HARDDISKVOLUME1\WINDOWS\SYSTEM32\DRIVERS\TUNMP.SYS
\DEVICE\HARDDISKVOLUME1\WINDOWS\SYSTEM32\DRIVERS\I8042PRT.SYS
\DEVICE\HARDDISKVOLUME1\WINDOWS\SYSTEM32\DRIVERS\KBDCLASS.SYS
\DEVICE\HARDDISKVOLUME1\WINDOWS\SYSTEM32\DRIVERS\VMMOUSE.SYS
\DEVICE\HARDDISKVOLUME1\WINDOWS\SYSTEM32\DRIVERS\MOUCLASS.SYS
\DEVICE\HARDDISKVOLUME1\WINDOWS\SYSTEM32\DRIVERS\PARPORT.SYS
...
When the system boots or an application starts, the prefetcher is called to give it an opportunity to perform prefetching. The prefetcher looks in the prefetch directory to see if a trace file exists for the prefetch scenario in question. If it does, the prefetcher calls NTFS to prefetch any MFT metadata file references, reads in the contents of each of the directories referenced, and finally opens each file referenced. It then calls the memory manager function MmPrefetchPages to read in any data and code specified in the trace that’s not already in memory. The memory manager initiates all the reads asynchronously and then waits for them to complete before letting an application’s startup continue.
EXPERIMENT: WATCHING PREFETCH FILE READS AND WRITES
If you capture a trace of application startup with Process Monitor from Sysinternals on a client edition of Windows (Windows Server editions disable prefetching by default), you can see the prefetcher check for and read the application’s prefetch file (if it exists), and roughly 10 seconds after the application started, see the prefetcher write out a new copy of the file. Here is a capture of Notepad startup with an Include filter set to “prefetch” so that Process Monitor shows only accesses to the %SystemRoot%\Prefetch directory:
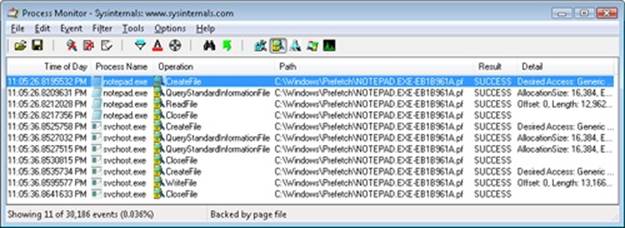
Lines 1 through 4 show the Notepad prefetch file being read in the context of the Notepad process during its startup. Lines 5 through 11, which have time stamps 10 seconds later than the first three lines, show the Superfetch service, which is running in the context of a Svchost process, write out the updated prefetch file.
To minimize seeking even further, every three days or so, during system idle periods, the Superfetch service organizes a list of files and directories in the order that they are referenced during a boot or application start and stores the list in a file named %SystemRoot%\Prefetch\Layout.ini, shown in Figure 10-49. This list also includes frequently accessed files tracked by Superfetch.
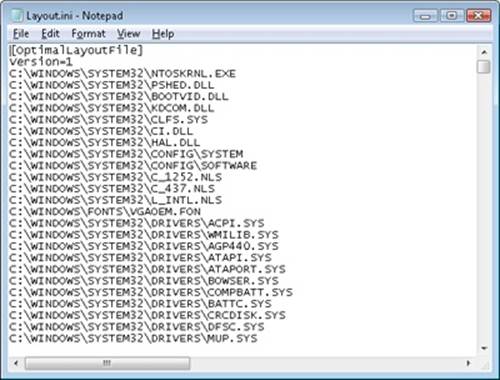
Figure 10-49. Prefetch defragmentation layout file
Then it launches the system defragmenter with a command-line option that tells the defragmenter to defragment based on the contents of the file instead of performing a full defrag. The defragmenter finds a contiguous area on each volume large enough to hold all the listed files and directories that reside on that volume and then moves them in their entirety into the area so that they are stored one after the other. Thus, future prefetch operations will even be more efficient because all the data read in is now stored physically on the disk in the order it will be read. Because the files defragmented for prefetching usually number only in the hundreds, this defragmentation is much faster than full volume defragmentations. (See Chapter 12 for more information on defragmentation.)
Placement Policy
When a thread receives a page fault, the memory manager must also determine where in physical memory to put the virtual page. The set of rules it uses to determine the best position is called a placement policy. Windows considers the size of CPU memory caches when choosing page frames to minimize unnecessary thrashing of the cache.
If physical memory is full when a page fault occurs, a replacement policy is used to determine which virtual page must be removed from memory to make room for the new page. Common replacement policies include least recently used (LRU) and first in, first out (FIFO). The LRU algorithm (also known as the clock algorithm, as implemented in most versions of UNIX) requires the virtual memory system to track when a page in memory is used. When a new page frame is required, the page that hasn’t been used for the greatest amount of time is removed from the working set. The FIFO algorithm is somewhat simpler; it removes the page that has been in physical memory for the greatest amount of time, regardless of how often it’s been used.
Replacement policies can be further characterized as either global or local. A global replacement policy allows a page fault to be satisfied by any page frame, whether or not that frame is owned by another process. For example, a global replacement policy using the FIFO algorithm would locate the page that has been in memory the longest and would free it to satisfy a page fault; a local replacement policy would limit its search for the oldest page to the set of pages already owned by the process that incurred the page fault. Global replacement policies make processes vulnerable to the behavior of other processes—an ill-behaved application can undermine the entire operating system by inducing excessive paging activity in all processes.
Windows implements a combination of local and global replacement policy. When a working set reaches its limit and/or needs to be trimmed because of demands for physical memory, the memory manager removes pages from working sets until it has determined there are enough free pages.
Working Set Management
Every process starts with a default working set minimum of 50 pages and a working set maximum of 345 pages. Although it has little effect, you can change the process working set limits with the Windows SetProcessWorkingSetSize function, though you must have the “increase scheduling priority” user right to do this. However, unless you have configured the process to use hard working set limits, these limits are ignored, in that the memory manager will permit a process to grow beyond its maximum if it is paging heavily and there is ample memory (and conversely, the memory manager will shrink a process below its working set minimum if it is not paging and there is a high demand for physical memory on the system). Hard working set limits can be set using the SetProcessWorkingSetSizeEx function along with theQUOTA_LIMITS_HARDWS_MIN_ENABLE flag, but it is almost always better to let the system manage your working set instead of setting your own hard working set minimums.
The maximum working set size can’t exceed the systemwide maximum calculated at system initialization time and stored in the kernel variable MiMaximumWorkingSet, which is a hard upper limit based on the working set maximums listed in Table 10-21.
Table 10-21. Upper Limit for Working Set Maximums
|
Windows Version |
Working Set Maximum |
|
x86 |
2,047.9 MB |
|
x86 versions of Windows booted with increaseuserva |
2,047.9 MB+ user virtual address increase (MB) |
|
IA64 |
7,152 GB |
|
x64 |
8,192 GB |
When a page fault occurs, the process’s working set limits and the amount of free memory on the system are examined. If conditions permit, the memory manager allows a process to grow to its working set maximum (or beyond if the process does not have a hard working set limit and there are enough free pages available). However, if memory is tight, Windows replaces rather than adds pages in a working set when a fault occurs.
Although Windows attempts to keep memory available by writing modified pages to disk, when modified pages are being generated at a very high rate, more memory is required in order to meet memory demands. Therefore, when physical memory runs low, the working set manager, a routine that runs in the context of the balance set manager system thread (described in the next section), initiates automatic working set trimming to increase the amount of free memory available in the system. (With the Windows SetProcessWorkingSetSizeEx function mentioned earlier, you can also initiate working set trimming of your own process—for example, after process initialization.)
The working set manager examines available memory and decides which, if any, working sets need to be trimmed. If there is ample memory, the working set manager calculates how many pages could be removed from working sets if needed. If trimming is needed, it looks at working sets that are above their minimum setting. It also dynamically adjusts the rate at which it examines working sets as well as arranges the list of processes that are candidates to be trimmed into an optimal order. For example, processes with many pages that have not been accessed recently are examined first; larger processes that have been idle longer are considered before smaller processes that are running more often; the process running the foreground application is considered last; and so on.
When it finds processes using more than their minimums, the working set manager looks for pages to remove from their working sets, making the pages available for other uses. If the amount of free memory is still too low, the working set manager continues removing pages from processes’ working sets until it achieves a minimum number of free pages on the system.
The working set manager tries to remove pages that haven’t been accessed recently. It does this by checking the accessed bit in the hardware PTE to see whether the page has been accessed. If the bit is clear, the page is aged, that is, a count is incremented indicating that the page hasn’t been referenced since the last working set trim scan. Later, the age of pages is used to locate candidate pages to remove from the working set.
If the hardware PTE accessed bit is set, the working set manager clears it and goes on to examine the next page in the working set. In this way, if the accessed bit is clear the next time the working set manager examines the page, it knows that the page hasn’t been accessed since the last time it was examined. This scan for pages to remove continues through the working set list until either the number of desired pages has been removed or the scan has returned to the starting point. (The next time the working set is trimmed, the scan picks up where it left off last.)
EXPERIMENT: VIEWING PROCESS WORKING SET SIZES
You can use Performance Monitor to examine process working set sizes by looking at the performance counters shown in the following table.
|
Counter |
Description |
|
Process: Working Set |
Current size of the selected process’s working set in bytes |
|
Process: Working Set Peak |
Peak size of the selected process’s working set in bytes |
|
Process: Page Faults/sec |
Number of page faults for the process that occur each second |
Several other process viewer utilities (such as Task Manager and Process Explorer) also display the process working set size.
You can also get the total of all the process working sets by selecting the _Total process in the instance box in Performance Monitor. This process isn’t real—it’s simply a total of the process-specific counters for all processes currently running on the system. The total you see is larger than the actual RAM being used, however, because the size of each process working set includes pages being shared by other processes. Thus, if two or more processes share a page, the page is counted in each process’s working set.
EXPERIMENT: WORKING SET VS. VIRTUAL SIZE
Earlier in this chapter, we used the TestLimit utility to create two processes, one with a large amount of memory that was merely reserved, and the other in which the memory was private committed, and examined the difference between them with Process Explorer. Now we will create a third TestLimit process, one that not only commits the memory but also accesses it, thus bringing it into its working set:
C:\temp>testlimit -d 1 -c 800
Testlimit v5.2 - test Windows limits
Copyright (C) 2012 Mark Russinovich
Sysinternals - wwww.sysinternals.com
Process ID: 700
Leaking private bytes 1 MB at a time...
Leaked 800 MB of private memory (800 MB total leaked). Lasterror: 0
The operation completed successfully.
Now, invoke Process Explorer. Under View, Select Columns, choose the Process Memory tab and enable the Private Bytes, Virtual Size, Working Set Size, WS Shareable Bytes, and WS Private Bytes counters. Then find the three instances of TestLimit as shown in the display.
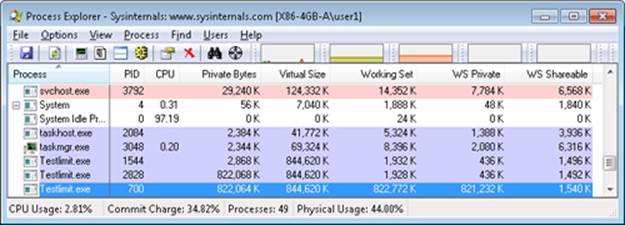
The new TestLimit process is the third one shown, PID 700. It is the only one of the three that actually referenced the memory allocated, so it is the only one with a working set that reflects the size of the test allocation.
Note that this result is possible only on a system with enough RAM to allow the process to grow to such a size. Even on this system, not quite all of the private bytes (822,064 K) are in the WS Private portion of the working set. A small number of the private pages have either been pushed out of the process working set due to replacement or have not been paged in yet.
EXPERIMENT: VIEWING THE WORKING SET LIST IN THE DEBUGGER
You can view the individual entries in the working set by using the kernel debugger !wsle command. The following example shows a partial output of the working set list of WinDbg.
lkd> !wsle 7
Working Set @ c0802000
FirstFree 209c FirstDynamic 6
LastEntry 242e NextSlot 6 LastInitialized 24b9
NonDirect 0 HashTable 0 HashTableSize 0
Reading the WSLE data ................................................................
Virtual Address Age Locked ReferenceCount
c0600203 0 1 1
c0601203 0 1 1
c0602203 0 1 1
c0603203 0 1 1
c0604213 0 1 1
c0802203 0 1 1
2865201 0 0 1
1a6d201 0 0 1
3f4201 0 0 1
707ed101 0 0 1
2d27201 0 0 1
2d28201 0 0 1
772f5101 0 0 1
2d2a201 0 0 1
2d2b201 0 0 1
2d2c201 0 0 1
779c3101 0 0 1
c0002201 0 0 1
7794f101 0 0 1
7ffd1109 0 0 1
7ffd2109 0 0 1
7ffc0009 0 0 1
7ffb0009 0 0 1
77940101 0 0 1
77944101 0 0 1
112109 0 0 1
320109 0 0 1
322109 0 0 1
77949101 0 0 1
110109 0 0 1
77930101 0 0 1
111109 0 0 1
Notice that some entries in the working set list are page table pages (the ones with addresses greater than 0xC0000000), some are from system DLLs (the ones in the 0x7nnnnnnn range), and some are from the code of Windbg.exe itself.
Balance Set Manager and Swapper
Working set expansion and trimming take place in the context of a system thread called the balance set manager (routine KeBalanceSetManager). The balance set manager is created during system initialization. Although the balance set manager is technically part of the kernel, it calls the memory manager’s working set manager (MmWorkingSetManager) to perform working set analysis and adjustment.
The balance set manager waits for two different event objects: an event that is signaled when a periodic timer set to fire once per second expires and an internal working set manager event that the memory manager signals at various points when it determines that working sets need to be adjusted. For example, if the system is experiencing a high page fault rate or the free list is too small, the memory manager wakes up the balance set manager so that it will call the working set manager to begin trimming working sets. When memory is more plentiful, the working set manager will permit faulting processes to gradually increase the size of their working sets by faulting pages back into memory, but the working sets will grow only as needed.
When the balance set manager wakes up as the result of its 1-second timer expiring, it takes the following five steps:
1. It queues a DPC associated to a 1-second timer. The DPC routine is the KiScanReadyQueues routine, which looks for threads that might warrant having their priority boosted because they are CPU starved. (See the section “Priority Boosts for CPU Starvation” in Chapter 5 in Part 1.)
2. Every fourth time the balance set manager wakes up because its 1-second timer has expired, it signals an event that wakes up another system thread called the swapper (KiSwapperThread) (routine KeSwapProcessOrStack).
3. The balance set manager then checks the look-aside lists and adjusts their depths if necessary (to improve access time and to reduce pool usage and pool fragmentation).
4. It adjusts IRP credits to optimize the usage of the per-processor look-aside lists used in IRP completion. This allows better scalability when certain processors are under heavy I/O load.
5. It calls the memory manager’s working set manager. (The working set manager has its own internal counters that regulate when to perform working set trimming and how aggressively to trim.)
The swapper is also awakened by the scheduling code in the kernel if a thread that needs to run has its kernel stack swapped out or if the process has been swapped out. The swapper looks for threads that have been in a wait state for 15 seconds (or 3 seconds on a system with less than 12 MB of RAM). If it finds one, it puts the thread’s kernel stack in transition (moving the pages to the modified or standby lists) so as to reclaim its physical memory, operating on the principle that if a thread’s been waiting that long, it’s going to be waiting even longer. When the last thread in a process has its kernel stack removed from memory, the process is marked to be entirely outswapped. That’s why, for example, processes that have been idle for a long time (such as Winlogon is after you log on) can have a zero working set size.
System Working Sets
Just as processes have working sets that manage pageable portions of the process address space, the pageable code and data in the system address space is managed using three global working sets, collectively known as the system working sets:
§ The system cache working set (MmSystemCacheWs) contains pages that are resident in the system cache.
§ The paged pool working set (MmPagedPoolWs) contains pages that are resident in the paged pool.
§ The system PTEs working set (MmSystemPtesWs) contains pageable code and data from loaded drivers and the kernel image, as well as pages from sections that have been mapped into the system space.
You can examine the sizes of these working sets or the sizes of the components that contribute to them with the performance counters or system variables shown in Table 10-22. Keep in mind that the performance counter values are in bytes, whereas the system variables are measured in terms of pages.
(You can also examine the paging activity in the system cache working set by examining the Memory: Cache Faults/sec performance counter, which describes page faults that occur in the system cache working set (both hard and soft). MmSystemCacheWs.PageFaultCount is the system variable that contains the value for this counter.
Table 10-22. System Working Set Performance Counters
|
Performance Counter (in Bytes) |
System Variable (in Pages) |
Description |
|
Memory: Cache Bytes, also Memory: System Cache Resident Bytes |
MmSystemCacheWs. WorkingSetSize |
Physical memory consumed by the file system cache. |
|
Memory: Cache Bytes Peak |
MmSystemCacheWs.Peak |
Peak system working set size. |
|
Memory: System Driver Resident Bytes |
MmSystemDriverPage |
Physical memory consumed by pageable device driver code. |
|
Memory: Pool Paged Resident Bytes |
MmPagedPoolWs. WorkingSetSize |
Physical memory consumed by paged pool. |
Memory Notification Events
Windows provides a way for user-mode processes and kernel-mode drivers to be notified when physical memory, paged pool, nonpaged pool, and commit charge are low and/or plentiful. This information can be used to determine memory usage as appropriate. For example, if available memory is low, the application can reduce memory consumption. If available paged pool is high, the driver can allocate more memory. Finally, the memory manager also provides an event that permits notification when corrupted pages have been detected.
User-mode processes can be notified only of low or high memory conditions. An application can call the CreateMemoryResourceNotification function, specifying whether low or high memory notification is desired. The returned handle can be provided to any of the wait functions. When memory is low (or high), the wait completes, thus notifying the thread of the condition. Alternatively, the QueryMemoryResourceNotification can be used to query the system memory condition at any time without blocking the calling thread.
Drivers, on the other hand, use the specific event name that the memory manager has set up in the \KernelObjects directory, since notification is implemented by the memory manager signaling one of the globally named event objects it defines, shown in Table 10-23.
Table 10-23. Memory Manager Notification Events
|
Event Name |
Description |
|
HighCommitCondition |
This event is set when the commit charge is near the maximum commit limit. In other words, memory usage is very high, very little space is available in physical memory or paging files, and the operating system cannot increase the size of its paging files. |
|
HighMemoryCondition |
This event is set whenever the amount of free physical memory exceeds the defined amount. |
|
HighNonPagedPoolCondition |
This event is set whenever the amount of nonpaged pool exceeds the defined amount. |
|
HighPagedPoolCondition |
This event is set whenever the amount of paged pool exceeds the defined amount. |
|
LowCommitCondition |
This event is set when the commit charge is low, relative to the current commit limit. In other words, memory usage is low and a lot of space is available in physical memory or paging files. |
|
LowMemoryCondition |
This event is set whenever the amount of free physical memory falls below the defined amount. |
|
LowNonPagedPoolCondition |
This event is set whenever the amount of free nonpaged pool falls below the defined amount. |
|
LowPagedPoolCondition |
This event is set whenever the amount of free paged pool falls below the defined amount. |
|
MaximumCommitCondition |
This event is set when the commit charge is near the maximum commit limit. In other words, memory usage is very high, very little space is available in physical memory or paging files, and the operating system cannot increase the size or number of paging files. |
|
MemoryErrors |
A bad page (non-zeroed zero page) has been detected. |
When a given memory condition is detected, the appropriate event is signaled, thus waking up any waiting threads.
NOTE
The high and low memory values can be overridden by adding a DWORD registry value, LowMemoryThreshold or HighMemoryThreshold, under HKLM\SYSTEM\CurrentControlSet\Session Manager\Memory Management that specifies the number of megabytes to use as the low or high threshold. The system can also be configured to crash the system when a bad page is detected, instead of signaling a memory error event, by setting the PageValidationAction DWORD registry value in the same key.
EXPERIMENT: VIEWING THE MEMORY RESOURCE NOTIFICATION EVENTS
To see the memory resource notification events, run Winobj from Sysinternals and click on the KernelObjects folder. You will see both the low and high memory condition events shown in the right pane:
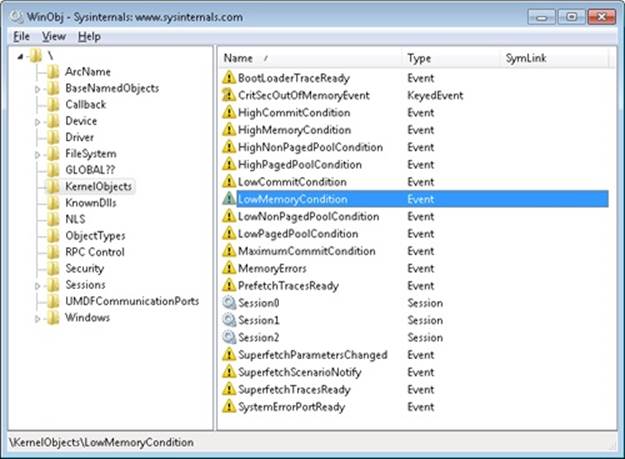
If you double-click either event, you can see how many handles and/or references have been made to the objects.
To see whether any processes in the system have requested memory resource notification, search the handle table for references to “LowMemoryCondition” or “HighMemoryCondition.” You can do this by using Process Explorer’s Find menu and choosing the Handle capability or by using WinDbg. (For a description of the handle table, see the section “Object Manager” in Chapter 3 in Part 1.)
Proactive Memory Management (Superfetch)
Traditional memory management in operating systems has focused on the demand-paging model we’ve shown until now, with some advances in clustering and prefetching so that disk I/Os can be optimized at the time of the demand-page fault. Client versions of Windows, however, include a significant improvement in the management of physical memory with the implementation of Superfetch, a memory management scheme that enhances the least-recently accessed approach with historical file access information and proactive memory management.
The standby list management of previous Windows versions has had two limitations. First, the prioritization of pages relies only on the recent past behavior of processes and does not anticipate their future memory requirements. Second, the data used for prioritization is limited to the list of pages owned by a process at any given point in time. These shortcomings can result in scenarios in which the computer is left unattended for a brief period of time, during which a memory-intensive system application runs (doing work such as an antivirus scan or a disk defragmentation) and then causes subsequent interactive application use (or launch) to be sluggish. The same situation can happen when a user purposely runs a data and/or memory intensive application and then returns to use other programs, which appear to be significantly less responsive.
This decline in performance occurs because the memory-intensive application forces the code and data that active applications had cached in memory to be overwritten by the memory-intensive activities—applications perform sluggishly as they have to request their data and code from disk. Client versions of Windows take a big step toward resolving these limitations with Superfetch.
Components
Superfetch is composed of several components in the system that work hand in hand to proactively manage memory and limit the impact on user activity when Superfetch is performing its work. These components include:
§ Tracer The tracer mechanisms are part of a kernel component (Pf) that allows Superfetch to query detailed page usage, session, and process information at any time. Superfetch also makes use of the FileInfo driver (%SystemRoot%\System32\Drivers\Fileinfo.sys) to track file usage.
§ Trace collector and processor This collector works with the tracing components to provide a raw log based on the tracing data that has been acquired. This tracing data is kept in memory and handed off to the processor. The processor then hands the log entries in the trace to the agents, which maintain history files (described next) in memory and persist them to disk when the service stops (such as during a reboot).
§ Agents Superfetch keeps file page access information in history files, which keep track of virtual offsets. Agents group pages by attributes, such as:
§ Page access while the user was active
§ Page access by a foreground process
§ Hard fault while the user was active
§ Page access during an application launch
§ Page access upon the user returning after a long idle period
§ Scenario manager This component, also called the context agent, manages the three Superfetch scenario plans: hibernation, standby, and fast-user switching The kernel-mode part of the scenario manager provides APIs for initiating and terminating scenarios, managing current scenario state, and associating tracing information with these scenarios.
§ Rebalancer Based on the information provided by the Superfetch agents, as well as the current state of the system (such as the state of the prioritized page lists), the rebalancer, a specialized agent that is located in the Superfetch user-mode service, queries the PFN database and reprioritizes it based on the associated score of each page, thus building the prioritized standby lists. The rebalancer can also issue commands to the memory manager that modify the working sets of processes on the system, and it is the only agent that actually takes action on the system—other agents merely filter information for the rebalancer to use in its decisions. Other than reprioritization, the rebalancer also initiates prefetching through the prefetcher thread, which makes use of FileInfo and kernel services to preload memory with useful pages.
Finally, all these components make use of facilities inside the memory manager that allow querying detailed information about the state of each page in the PFN database, the current page counts for each page list and prioritized list, and more. Figure 10-50 displays an architectural diagram of Superfetch’s multiple components. Superfetch components also make use of prioritized I/O (see Chapter 8 for more information on I/O priority) to minimize user impact.
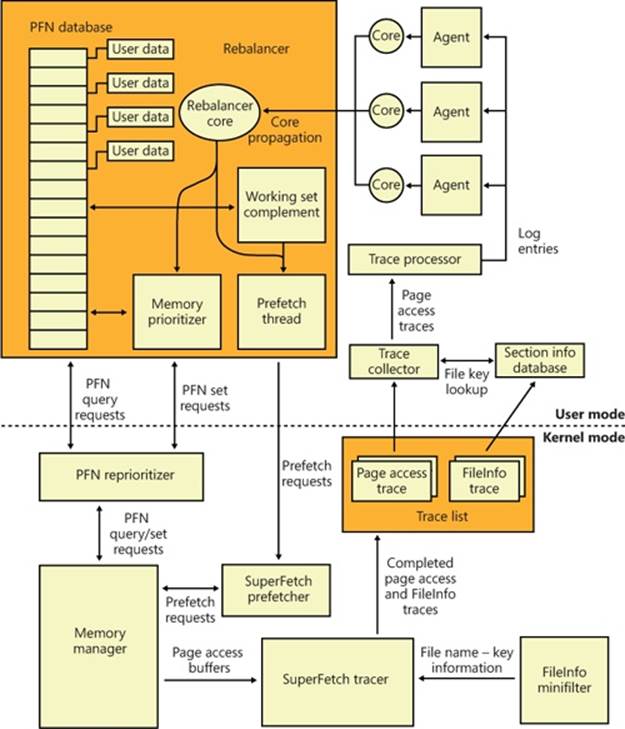
Figure 10-50. Superfetch architectural diagram
Tracing and Logging
Superfetch makes most of its decisions based on information that has been integrated, parsed, and post-processed from raw traces and logs, making these two components among the most critical. Tracing is similar to ETW in some ways because it makes use of certain triggers in code throughout the system to generate events, but it also works in conjunction with facilities already provided by the system, such as power manager notification, process callbacks, and file system filtering. The tracer also makes use of traditional page aging mechanisms that exist in thememory manager, as well as newer working set aging and access tracking implemented for Superfetch.
Superfetch always keeps a trace running and continuously queries trace data from the system, which tracks page usage and access through the memory manager’s access bit tracking and working set aging. To track file-related information, which is as critical as page usage because it allows prioritization of file data in the cache, Superfetch leverages existing filtering functionality with the addition of the FileInfo driver. (See Chapter 8 for more information on filter drivers.) This driver sits on the file system device stack and monitors access and changes to files at the stream level (for more information on NTFS data streams, see Chapter 12), which provides it with fine-grained understanding of file access. The main job of the FileInfo driver is to associate streams (identified by a unique key, currently implemented as the FsContext field of the respective file object) with file names so that the user-mode Superfetch service can identify the specific file steam and offset with which a page in the standby list belonging to a memory mapped section is associated. It also provides the interface for prefetching file data transparently, without interfering with locked files and other file system state. The rest of the driver ensures that the information stays consistent by tracking deletions, renaming operations, truncations, and the reuse of file keys by implementing sequence numbers.
At any time during tracing, the rebalancer might be invoked to repopulate pages differently. These decisions are made by analyzing information such as the distribution of memory within working sets, the zero page list, the modified page list and the standby page lists, the number of faults, the state of PTE access bits, the per-page usage traces, current virtual address consumption, and working set size.
A given trace can be either a page access trace, in which the tracer keeps track (by using the access bit) of which pages were accessed by the process (both file page and private memory), or a name logging trace, which monitors the file-name-to-file-key-mapping updates (which allow Superfetch to map a page associated with a file object) to the actual file on disk.
Although a Superfetch trace only keeps track of page accesses, the Superfetch service processes this trace in user mode and goes much deeper, adding its own richer information such as where the page was loaded from (such as resident memory or a hard page fault), whether this was the initial access to that page, and what the rate of page access actually is. Additional information, such as the system state, is also kept, as well as information about in which recent scenarios each traced page was last referenced. The generated trace information is kept in memory through a logger into data structures, which identify, in the case of page access traces, a virtual-address-to-working-set pair or, in the case of a name logging trace, a file-to-offset pair. Superfetch can thus keep track of which range of virtual addresses for a given process have page-related events and which range of offsets for a given file have similar events.
Scenarios
One aspect of Superfetch that is distinct from its primary page repriorization and prefetching mechanisms (covered in more detail in the next section) is its support for scenarios, which are specific actions on the machine for which Superfetch strives to improve the user experience. These scenarios are standby and hibernation as well as fast user switching. Each of these scenarios has different goals, but all are centered around the main purpose of minimizing or removing hard faults.
§ For hibernation, the goal is to intelligently decide which pages are saved in the hibernation file other than the existing working set pages. The goal is to minimize the amount of time that it takes for the system to become responsive after a resume.
§ For standby, the goal is to completely remove hard faults after resume. Because a typical system can resume in less than 2 seconds, but can take 5 seconds to spin-up the hard drive after a long sleep, a single hard fault could cause such a delay in the resume cycle. Superfetch prioritizes pages needed after a standby to remove this chance.
§ For fast user switching, the goal is to keep an accurate priority and understanding of each user’s memory, so that switching to another user will cause the user’s session to be immediately usable, and not require a large amount of lag time to allow pages to be faulted in.
Scenarios are hardcoded, and Superfetch manages them through the NtSetSystemInformation and NtQuerySystemInformation APIs that control system state. For Superfetch purposes, a special information class, SystemSuperfetchInformation, is used to control the kernel-mode components and to generate requests such as starting, ending, and querying a scenario or associating one or more traces with a scenario.
Each scenario is defined by a plan file, which contains, at minimum, a list of pages associated with the scenario. Page priority values are also assigned according to certain rules we’ll describe next. When a scenario starts, the scenario manager is responsible for responding to the event by generating the list of pages that should be brought into memory and at which priority.
Page Priority and Rebalancing
We’ve already seen that the memory manager implements a system of page priorities to define from which standby list pages will be repurposed for a given operation and in which list a given page will be inserted. This mechanism provides benefits when processes and threads can have associated priorities—such that a defragmenter process doesn’t pollute the standby page list and/or steal pages from an interactive, foreground process—but its real power is unleashed through Superfetch’s page prioritization schemes and rebalancing, which don’t require manual application input or hardcoded knowledge of process importance.
Superfetch assigns page priority based on an internal score it keeps for each page, part of which is based on frequency-based usage. This usage counts how many times a page was used in given relative time intervals, such as an hour, a day, or a week. Time of use is also kept track of, which records for how long a given page has not been accessed. Finally, data such as where this page comes from (which list) and other access patterns are used to compute this final score, which is then translated into a priority number, which can be anywhere from 1 to 6 (7 is used for another purpose described later). Going down each level, the lower standby page list priorities are repurposed first, as shown in the Experiment EXPERIMENT: Viewing the Prioritized Standby Lists. Priority 5 is typically used for normal applications, while priority 1 is meant forbackground applications that third-party developers can mark as such. Finally, priority 6 is used to keep a certain number of high-importance pages as far away as possible from repurposing. The other priorities are a result of the score associated with each page.
Because Superfetch “learns” a user’s system, it can start from scratch with no existing historical data and slowly build up an understanding of the different page usage accesses associated with the user. However, this would result in a significant learning curve whenever a new application, user, or service pack was installed. Instead, by using an internal tool, Microsoft has the ability to pretrain Superfetch to capture Superfetch data and then turn it into prebuilt traces. Before Windows shipped, the Superfetch team traced common usages and patterns that all users will probably encounter, such as clicking the Start menu, opening Control Panel, or using the File Open/Save dialog box. This trace data was then saved to history files (which ship as resources in Sysmain.dll) and is used to prepopulate the special priority 7 list, which is where the most critical data is placed and which is very rarely repurposed. Pages at priority 7 are file pages kept in memory even after the process has exited and even across reboots (by being repopulated at the next boot). Finally, pages with priority 7 are static, in that they are never reprioritized, and Superfetch will never dynamically load pages at priority 7 other than the static pretrained set.
The prioritized list is loaded into memory (or prepopulated) by the rebalancer, but the actual act of rebalancing is actually handled by both Superfetch and the memory manager. As shown earlier, the prioritized standby page list mechanism is internal to the memory manager, and decisions as to which pages to throw out first and which to protect are innate, based on the priority number. The rebalancer actually does its job not by manually rebalancing memory but by reprioritizing it, which will cause the operation of the memory manager to perform the needed tasks. The rebalancer is also responsible for reading the actual pages from disk, if needed, so that they are present in memory (prefetching). It then assigns the priority that is mapped by each agent to the score for each page, and the memory manager will then ensure that the page is treated according to its importance.
The rebalancer can also take action without relying on other agents; for example, if it notices that the distribution of pages across paging lists is suboptimal or that the number of repurposed pages across different priority levels is detrimental. The rebalancer also has the ability to cause working set trimming if needed, which might be required for creating an appropriate budget of pages that will be used for Superfetch prepopulated cache data. The rebalancer will typically take low-utility pages—such as those that are already marked as low priority, pages that are zeroed, and pages with valid contents but not in any working set and have been unused—and build a more useful set of pages in memory, given the budget it has allocated itself.
Once the rebalancer has decided which pages to bring into memory and at which priority level they need to be loaded (as well as which pages can be thrown out), it performs the required disk reads to prefetch them. It also works in conjunction with the I/O manager’s prioritization schemes so that the I/Os are performed with very low priority and do not interfere with the user. It is important to note that the actual memory consumption used by prefetching is all backed by standby pages—as described earlier in the discussion of page dynamics, standby memory is available memory because it can be repurposed as free memory for another allocator at any time. In other words, if Superfetch is prefetching the “wrong data,” there is no real impact to the user, because that memory can be reused when needed and doesn’t actually consume resources.
Finally, the rebalancer also runs periodically to ensure that pages it has marked as high priority have actually been recently used. Because these pages will rarely (sometimes never) be repurposed, it is important not to waste them on data that is rarely accessed but may have appeared to be frequently accessed during a certain time period. If such a situation is detected, the rebalancer runs again to push those pages down in the priority lists.
In addition to the rebalancer, a special agent called the application launch agent is also involved in a different kind of prefetching mechanism, which attempts to predict application launches and builds a Markov chain model that describes the probability of certain application launches given the existence of other application launches within a time segment. These time segments are divided across four different periods—morning, noon, evening, and night; roughly 6 hours each—and are also kept track of separately as weekdays or weekends. For example, if on Saturday and Sunday evening a user typically launches Outlook (to send email) after having launched Word (to write letters), the application launch agent will probably have prefetched Outlook based on the high probability of it running after Word during weekend evenings.
Because systems today have sufficiently large amounts of memory, on average more than 2 GB (although Superfetch works well on low-memory systems, too), the actual real amount of memory that frequently used processes on a machine need resident for optimal performance ends up being a manageable subset of their entire memory footprint, and Superfetch can often fit all the pages required into RAM. When it can’t, technologies such as ReadyBoost and ReadyDrive can further avoid disk usage.
Robust Performance
A final performance enhancing functionality of Superfetch is called robustness, or robust performance. This component, managed by the user-mode Superfetch service, but ultimately implemented in the kernel (Pf routines), watches for specific file I/O access that might harm system performance by populating the standby lists with unneeded data. For example, if a process were to copy a large file across the file system, the standby list would be populated with the file’s contents, even though that file might never be accessed again (or not for a long period of time). This would throw out any other data within that priority (and if this was an interactive and useful program, chances are its priority would’ve been at least 5).
Superfetch responds to two specific kinds of I/O access patterns: sequential file access (going through all the data in a file) and sequential directory access (going through every file in a directory). When Superfetch detects that a certain amount of data (past an internal threshold) has been populated in the standby list as a result of this kind of access, it applies aggressive deprioritization (robustion) to the pages being used to map this file, within the targeted process only (so as not to penalize other applications). These pages, so-called robusted, essentially become reprioritized to priority 2.
Because this component of Superfetch is reactive and not predictive, it does take some time for the robustion to kick in. Superfetch will therefore keep track of this process for the next time it runs. Once Superfetch has determined that it appears that this process always performs this kind of sequential access, Superfetch remembers it and robusts the file pages as soon as they’re mapped, instead of waiting on the reactive behavior. At this point, the entire process is now considered robusted for future file access.
Just by applying this logic, however, Superfetch could potentially hurt many legitimate applications or user scenarios that perform sequential access in the future. For example, by using the Sysinternals Strings.exe utility, you can look for a string in all executables that are part of a directory. If there are many files, Superfetch would likely perform robustion. Now, next time you run Strings with a different search parameter, it would run just as slowly as it did the first time, even though you’d expect it to run much faster. To prevent this, Superfetch keeps a list of processes that it watches into the future, as well as an internal hard-coded list of exceptions. If a process is detected to later re-access robusted files, robustion is disabled on the process in order to restore expected behavior.
The main point to remember when thinking about robustion, and Superfetch optimizations in general, is that Superfetch constantly monitors usage patterns and updates its understanding of the system, so that it can avoid fetching useless data. Although changes in a user’s daily activities or application startup behavior might cause Superfetch to incorrectly “pollute” the cache with irrelevant data or to throw out data that Superfetch might think is useless, it will quickly adapt to any pattern changes. If the user’s actions are erratic and random, the worst that can happen is that the system behaves in a similar state as if Superfetch was not present at all. If Superfetch is ever in doubt or cannot track data reliably, it quiets itself and doesn’t make changes to a given process or page.
RAM OPTIMIZATION SOFTWARE
While Superfetch provides valuable and realistic optimization of memory usage for the various scenarios it aims to support, many third-party software manufacturers are involved in the distribution of so-called “RAM Optimization” software, which aims to significantly increase available memory on a user’s system. These memory optimizers typically present a user interface that shows a graph labeled “Available Memory,” and a line typically shows the amount of memory that the optimizer will try to free when it runs. After the optimization job runs, the utility’s available memory counter often goes up, sometimes dramatically, implying that the tool is actually freeing up memory for application use. RAM optimizers work by allocating and then freeing large amounts of virtual memory. The following illustration shows the effect a RAM optimizer has on a system.
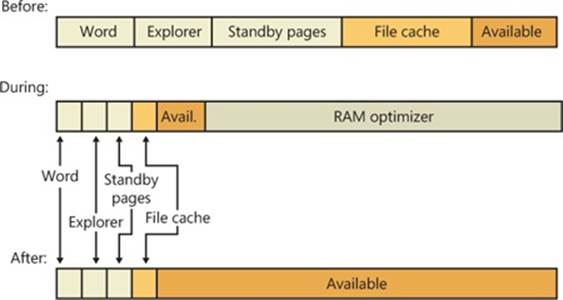
The Before bar depicts the process and system working sets, the pages in standby lists, and free memory before optimization. The During bar shows that the RAM optimizer creates a high memory demand, which it does by incurring many page faults in a short time. In response, the memory manager increases the RAM optimizer’s working set. This working-set expansion occurs at the expense of free memory, followed by standby pages and—when available memory becomes low—at the expense of other process working sets. The After bar illustrates how, after the RAM optimizer frees its memory, the memory manager moves all the pages that were assigned to the RAM optimizer to the free page list (which ultimately get zeroed by the zero page thread and moved to the zeroed page list), thus contributing to the free memory value.
Although gaining more free memory might seem like a good thing, gaining free memory in this way is not. As RAM optimizers force the available memory counter up, they force other processes’ data and code out of memory. If you’re running Microsoft Word, for example, the text of open documents and the program code that was part of Word’s working set before theoptimization (and was therefore present in physical memory) must be reread from disk as you continue to edit your document. Additionally, by depleting the standby lists, valuable cached data is lost, including much of Superfetch’s cache. The performance degradation can be especially severe on servers, where the trimming of the system working set causes cached file data in physical memory to be thrown out, causing hard faults the next time it is accessed.
ReadyBoost
Although RAM today is somewhat easily available and relatively cheap compared to a decade ago, it still doesn’t beat the cost of secondary storage such as hard disk drives. Unfortunately, hard disks today contain many moving parts, are fragile, and, more importantly, relatively slow compared to RAM, especially during seeking, so storing active Superfetch data on the drive would be as bad as paging out a page and hard faulting it inside memory. (Solid state disks offset some of these disadvantages, but they are pricier and still slow compared to RAM.) On the other hand, portable solid state media such as USB flash disk (UFD), CompactFlash cards, and Secure Digital cards provide a useful compromise. (In practice, CompactFlash cards and Secure Digital cards are almost always interfaced through a USB adapter, so they all appear to the system as USB flash disks.) They are cheaper than RAM and available in larger sizes, but they also have seek times much shorter than hard drives because of the lack of moving parts.
Random disk I/O is especially expensive because disk head seek time plus rotational latency for typical desktop hard drives total about 13 milliseconds—an eternity for today’s 3-GHz processors. Flash memory, however, can service random reads up to 10 times faster than a typical hard disk. Windows therefore includes a feature called ReadyBoost to take advantage of flash memory storage devices by creating an intermediate caching layer on them that logically sits between memory and disks.
ReadyBoost is implemented with the aid of a driver (%SystemRoot%\System32\Drivers\Rdyboost.sys) that is responsible for writing the cached data to the NVRAM device. When you insert a USB flash disk into a system, ReadyBoost looks at the device to determine its performance characteristics and stores the results of its test in HKLM\SOFTWARE\Microsoft\Windows NT\CurrentVersion\Emdmgmt, as shown in Figure 10-51. (Emd is short for External Memory Device, the working name for ReadyBoost during its development.)
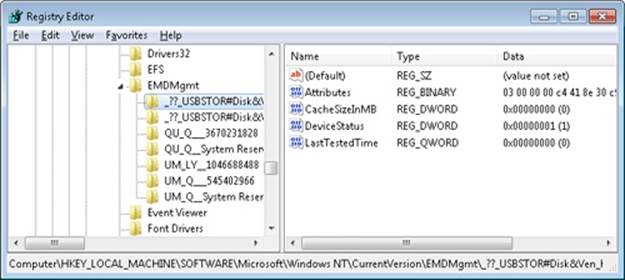
Figure 10-51. ReadyBoost device test results in the registry
If the new device is between 256 MB and 32 GB in size, has a transfer rate of 2.5 MB per second or higher for random 4-KB reads, and has a transfer rate of 1.75 MB per second or higher for random 512-KB writes, then ReadyBoost will ask if you’d like to dedicate some of the space for disk caching. If you agree, ReadyBoost creates a file named ReadyBoost.sfcache in the root of the device, which it will use to store cached pages.
After initializing caching, ReadyBoost intercepts all reads and writes to local hard disk volumes (C:\, for example) and copies any data being read or written into the caching file that the service created. There are exceptions such as data that hasn’t been read in a long while, or data that belongs to Volume Snapshot requests. Data stored on the cached drive is compressed and typically achieves a 2:1 compression ratio, so a 4-GB cache file will usually contain 8 GB of data. Each block is encrypted as it is written using Advanced Encryption Standard (AES) encryption with a randomly generated per-boot session key in order to guarantee the privacy of the data in the cache if the device is removed from the system.
When ReadyBoost sees random reads that can be satisfied from the cache, it services them from there, but because hard disks have better sequential read access than flash memory, it lets reads that are part of sequential access patterns go directly to the disk even if the data is in the cache. Likewise, when reading the cache, if large I/Os have to be done, the on-disk cache will be read instead.
One disadvantage of depending on flash media is that the user can remove it at any time, which means the system can never solely store critical data on the media (as we’ve seen, writes always go to the secondary storage first). A related technology, ReadyDrive, covered in the next section, offers additional benefits and solves this problem.
ReadyDrive
ReadyDrive is a Windows feature that takes advantage of hybrid hard disk drives (H-HDDs). An H-HDD is a disk with embedded nonvolatile flash memory (also known as NVRAM). Typical H-HDDs include between 50 MB and 512 MB of cache, but the Windows cache limit is 2 TB.
Under ReadyDrive, the drive’s flash memory does not simply act as an automatic, transparent cache, as does the RAM cache common on most hard drives. Instead, Windows uses ATA-8 commands to define the disk data to be held in the flash memory. For example, Windows will save boot data to the cache when the system shuts down, allowing for faster restarting. It also stores portions of hibernation file data in the cache when the system hibernates so that the subsequent resume is faster. Because the cache is enabled even when the disk is spun down, Windows can use the flash memory as a disk-write cache, which avoids spinning up the disk when the system is running on battery power. Keeping the disk spindle turned off can save much of the power consumed by the disk drive under normal usage.
Another consumer of ReadyDrive is Superfetch, since it offers the same advantages as ReadyBoost with some enhanced functionality, such as not requiring an external flash device and having the ability to work persistently. Because the cache is on the actual physical hard drive (which typically a user cannot remove while the computer is running), the hard drive controller typically doesn’t have to worry about the data disappearing and can avoid making writes to the actual disk, using solely the cache.
Unified Caching
For simplicity, we have described the conceptual functionality of Superfetch, ReadyBoost, and ReadyDrive independently. Their storage allocation and content tracking functions, however, are implemented in unified code in the operating system and are integrated with each other. This unified caching mechanism is often referred to as the Store Manager, although the Store Manager is really only one component.
Unified caching was developed to take advantage of the characteristics of the various types of storage hardware that might exist on a system. For example, Superfetch can use either the flash memory of a hybrid hard disk drive (if available) or a USB flash disk (if available) instead of using system RAM. Since an H-HDD’s flash memory can be better expected to be preserved across system shutdown and bootstrap cycles, it would be preferable for cache data that could help optimize boot times, while system RAM might be a better choice for other data. (In addition to optimizing boot times, a hybrid hard disk drive’s NVRAM, if present, is generally preferred as a cache location to a UFD. A UFD may be unplugged at any time, hence disappearing; thus cache on a UFD must always be handled as write-through to the actual hard drive. The NVRAM in an H-HDD can be allowed to work in write-back mode because it is not going to disappear unless the hard drive itself also disappears.)
The overall architecture of the unified caching mechanism is shown in Figure 10-52.
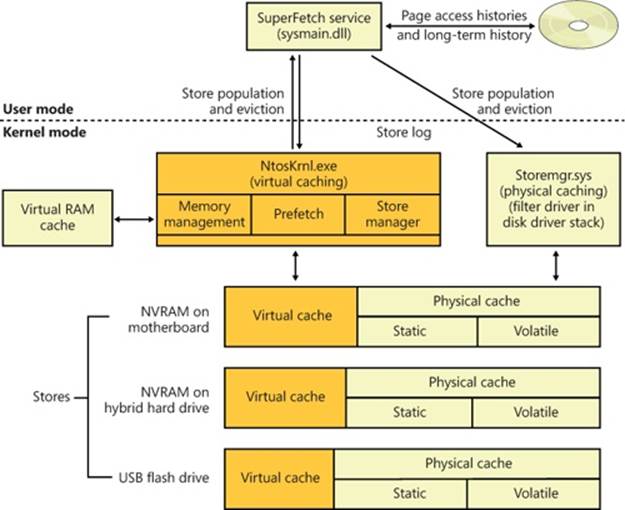
Figure 10-52. Architecture of the unified caching mechanism
The fundamental component that implements caching is called a “store.” Each store implements the functions of adding data to the backing storage (which may be in system RAM or in NVRAM), reading data from it, or removing data from it.
All data in a store is managed in terms of store pages (often called simply pages). The size of a store page is the system’s physical and virtual memory page size (4 KB, or 8KB on Itanium platforms), regardless of the “block size” (sometimes called “sector size”) presented by the underlying storage device. This allows store pages to be mapped and moved efficiently between the store, system RAM, and page files (which have always been organized in blocks of the same size). The recent move toward “advanced format” hard drives, which export a block size of 4 KB, is a good fit for this approach. Store pages within a store are identified by “store keys,” whose interpretation is up to the individual store.
When writing to a store, the store is responsible for buffering data so that the I/O to the actual storage device uses large buffers. This improves performance, as NVRAM devices as well as physical hard drives perform poorly with small random writes. The store may also perform compression and encryption before writing to the storage device.
The Store Manager component manages all of the stores and their contents. It is implemented as a component of the Superfetch service in Sysmain.dll, a set of executive services (SmXxx, such as SmPageRead) within Ntoskrnl.exe, and a filter driver in the disk storage stack, Storemgr.sys. Logically, it operates at the level just above all of the stores. Only the Store Manager communicates with stores; all other components interact with the Store Manager. Requests to the Store Manager look much like requests from the Store Manager to a store: requests to store data, retrieve data, or remove data from a store. Requests to the Store Manager to store data, however, include a parameter indicating which stores are to be written to.
The Store Manager keeps track of which stores contain each cached page. If a cached page is in one or more stores, requests to retrieve that page are routed by the Store Manager to one store or another according to which stores are the fastest or the least busy.
The Store Manager categorizes stores in the following ways. First, a store may reside in system RAM or in some form of nonvolatile RAM (either a UFD or the NVRAM of an H-HDD). Second, NVRAM stores are further divided into “virtual” and “physical” portions, while a store in system RAM acts only as a virtual store.
Virtual stores contain only page-file-backed information, including process-private memory and page-file-backed sections. Physical caches contain pages from disk, with the exception that physical caches never contain pages from page files. A store in system RAM can, however, contain pages from page files.
Physical caches are further divided into “static” and “volatile” (or “dynamic”) regions. The contents of the static region are completely determined by the user-mode Store Manager service. The Store Manager uses logs of historical access to data to populate the static region. The volatile or dynamic region of each store, on the other hand, populates itself based on read and write requests that pass through the disk storage stack, much in the manner of the automatic RAM cache on a traditional hard drive. Stores that implement a dynamic region are responsible for reporting to the Store Manager any such automatically cached (and dropped) contents.
This section has provided a brief description of the organization and operation of the unified caching mechanism. As of this writing, there are no Performance Monitor counters or other means in the operating system to measure the mechanism’s operation, other than the counters under the Cache object, which long predate the Store Manager.
Process Reflection
There are often cases where a process exhibits problematic behavior, but because it’s still providing service, suspending it to generate a full memory dump or interactively debug it is undesirable. The length of time a process is suspended to generate a dump can be minimized by taking a minidump, which captures thread registers and stacks along with pages of memory referenced by registers, but that dump type has a very limited amount of information, which many times is sufficient for diagnosing crashes but not for troubleshooting general problems. With process reflection, the target process is suspended only long enough to generate a minidump and create a suspended cloned copy of the target, and then the larger dump that captures all of a process’s valid user-mode memory can be generated from the clone while the target is allowed to continue executing.
Several Windows Diagnostic Infrastructure (WDI) components make use of process reflection to capture minimally intrusive memory dumps of processes their heuristics identify as exhibiting suspicious behavior. For example, the Memory Leak Diagnoser component of Windows Resource Exhaustion Detection and Resolution (also known as RADAR), generates a reflected memory dump of a process that appears to be leaking private virtual memory so that it can be sent to Microsoft via Windows Error Reporting (WER) for analysis. WDI’s hung process detection heuristic does the same for processes that appear to be deadlocked with one another. Because these components use heuristics, they can’t be certain the processes are faulty and therefore can’t suspend them for long periods of time or terminate them.
Process reflection’s implementation is driven by the RtlCreateProcessReflection function in Ntdll.dll. Its first step is to create a shared memory section, populate it with parameters, and map it into the current and target processes. It then creates two event objects and duplicates them into the target process so that the current process and target process can synchronize their operations. Next, it injects a thread into the target process via a call to RtlpCreateUserThreadEx. The thread is directed to begin execution in Ntdll’s RtlpProcessReflectionStartup function. Because Ntdll.dll is mapped at the same address, randomly generated at boot, into every process’s address space, the current process can simply pass the address of the function it obtains from its own Ntdll.dll mapping. If the caller of RtlCreateProcessReflection specified that it wants a handle to the cloned process, RtlCreateProcessReflection waits for the remote thread to terminate, otherwise it returns to the caller.
The injected thread in the target process allocates an additional event object that it will use to synchronize with the cloned process once it’s created. Then it calls RtlCloneUserProcess, passing parameters it obtains from the memory mapping it shares with the initiating process. If theRtlCreateProcessReflection option that specifies the creation of the clone when the process is not executing in the loader, performing heap operations, modifying the process environment block (PEB), or modifying fiber-local storage is present, then RtlCreateProcessReflectionacquires the associated locks before continuing. This can be useful for debugging because the memory dump’s copy of the data structures will be in a consistent state.
RtlCloneUserProcess finishes by calling RtlpCreateUserProcess, the user-mode function responsible for general process creation, passing flags that indicate the new process should be a clone of the current one, and RtlpCreateUserProcess in turn calls ZwCreateUserProcess to request the kernel to create the process.
When creating a cloned process, ZwCreateUserProcess executes most of the same code paths as when it creates a new process, with the exception that PspAllocateProcess, which it calls to create the process object and initial thread, calls MmInitializeProcessAddressSpace with a flag specifying that the address should be a copy-on-write copy of the target process instead of an initial process address space. The memory manager uses the same support it provides for the Services for Unix Applications fork API to efficiently clone the address space. Once the target process continues execution, any changes it makes to its address space are seen only by it, not the clone, which enables the clone’s address space to represent a consistent point-in-time view of the target process.
The clone’s execution begins at the point just after the return from RtlpCreateUserProcess. If the clone’s creation is successful, its thread receives the STATUS_PROCESS_CLONED return code, whereas the cloning thread receives STATUS_SUCCESS. The cloned process then synchronizes with the target and, as its final act, calls a function optionally passed to RtlCreateProcessReflection, which must be implemented in Ntdll.dll. RADAR, for instance, specifies RtlDetectHeapLeaks, which performs heuristic analysis of the process heaps and reports the results back to the thread that called RtlCreateProcessReflection. If no function was specified, the thread suspends itself or terminates, depending on the flags passed to RtlCreateProcessReflection.
When RADAR and WDI use process reflection, they call RtlCreateProcessReflection, asking for the function to return a handle to the cloned process and for the clone to suspend itself after it has initialized. Then they generate a minidump of the target process, which suspends the target for the duration of the dump generation, and next they generate a more comprehensive dump of the cloned process. After they finish generating the dump of the clone, they terminate the clone. The target process can execute during the time window between the minidump’s completion and the creation of the clone, but for most scenarios any inconsistencies do not interfere with troubleshooting. The Procdump utility from Sysinternals also follows these steps when you specify the –r switch to have it create a reflected dump of a target process.
EXPERIMENT: USING PREFLECT TO OBSERVE THE BEHAVIOR OF PROCESS REFLECTION
You can use the Preflect utility, which you can download from the Windows Internals book webpage, to see the effects of process reflection. First, launch Notepad.exe and obtain its process ID in a process management utility like Process Explorer or Task Manager. Next, open a command prompt and execute Preflect with the process ID as the command-line argument. This creates a cloned copy using process reflection. In Process Explorer, you will see two instances of Notepad: the one you launched and the cloned child instance that’s highlighted in gray (gray indicates that all the process’s threads are suspended):
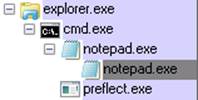
Open the process properties for each instance, switch to the Performance page, and put them side by side for comparison:
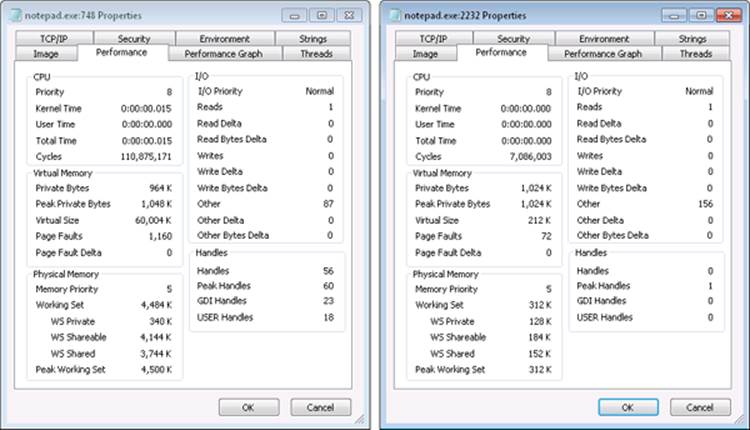
The two instances are easily distinguishable because the target process has been executing and therefore has a significantly higher cycle count and larger working set, and the clone has no references to any kernel or window manager objects, as evidenced by its zero kernel handle, GDI handle, and USER handle counts. Further, if you look at the Threads tab and have configured the Process Explorer symbol options to obtain operating system symbols, you’ll see that the target process’s thread began executing in Notepad.exe code, whereas the clone’s thread is the one injected by the target to execute RtlpProcessReflectionStartup.
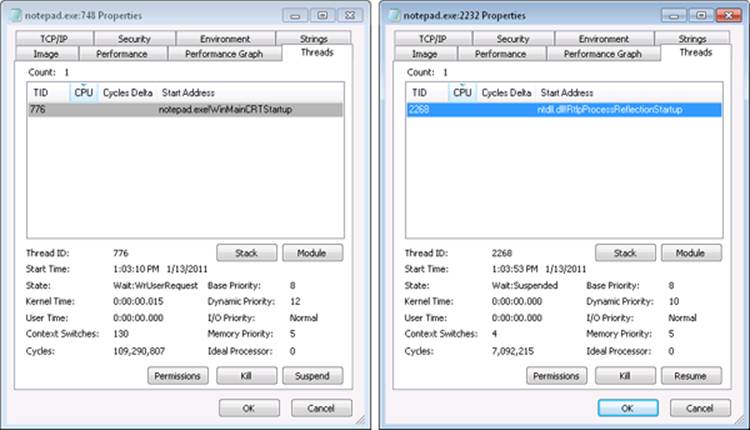
Conclusion
In this chapter, we’ve examined how the Windows memory manager implements virtual memory management. As with most modern operating systems, each process is given access to a private address space, protecting one process’s memory from another’s but allowing processes to share memory efficiently and securely. Advanced capabilities, such as the inclusion of mapped files and the ability to sparsely allocate memory, are also available. The Windows environment subsystem makes most of the memory manager’s capabilities available to applications through the Windows API.
The next chapter covers a component tightly integrated with the memory manager, the cache manager.
All materials on the site are licensed Creative Commons Attribution-Sharealike 3.0 Unported CC BY-SA 3.0 & GNU Free Documentation License (GFDL)
If you are the copyright holder of any material contained on our site and intend to remove it, please contact our site administrator for approval.
© 2016-2026 All site design rights belong to S.Y.A.