CCNA Wireless 200-355 Official Cert Guide (2016)
Chapter 7. Planning Coverage with Wireless APs
This chapter covers the following topics:
![]() AP Cell Size—This section discusses how the size of a wireless cell affects things like coverage area, performance, and efficiency.
AP Cell Size—This section discusses how the size of a wireless cell affects things like coverage area, performance, and efficiency.
![]() Adding APs to an ESS—This section covers the process of growing an extended service set, with an emphasis on client roaming and proper layout of wireless channels over an area.
Adding APs to an ESS—This section covers the process of growing an extended service set, with an emphasis on client roaming and proper layout of wireless channels over an area.
![]() Designing and Validating Coverage with Site Surveys—This section discusses methods you can use to predict and measure RF coverage within an area so that you can know how the wireless LAN will work in an actual physical environment.
Designing and Validating Coverage with Site Surveys—This section discusses methods you can use to predict and measure RF coverage within an area so that you can know how the wireless LAN will work in an actual physical environment.
This chapter covers the following exam topics:
![]() 7.0—Site Survey Process
7.0—Site Survey Process
![]() 7.1—Describe site survey methodologies and their purpose
7.1—Describe site survey methodologies and their purpose
![]() 7.1.a—Offsite (predictive / plan)
7.1.a—Offsite (predictive / plan)
![]() 7.1.b—Onsite
7.1.b—Onsite
![]() 7.1.b(i)—Predeployment (AP on a stick)
7.1.b(i)—Predeployment (AP on a stick)
![]() 7.1.b(ii)—Post deployment (validation)
7.1.b(ii)—Post deployment (validation)
![]() 7.2—Describe passive and active site surveys
7.2—Describe passive and active site surveys
![]() 7.3—Identify proper application of site survey tools
7.3—Identify proper application of site survey tools
![]() 7.3.a—Spectrum analyzer
7.3.a—Spectrum analyzer
![]() 7.3.b—Site surveying software
7.3.b—Site surveying software
Chapters 1 through 6 covered wireless communication with a focus on a single access point (AP) exchanging data with one or more clients. A single AP may be sufficient for home or small office use, but most wireless LANs involve a greater geographic area and require more APs. This chapter explains how wireless coverage can be adjusted to meet a need and how it can be grown to scale over a greater area and a greater number of clients. You will also learn about various types of site survey that you can use to verify RF coverage over an area. As you work through this chapter, remember that two things are important: the size of the BSA or AP cell and the location of cells in relation to each other.
“Do I Know This Already?” Quiz
The “Do I Know This Already?” quiz allows you to assess whether you should read this entire chapter thoroughly or jump to the “Exam Preparation Tasks” section. If you are in doubt about your answers to these questions or your own assessment of your knowledge of the topics, read the entire chapter. Table 7-1 lists the major headings in this chapter and their corresponding “Do I Know This Already?” quiz questions. You can find the answers in Appendix A, “Answers to the ‘Do I Know This Already?’ Quizzes.”
Table 7-1 “Do I Know This Already?” Section-to-Question Mapping
Caution
The goal of self-assessment is to gauge your mastery of the topics in this chapter. If you do not know the answer to a question or are only partially sure of the answer, you should mark that question as wrong for purposes of the self-assessment. Giving yourself credit for an answer you correctly guess skews your self-assessment results and might provide you with a false sense of security.
1. Which of the following parameters can be adjusted on an AP to change the size of its cell or BSA? (Choose all that apply.)
a. Channel number within a band
b. Transmit power
c. Supported modulation and coding schemes
d. Supported data rates
2. An AP has been configured to use channel 1 with a transmit power of 20 dBm. With the AP located in the center of the lobby, you have determined that its signal will reach all locations in the lobby area. However, some users with small battery-operated devices report connectivity problems when they move toward the outer walls of the lobby. Which of the following approaches will probably fix the problem? (Choose two.)
a. Increase the AP’s transmit power to increase its range
b. Increase the client device’s transmit power
c. Adjust the client device’s roaming algorithm
d. Enable some lower data rates on the AP
3. Suppose that an AP is configured to offer the following data rates to its clients: 2, 5.5, 6, 9, 11, 12, 18, 24, 36, and 48 Mbps. Which one of the following strategies should be used to reduce the AP’s cell size?
a. Enable the 1-Mbps data rate
b. Enable the 54-Mbps data rate
c. Disable the 36- and 48-Mbps data rates
d. Disable the 2-Mbps data rate
4. All the APs on the second floor of a building are part of a single ESS. Each AP has been configured with a transmit power level of 14 dBm. In addition, each AP has been configured to use a non-overlapping channel that is different from its adjacent neighbors. All APs have been configured to offer only the 24-, 36-, 48-, and 54-Mbps data rates; all other rates are disabled. One day, one of the APs fails and someone replaces it. Afterward, users begin to call and complain about poor performance and roaming. You discover that the problems are not occurring in the area covered by the replacement AP; instead, they are occurring about two APs away from it. Which one of the following could be causing the problem?
a. The replacement AP has its radios disabled.
b. The replacement AP is using a transmit level of 1 dBm.
c. The replacement AP is using the 1- and 2-Mbps data rates.
d. The replacement AP is new and cannot be causing the problem.
5. Which one of the following determines when a wireless client will roam from one AP to another?
a. The current AP detects a weak signal coming from the client and forces the client to roam.
b. The next AP overhears the client’s signal and asks it to roam.
c. The client’s roaming algorithm reaches a threshold in signal quality.
d. The client loses its IP address.
6. Which one of the following 802.11 frames is used to trigger a roam from one AP to another within an ESS?
a. Association request
b. Disassociation request
c. Probe
d. Reassociation request
7. Which one of the following statements is true about roaming?
a. All wireless clients use the same algorithms to trigger a roaming condition.
b. Wireless clients can scan available channels to look for a new AP when roaming.
c. Wireless clients must roam from one AP to another on the same channel.
d. The 802.11 standard defines a set of roaming algorithms for clients.
8. Which one of the following statements is true about a good wireless LAN design?
a. Neighboring APs should use the same channel to promote good roaming.
b. APs should be positioned so that their cells overlap.
c. APs should be positioned so that their cells do not overlap at all.
d. APs should use channels that overlap each other.
9. When you are designing the AP channel layout for an area, which one of the following is the most important consideration?
a. The number of channels is conserved.
b. APs in different areas use different channels.
c. Adjacent APs use non-overlapping channels.
d. Clients are grouped into common channels.
10. An AP is located in the main office on the third floor of a building. The AP is configured to use channel 6 in the 2.4-GHz band. Which of the following conditions might hinder clients as they move around on the third floor and need to roam? (Choose all that apply.)
a. Two other APs in the third-floor main office area use channel 6.
b. None of the fourth-floor APs directly above the main office use channel 6.
c. One of the second-floor APs directly below the main office uses channel 6.
d. All of these answers are correct.
11. Which one of the following is the best type of wireless LAN survey to perform for a new building that is under construction, where APs have not yet been deployed?
a. Predictive survey
b. Passive survey
c. Active survey
d. Performance survey
12. Suppose you would like to survey the coverage area in a new building to make sure that mobile client devices can associate with APs and roam between them. Which one of the following surveys should you perform?
a. Predictive survey
b. Passive survey
c. Active survey
d. Performance survey
13. To troubleshoot some possible RF coverage issues in a large auditorium, you would like to see a heatmap of every AP (both legitimate and rogue) that can be received at every location. You would also like to see the signal strength of each AP, SNR, and evidence of any co-channel interference. Which one of the following survey types would be best for this purpose?
a. Predictive survey
b. Passive survey
c. Active survey
d. Performance survey
14. The term “AP-on-a-stick” correctly refers to which one of the following?
a. An AP that has a single cable connecting it to the wired network
b. An AP with a single antenna, with MIMO disabled
c. An AP that is mounted on a tall object to determine its cell size
d. An AP that bridges traffic from one SSID to another
15. In an active site survey, how many APs can the survey device associate with and measure at any given time?
a. 1
b. 2
c. 16
d. As many as can be overheard
Foundation Topics
AP Cell Size
The basic service area (BSA) or cell that is provided by an AP can vary, depending on several factors. Obviously, the cell size determines the geographic area where wireless service will be offered. AP cell size can also affect the performance of the APs as clients move around or gather in one place.
Remember that a wireless LAN is a shared medium. Within a single AP cell, all of the clients associated with that AP must share the bandwidth and contend for access. If the cell is large, a large number of clients could potentially gather and use that AP. If the cell size is reduced, the number of simultaneous clients can also be reduced.
The signal from an AP does not simply stop at the boundary of its cell. Instead, the signal continues to expand ad infinitum, growing exponentially weaker. Devices inside the cell boundary can communicate with the AP. Devices outside the boundary cannot because the signal strength of either the client or the AP is too weak for the pair to find any usable modulation that can be used to exchange information. You can control the size of a cell by changing the parameters that are described in the following sections.
Tuning Cell Size with Transmit Power
To use a wireless LAN, devices must be located within the range of an AP’s signal and have an active association with the AP. This area is known as the BSA or cell. Consider the scenario shown in Figure 7-1. PC-1 through PC-4 are within the cell’s perimeter and are associated with the AP. PC-5, however, is outside the cell and cannot form an association or participate in the basic service set (BSS).
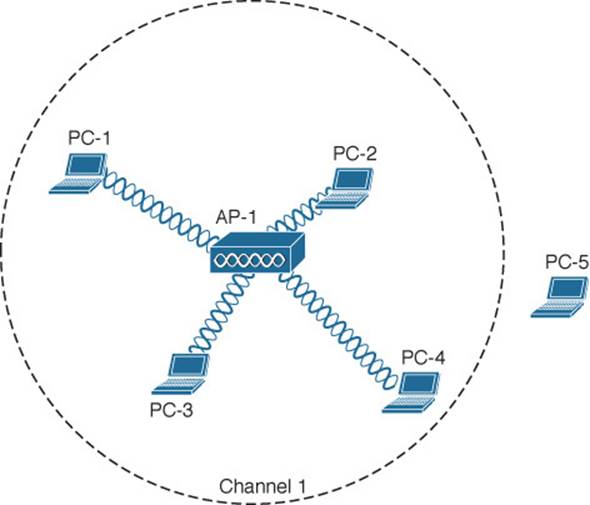
Figure 7-1 Example Cell That Includes All but One Client
If the area outside a cell is a legitimate location where wireless devices might be present, the coverage area should probably be extended there. How can that be accomplished? The most straightforward approach is to increase the transmit power or signal strength leaving the AP’s antenna. A greater signal strength will overcome some of the free space path loss so that the usable signal reaches farther away from the AP.
Figure 7-2 shows the effect of changing the AP’s transmit power level. The original cell from Figure 7-1 is shown as the second concentric circle, where the transmit power level was set to 17 dBm. If the level is increased to 20 dBm, the cell grows into the area shown by the outermost circle. Notice that PC-5 now falls within the cell boundary. If the transmit power level is decreased to 10 dBm, the cell shrinks and includes only clients PC-2 and PC-3. Why would you ever want to decrease a cell’s size? That question will be answered later in this section.
![]()

Figure 7-2 Effects of the Transmit Power Level on Cell Size
How should you decide on a transmit power level value? Cisco APs offer a fixed number of settings on each radio—in the United States, for example, there are eight different values for 2.4-GHz radios and seven values for 5-GHz radios. Most 802.11 scenarios fall within government regulations that limit the effective isotropic radiated power (EIRP) to a maximum transmit power level of 20 dBm (100 mW). You could just configure an AP to run wide open at maximum power, but that is not always appropriate or beneficial.
One thing to consider is the two-way nature of wireless communications. By increasing the AP’s transmit power, the AP might reach a distant client, but can the client’s own signal reach the AP? Notice client PC-5 in Figure 7-3. If the AP transmit power level is increased to 20 dBm (the outermost circle), PC-5 is included in the cell. However, PC-5’s wireless transmitter has a lesser transmit power level; in its current location, PC-5 has a coverage area that falls short of including the AP. This scenario is known as the asymmetric power problem, where the two communicating devices have differing transmit power levels that might prevent them from reaching each other.
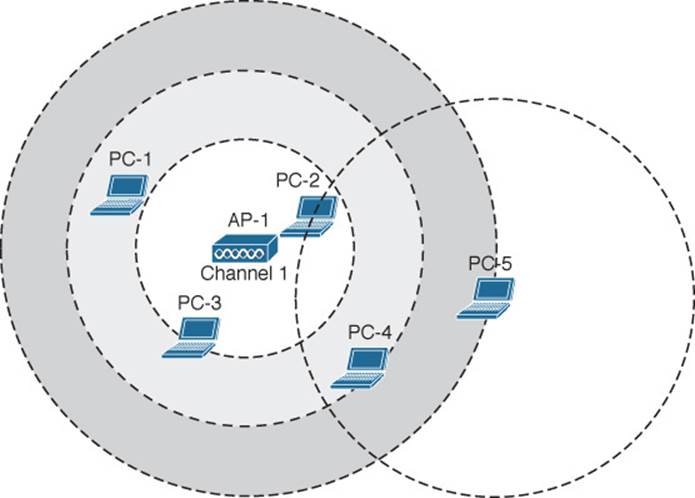
Figure 7-3 Asymmetric Power Problem
Tip
The discussion in this section is focused on setting the transmit power of the AP to an appropriate level. Keep in mind that by doing so, you are ultimately affecting the received signal strength indicator (RSSI) that the client will experience. As you work with wireless LANs, you will always need to tune things to meet requirements at the client location, to provide a quality user experience.
Tuning Cell Size with Data Rates
Setting the transmit power level is a simplistic approach to defining the cell size, but that is not the only variable involved. The cell size of an AP is actually a compromise between its transmit power and the data rates that it offers.
Recall from Chapters 1 and 3 that higher data rates must use more complex modulation and coding schemes (MCSs), which offer the greatest throughput but require the best signal conditions. The signal must be greater than the receiver sensitivity and the signal-to-noise ratio (SNR) must be high enough to support the MCS that is needed for a certain data rate. As the data rates go higher, so must the SNR.
Tip
The data rate can also be raised by increasing the number of spatial streams and the channel width. However, spatial streams can be leveraged only if the physical environment between an AP and a client creates multipath conditions. Each additional spatial stream also requires a higher SNR. Wider channels bring more throughput, but require an even higher SNR.
Usually, a higher SNR translates to having the client located closer to the AP. Less complex MCSs can work further away from an AP, but offer slower data rates. Therefore, at the perimeter of a cell, a client is likely to be using the least complex MCS and the lowest data rate. Figure 7-4 uses concentric circles to show a simplified representation of the range of each data rate used in the 2.4-GHz band. As the client moves away from the AP and the current MCS becomes less reliable, dynamic rate shifting (DRS) selects a less complex MCS. In the figure, the client will probably resort to a 1-Mbps data rate by the time the client reaches the outer edge of the cell.
![]()
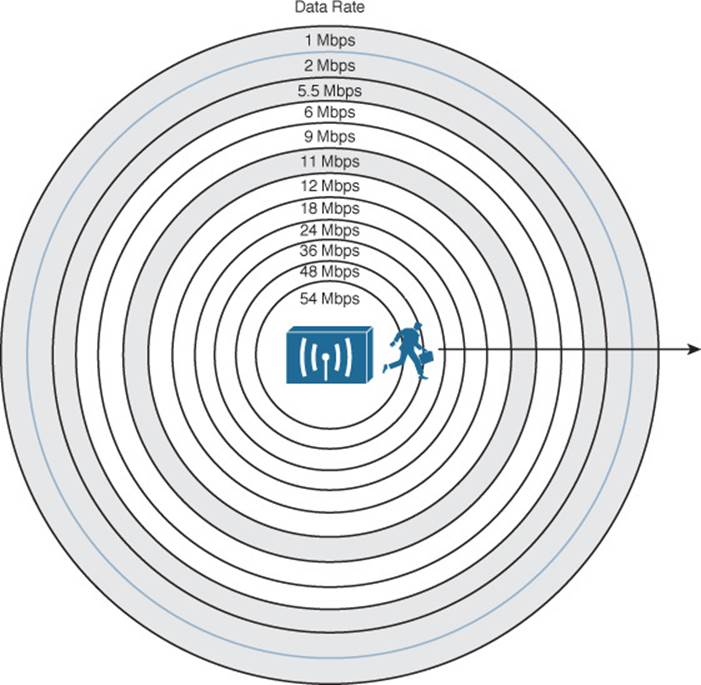
Figure 7-4 Relationship of Data Rates and Cell Range
To design a wireless LAN for best performance, you would most likely need to disable some of the lower data rates. For example, you could disable the 1-, 2-, and 5.5-Mbps rates in the 2.4-GHz band to force clients to use higher rates and better modulation and coding schemes. That would improve throughput for individual clients and would also benefit the BSS as a whole by eliminating the slower rates that use more time on a channel.
As you disable lower data rates, the corresponding outer concentric circles in Figure 7-4 become irrelevant. This effectively reduces the usable size of the AP’s cell, even though the radio frequency (RF) footprint remains the same. After all, you haven’t reduced the transmit power level, which would reduce the extent of the RF energy.
Tip
As smaller usable cells are placed closer together, their available data rates are indeed higher. Be aware that at the same time, their RF footprints can remain large and overlap each other, resulting in a higher noise floor.
Even though Figure 7-4 depicts the 2.4-GHz band, the same principles apply to the 5-GHz band. As a client moves away from an AP, the MCS is stepped down according to the RF conditions at the client’s location. Clients and APs using 802.11n have eight MCS options per spatial stream, while 802.11ac has ten. Figure 7-5 depicts an 802.11ac client as it moves away from an AP. The client might start out using MCS 9 very near the AP, shifting down incrementally through the remaining MCS numbers each time the SNR falls below a corresponding threshold. On the client, you might be able to see this reported as a data rate or an MCS number, both shown in the figure.
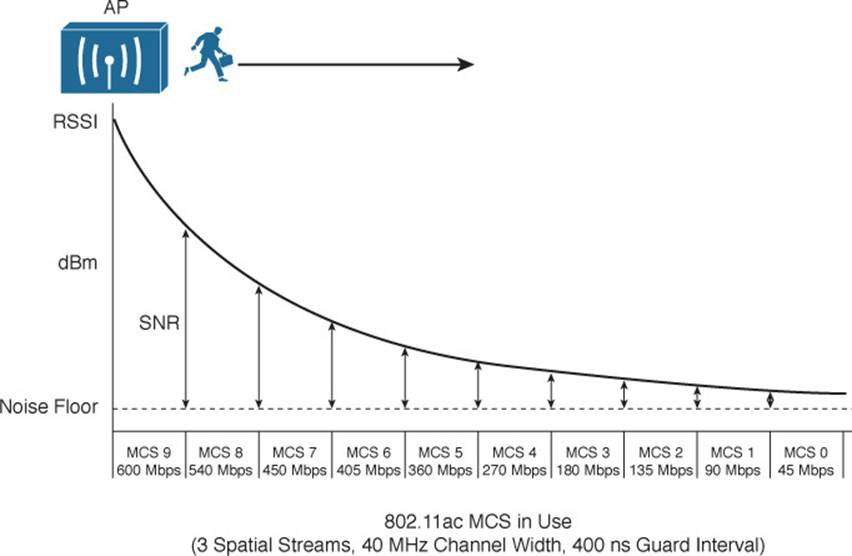
Figure 7-5 Relationship of MCS, Data Rates, and Cell Range for 802.11ac
So far, this section has discussed factors that affect the size of a single AP cell. If you need to cover a large area, such as the entire floor of a building, one cell will not suffice. To provide robust wireless coverage to an ever-increasing area, you should use the following two-pronged approach:
![]() Tune the cell size based on data rates and performance.
Tune the cell size based on data rates and performance.
![]() Add additional APs to build an ESS that covers more area.
Add additional APs to build an ESS that covers more area.
Adding APs requires careful consideration for client mobility and the use of wireless channels. These topics are covered in the next section.
Adding APs to an ESS
If a client is associated with an AP, it can maintain the association as long as it stays within range of the AP. Consider the cell shown in Figure 7-6. As long as the client stays within points A and B, three conditions are met:
![]() The client is able to receive the AP’s signal at an acceptable level.
The client is able to receive the AP’s signal at an acceptable level.
![]() The AP is able to receive the client’s signal.
The AP is able to receive the client’s signal.
![]() One of the acceptable modulations can be successfully used between the client and the AP.
One of the acceptable modulations can be successfully used between the client and the AP.
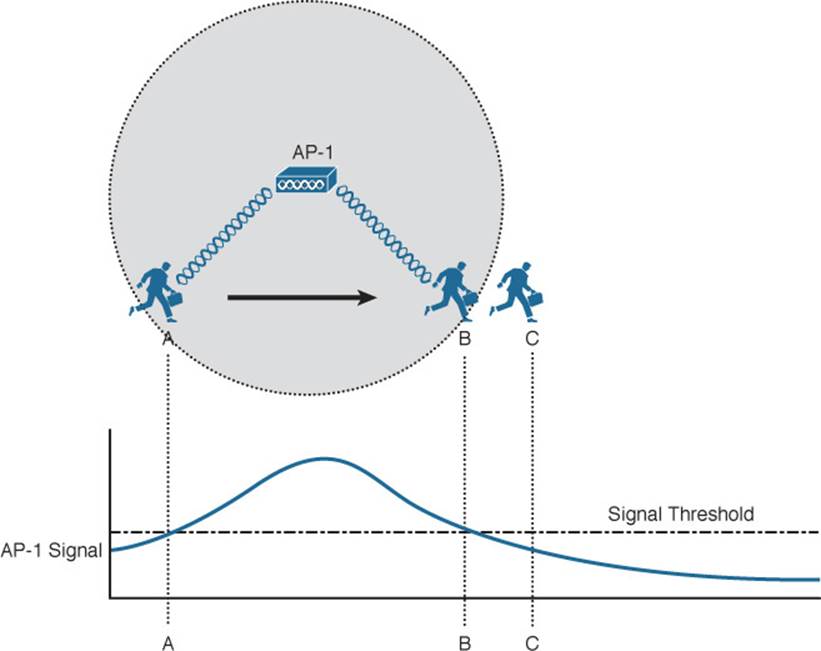
Figure 7-6 Mobile Client Moving Within an AP Cell
As soon as the client goes outside the cell range at point C, one or more of the conditions fail and the client loses the association. In the figure, the AP’s signal has fallen below an acceptable threshold.
Other APs can be added so that the client can move within a larger area; however, the APs must be carefully deployed to allow the client to roam from AP to AP. Roaming is the process of moving an association from one AP to the next, so that the wireless connection is maintained as the client moves.
In Figure 7-7, a new AP has been added alongside AP-1, each using the same channel. It might seem intuitive to build a larger coverage area by using a single channel. Usually this turns out to be a bad idea because the client may experience an excessive amount of frame collisions in the area between the two cells.
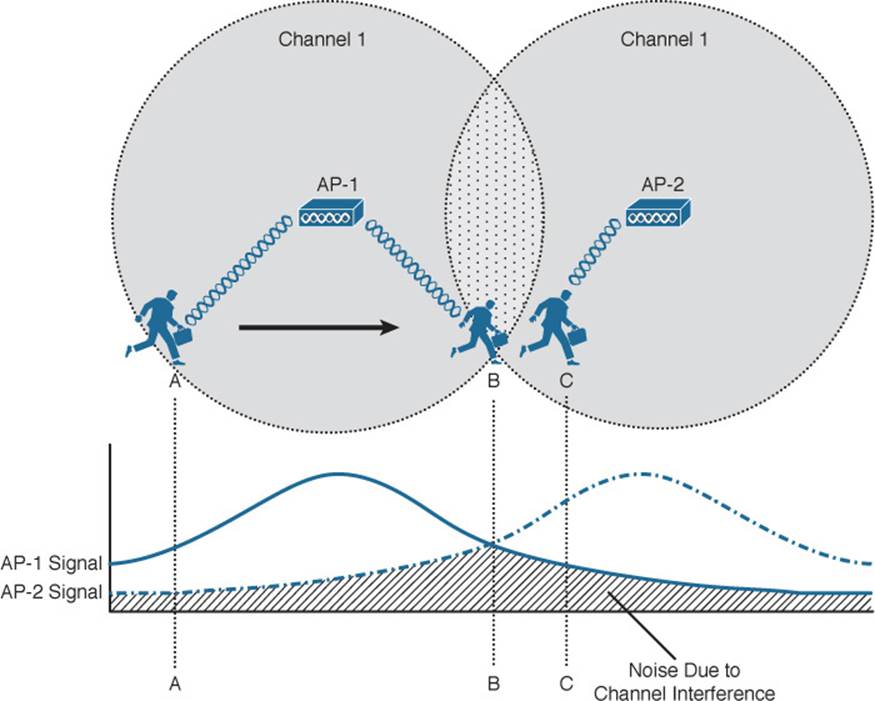
Figure 7-7 Pitfalls of Reusing Channels in Adjacent APs
Remember that the signal from an AP does not actually stop at the edge of the cell; rather, it continues to propagate as it eventually dies off. This is shown by the signal strength graph of each AP. The client is able to form an association with AP-1 at point A. Even at that location, some portion of AP-2’s signal can be received, albeit at a lower level. Because AP-2 is using the same channel as AP-1, the two APs (and any clients within range) can essentially interfere with each other through co-channel interference.
Ideally, when the client in Figure 7-7 moves to location B, it should begin to anticipate the need to roam or transfer its association from AP-1 to AP-2. Notice that AP-1 and AP-2 are spaced appropriately for roaming, where their cells have some overlap. The two APs are out of range of each other, so they are not aware of each other’s transmissions on the same channel. Each AP will coordinate the use of the channel with devices that are inside its own cell, but not with the other AP and devices in the other cell. As a result, the client around location B will probably experience so many collisions that it may never be able to roam cleanly.
The Roaming Process
What enables a client to roam in the first place? First, adjacent APs should be configured to use different non-overlapping channels. For example, an AP using channel 1 must not be adjacent to other APs also using channel 1. Instead, a neighboring AP should use channel 6 or higher to avoid any frequency overlap with channel 1 in the 2.4-GHz band. This ensures that clients will be able to receive signals from a nearby AP without interference from other APs. As you learned in Chapter 2, “RF Standards,” the 5-GHz band is much more flexible in this regard because it has many more non-overlapping channels available. In fact, all channels are spaced such that they will not overlap each other.
The decision to roam is driven by the wireless client driver—not by the AP. Wireless clients decide that it is time to roam based on a variety of conditions. The 802.11 standard does not address this at all, so roaming algorithms are vendor specific. In addition, the roaming algorithms are usually “secret recipes,” so the exact thresholds and conditions are hidden from view. Some of the ingredients in the roaming algorithm are the received signal strength indicator (RSSI), signal-to-noise ratio (SNR), a count of missed AP beacons, errors due to collisions or interference, and so on. These are usually logical choices because they indicate an inferior connection.
Because different clients use different thresholds, some will try to roam earlier than others at a given location within a cell. Some clients will tend to “latch on” to an existing association until the AP can hardly be heard, whereas others will attempt to roam whenever a better AP is discovered. You might find that some client drivers have advanced options that let you select the roaming “aggressiveness,” affecting how quickly the client will try to roam away from an AP association. Figure 7-8 depicts a clean roam between two APs that have been correctly configured with non-overlapping channels 1 and 6. The two AP signal strengths are also shown as a graph corresponding to the client’s location. At location A, the client has a clear signal from AP-1, so it maintains an association with that AP.
![]()
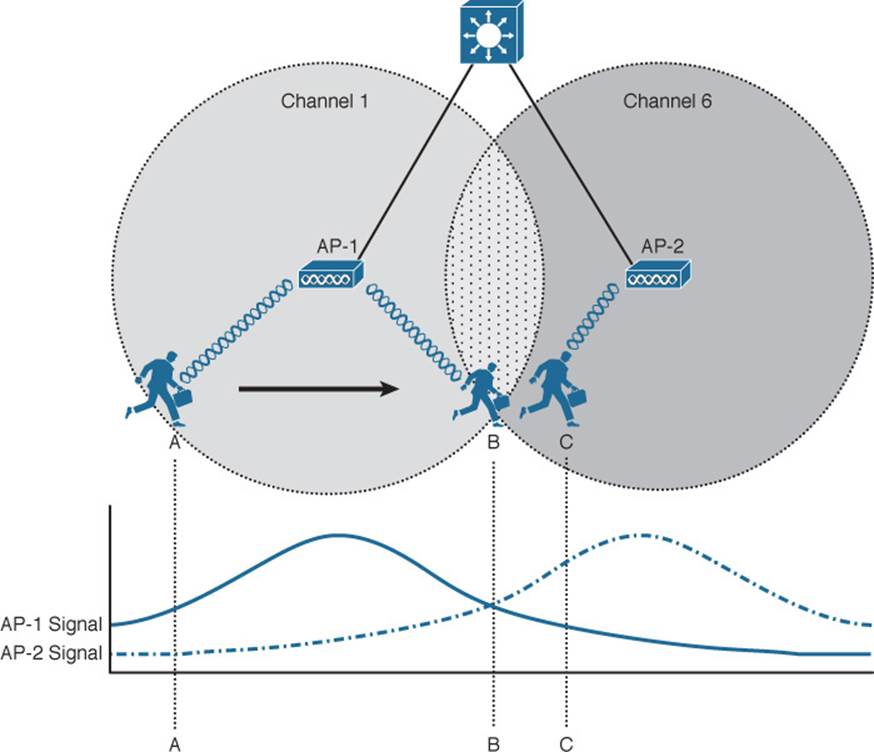
Figure 7-8 Client Roaming Correctly Between Two APs
As the client moves toward location B, it decides that AP-1’s signal is no longer optimal. Somewhere along the way, the client begins to gather more information about any neighboring AP cells. The client can passively scan by tuning its radio to other channels and listening for beacons transmitted from other APs. During the time that the radio is tuned away from the associated channel, the client might lose packets that have been sent to it. A client might use active scanning instead, where it sends probe requests to seek out a better AP where it can move its association. The client does not know what channel is used on the next AP it encounters, so it must send the probes over every possible channel. Again, the client must take time to tune its radio away from the current AP’s channel so it can scan other channels and send probes.
You might think of this as someone watching television. As the current program gets boring or nears its end, the viewer begins to “channel surf” and scans other channels for a better program. One thing to keep in mind: While the viewer is scanning channels, he cannot keep watching the original program. Some of that program will be missed. This is also true of wireless clients. While a radio is scanning other channels, packets arriving on the original channel will be dropped because they cannot be received. Therefore, there is a trade-off between staying available on a single channel and attempting to roam to other APs.
Tip
The 802.11k-2008 amendment, now incorporated into the 802.11-2012 standard, defines a more efficient roaming scheme where a client can ask an AP for a list of other nearby APs. By requesting a list of potential candidate APs in bulk, the client does not have to spend time scanning channels and sending probe requests. This technique is commonly called AP assisted roaming.
After the client is satisfied with all of the beacons or probe responses it receives, it evaluates them to see which AP offers the most potential for a new association. Returning to Figure 7-8, when the client nears location B, it receives a probe response from AP-2 on channel 6. At location C, the client sends a reassociation frame to AP-2 and moves its association to that BSS.
How much should cells overlap each other to promote good roaming? Cisco recommends 10–15 percent overlap for most data applications and 15–20 percent overlap for voice. The idea is to give a client device some continued coverage even after the RSSI of its associated AP falls below a threshold and a roam might be triggered. The client can probe and reassociate with the next AP before it completely loses contact with the previous AP. Seamless roaming is especially important for time-critical applications like voice traffic.
WLAN Channel Layout
The previous section laid the foundation for roaming by describing movement between two AP cells. Most scenarios require more than two APs to cover the appropriate area within a building. Therefore, you need to consider the layout and configuration of more and more APs to scale the design to fit your wireless environment.
For example, to cover the entire area of a warehouse or one floor of a building, APs must be placed at regular intervals throughout that space. A site survey is a vital step toward deciding on AP placement, as actual live measurements are taken with an AP staged at various points in the actual space. This method also takes any factors like free space loss and absorption into account, as the signal strength is measured within the actual environment where clients are located. Site surveys are covered later in this chapter.
To minimize channel overlap and interference, APs cells should be designed so that adjacent APs use different channels. For simplicity and a convenient design constraint, the examples in this section use the three non-overlapping 2.4-GHz channels. The cells could be laid out in a regular, alternating pattern, as shown in Figure 7-9.
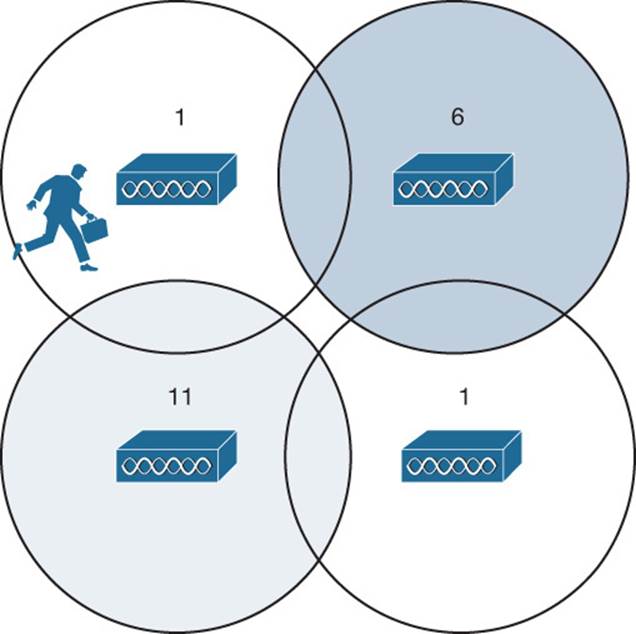
Figure 7-9 Holes in an Alternating Channel Pattern
However, notice what is happening in the center where the cells meet; there is a small hole in RF coverage. If a client roams through that hole, his wireless signal could drop completely. In addition, if the cells were brought closer together to close this hole, the two cells using channel 1 would overlap and begin interfering with each other.
Instead, you should lay the cells out in a “honeycomb” fashion, as shown in Figure 7-10. This pattern is seamless, leaving no holes in coverage. In addition, notice how the two cells using channel 1 are well separated, providing isolation from interference. As far as ordering channels in the pattern, there are several different variations using combinations of the three channels, but the result is basically the same.
![]()
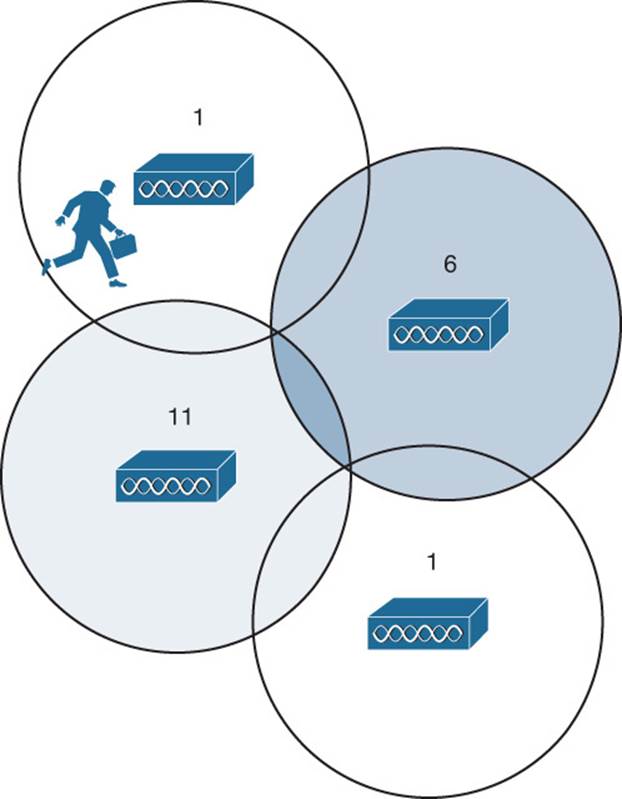
Figure 7-10 Better Alternating Channel Pattern
Notice that as the client shown in the channel 1 cell moves around, it will roam into adjacent cells on different channels. For roaming to work properly, a client must be able to move from one channel into a completely different channel.
Alternating channels to avoid overlap is commonly called channel reuse. The basic pattern shown in Figure 7-10 can be repeated to expand over a larger area, as shown in Figure 7-11. Naturally, this ideal layout uses perfect circles that are positioned regularly across the building. In practice, cells can take on different shapes and the AP locations may end up being irregularly spaced.
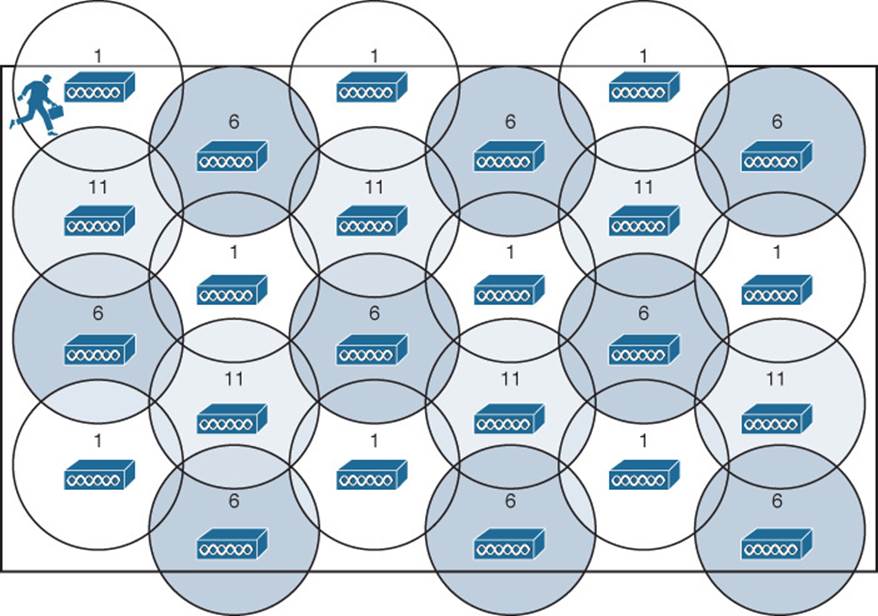
Figure 7-11 Channel Reuse Over a Large Area
So far, only the channel layout of a two-dimensional area has been discussed. For example, Figure 7-11 might represent only one floor of a building. What happens when you need to design a wireless LAN for multiple floors in the same building?
Recall that an RF signal propagating from an antenna actually takes on a three-dimensional shape. With an omnidirectional antenna, the pattern is somewhat like a donut shape with the antenna at the center. The signal extends outward, giving the cell a circular shape along the floor. The signal also extends upward and downward to a lesser extent—affecting AP cells on adjacent floors as well.
Consider the building with three floors shown in Figure 7-12. The same two-dimensional channel layout from Figure 7-11 is being used on the first floor. The floors in the figure are shown greatly separated, so that you can see the channel patterns and numbers. In reality, the cells on adjacent floors would touch or overlap, just as adjacent cells on the same floor do.
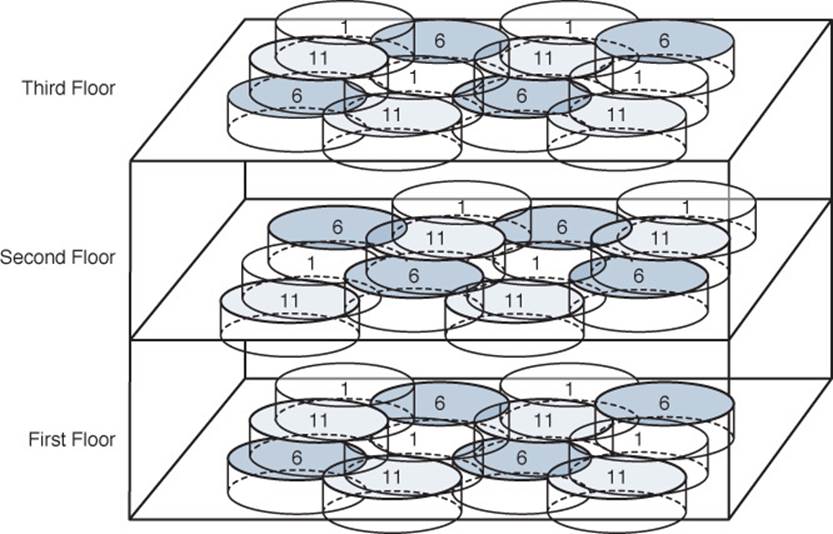
Figure 7-12 Channel Layout in Three Dimensions
The pattern of alternating channels exists within the plane of a floor and between floors. It is easy to think of RF signals traveling in two dimensions over the area of one floor, when they actually travel in three dimensions. This means that signals may pass through the floor and ceiling materials into adjacent floors, after being somewhat absorbed or attenuated by the materials. In theory, channel 1 on the first floor should not overlap with channel 1 directly above it on the second floor or below it in the basement.
When you consider each of the tasks involved in designing and maintaining a wireless LAN, it can really become a puzzle to solve. The cell size, transmit power, and channel assignment all have to be coordinated for each and every AP. Roaming also becomes an issue on a large scale, if mobile clients are able to move throughout an entire campus wireless network.
The good news is that Chapter 13, “Understanding RRM,” explains how to solve many of these puzzles automatically.
Designing and Validating Coverage with Site Surveys
In the previous sections, you learned about the parameters you can adjust to affect the size of a BSS or AP cell. Those parameters are all configured at the AP to determine how far its signal will reach toward client devices and what potential data rates will be available. If you simply adjust the AP parameters with no other input, how can you know that clients within an area surrounding an AP will actually be able to use a certain data rate? Or will clients be able to associate with the AP at all? You also learned about selecting and reusing channels when multiple APs are located in the same geographic area. How can you know that the APs do not overlap on the same channel or that clients can use the APs in every possible location?
To verify wireless LAN coverage and performance, you have to shift your perspective toward that of a wireless client. Site surveys offer a way to either predict or actually take measurements of the RF conditions that a client experiences at various locations within the wireless coverage area. Site surveys usually produce colored heatmaps that depict things like signal strength, SNR, data rates, and so on, that are superimposed on actual floor plans or maps. In the following sections, you will learn more about the different types of site surveys and the tools you can use to produce them.
Applications and Their Requirements
To verify wireless coverage and performance, it is important to have an idea about what you want to measure and what target you are trying to hit. For example, suppose you want to verify that a wireless user sitting in a classroom will have an acceptable wireless experience. What signal strength should you expect to find at that user’s seat? What SNR is acceptable there? What typical data rates are needed for that user?
Beyond that, suppose the entire classroom fills with other wireless users. How many users can associate with one AP without dragging down the performance? Now suppose that the wireless client becomes mobile and moves around the building. Will the client be able to roam and maintain a connection regardless of his location? What if the client is a wireless phone or a video device? Will the voice or video stream be acceptable as the client roams?
To answer these questions, you should begin by becoming familiar with the devices and applications that will be used in the wireless environment. Make a list of requirements for each type of device, including the following information:
![]() Type of device—Smartphones, laptops, tablets, wireless phones, RFID tags, and so on, including manufacturer and operating system
Type of device—Smartphones, laptops, tablets, wireless phones, RFID tags, and so on, including manufacturer and operating system
![]() Wi-Fi capabilities—Supported protocols (802.11b/g/n/a/ac), number of spatial streams, maximum transmit power, and roaming aggressiveness (if known).
Wi-Fi capabilities—Supported protocols (802.11b/g/n/a/ac), number of spatial streams, maximum transmit power, and roaming aggressiveness (if known).
![]() Throughput and jitter requirements—Most devices will make use of “normal” data that has no special requirements or expectations other than what the users consider to be decent responsive throughput. Wireless devices that support voice or video communication will usually have a limit on the acceptable amount of jitter. As well, these devices will need seamless roaming so that the voice or video calls are not dropped or interrupted as the clients move around.
Throughput and jitter requirements—Most devices will make use of “normal” data that has no special requirements or expectations other than what the users consider to be decent responsive throughput. Wireless devices that support voice or video communication will usually have a limit on the acceptable amount of jitter. As well, these devices will need seamless roaming so that the voice or video calls are not dropped or interrupted as the clients move around.
Tip
Client throughput will likely leverage the MIMO capabilities of 802.11n and 802.11ac. Remember that multiple spatial streams require multiple paths to reach their destination. Indoor environments with offices, hallways, and large furniture are usually good places to support multipath. You won’t necessarily be able to measure or survey multipath conditions though; MIMO is usually difficult to predict or measure with most site survey tools.
Sometimes real-time location services (RTLS) are needed to automatically determine the location of wireless devices. RTLS can be used to track assets like healthcare equipment, to track rogue devices that might be causing problems on the network, to locate sources of wireless interference, and to track the locations of wireless clients within a building or campus. A device is located by triangulating the RSSI from several APs that can receive its signal.
When location-based services are required, it is usually best to change the AP layout within a floor of a building. The outermost APs should be placed near the perimeter of the building to improve the triangulation results.
You should also use a critical eye as you walk through a building before you begin a design or site survey. It is one thing to select AP locations on a two-dimensional floor plan; it is quite another to find suitable locations for every AP in the actual building. For example, your proposed location for an AP might coincide with an obstruction such as a large air duct, concrete pillar, lighting fixture, and so on. The location might also end up in an area that has a vaulted ceiling or is open to the floors above it. Even worse, the building owner might not want any of the APs to be visible, preferring that you hide them from view.
The CCNA Wireless exam requires you to have a good working knowledge of wireless site surveys. The exam may not require you to know how to perform a site survey, but you should be able to gather information about an environment and know what to expect from a survey.
Site Survey Types and Tools
To perform a site survey, you will need a way to gather data about RF parameters at each location within an area of interest. You could use a brute-force approach and collect the data manually, moving from one location to another while recording volumes of data about the RSSI, SNR, channel, modulation, data rates, and so on—for each AP that can be received. Instead, your site survey work will be much more efficient if you use a software tool that is designed for site surveys.
Site survey tools can be grouped into three basic categories based on their installation base:
![]() Standalone—Survey applications that are typically installed on a laptop and used offsite or carried onsite
Standalone—Survey applications that are typically installed on a laptop and used offsite or carried onsite
![]() Server-based—Survey applications that are installed on a stationary server and are usually part of a larger integrated package that includes WLAN management tools
Server-based—Survey applications that are installed on a stationary server and are usually part of a larger integrated package that includes WLAN management tools
![]() Cloud-based—Survey applications that can be used for designing or predicting actual survey results without collecting RF data
Cloud-based—Survey applications that can be used for designing or predicting actual survey results without collecting RF data
The following are the three basic types of site survey that you can perform as you plan and deploy a wireless network:
![]()
![]() Predictive survey—Analyze the environment to select AP locations when no APs have been deployed yet; also called planning survey.
Predictive survey—Analyze the environment to select AP locations when no APs have been deployed yet; also called planning survey.
![]() Passive survey—Analyze information that is overheard by listening to existing APs as you move throughout an area.
Passive survey—Analyze information that is overheard by listening to existing APs as you move throughout an area.
![]() Active survey—Analyze the survey device itself as it interacts with the APs as you move throughout an area, in order to gauge the correct cell size. An active survey is also used to associate with APs that are already in production to measure cell size and gauge how the survey client interacts with the APs during live associations and roaming.
Active survey—Analyze the survey device itself as it interacts with the APs as you move throughout an area, in order to gauge the correct cell size. An active survey is also used to associate with APs that are already in production to measure cell size and gauge how the survey client interacts with the APs during live associations and roaming.
Table 7-2 lists the survey types along with examples of the different types of survey tools.
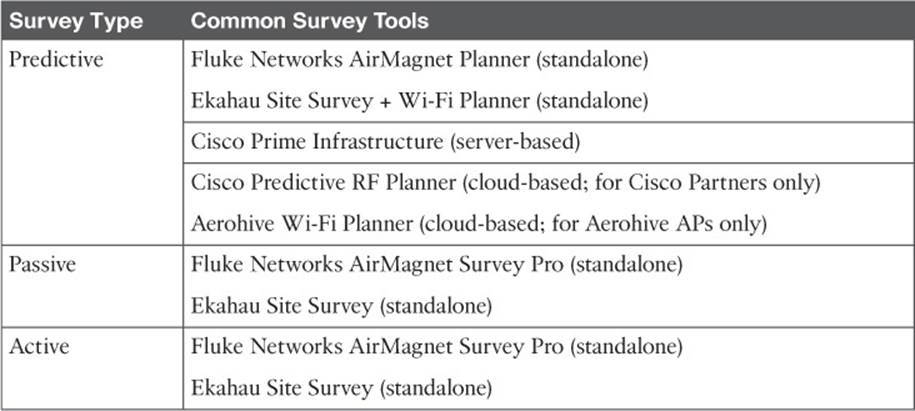
Table 7-2 Wireless Survey Types and Tools
You can also use a spectrum analyzer to detect and identify any sources of interference you might encounter in the wireless coverage area. You can use tools like AirMagnet Spectrum XT (airmagnet.com) or MetaGeek Chanalyzer (http://metageek.com) to gather data and analyze RF spectrum activity. Cisco APs can be configured as remote spectrum sensors that software like Chanalyzer and Cisco Spectrum Expert can leverage to import RF spectrum data.
To prepare for the CCNA Wireless exam, you should understand the purpose of each survey type, when it should be used, and the basic process of carrying it out. Each survey type is described in the sections that follow.
Tip
Performing a site survey can be an involved process that requires a thorough knowledge of the survey tools. If that sounds like it could be a course and exam all to itself, you’re right—Conducting Cisco Unified Wireless Site Surveys (CUWSS, exam 642-732) or Wi-Fi Design (WIDESIGN, exam 300-360) is one component of the CCNP Wireless certification track.
Predictive or Planning Surveys
Suppose you would like to offer Wi-Fi in a building or an outdoor area where no APs currently exist. How could you figure out how many APs to purchase and where to mount each one? You might have gained some prior knowledge or rules of thumb about AP signal strength by noticing how many bars are shown on a smartphone or laptop as you move past an AP. For example, maybe you realized that a device maintained connectivity in a setting where the APs were spaced some distance apart. You could then hope that your new area would have good coverage by mounting APs in a matrix, spaced 40 feet apart. That approach sounds simple, but is not very scientific. At the least, it does not take into account any effects that the building construction materials or large objects might have on the RF signals.
A better approach would be to conduct a planning or pre-deployment survey. In a nutshell, the survey tool uses a diagram of the coverage area and knowledge of any materials such as walls, doors, and other large objects to calculate the signal strength that a client might experience at any location within the area. The end result is a heatmap where colors are superimposed over the area diagram to represent quantities like signal strength, data rates, and so on. Because all of this information is computed based on the RF propagation from every AP, you end up with a useful representation of the actual RF coverage that a real user might experience. The survey also computes the number of APs needed to cover the area.
As an example, the ESS tool is used to perform a planning survey on a large area of a building floor. A floor plan is imported and calibrated, then walls are drawn over the wall lines in the plan. The survey tool offers a wide selection of wall materials, each having a specific attenuation in dBm, as shown in Figure 7-13. The RF coverage area is marked on the plan, then the coverage parameters (minimum usable RSSI, 802.11 band, client density, and so on) are set. The tool computes the number of APs that are needed, then computes a heatmap of the resulting signal strength over the entire coverage area. In Figure 7-14, the tool has chosen and placed eight APs in default locations. You can manually drag the APs to different locations if needed.
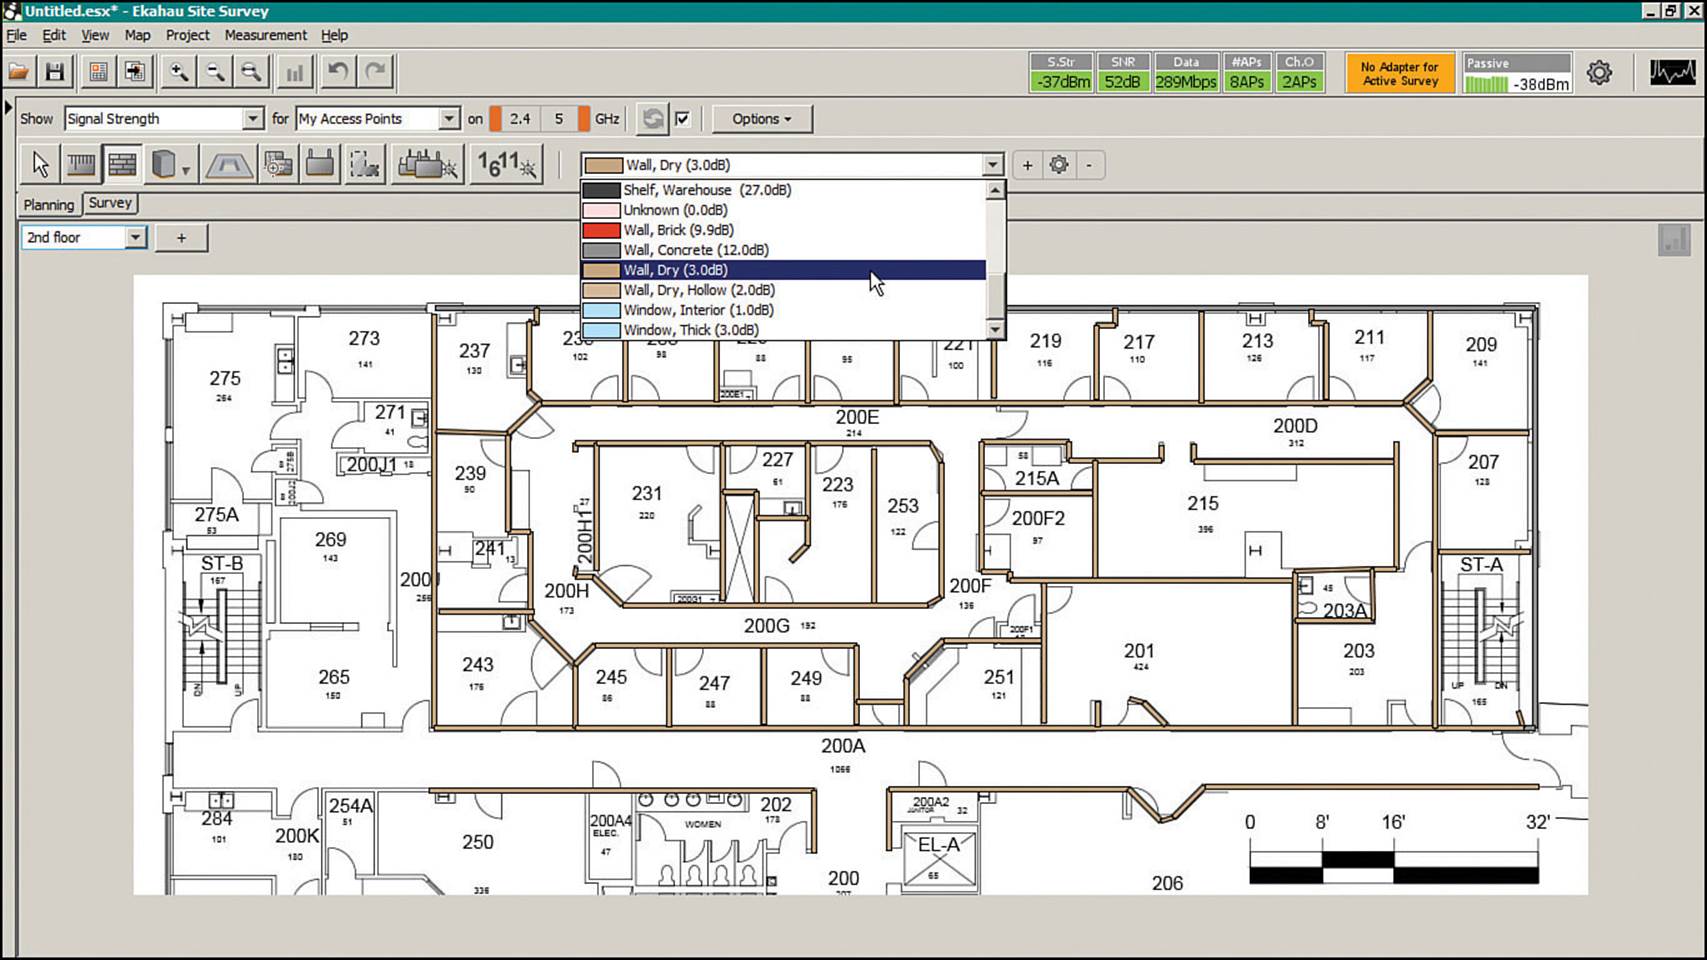
Figure 7-13 Beginning Predictive Survey with Wall Material Identification
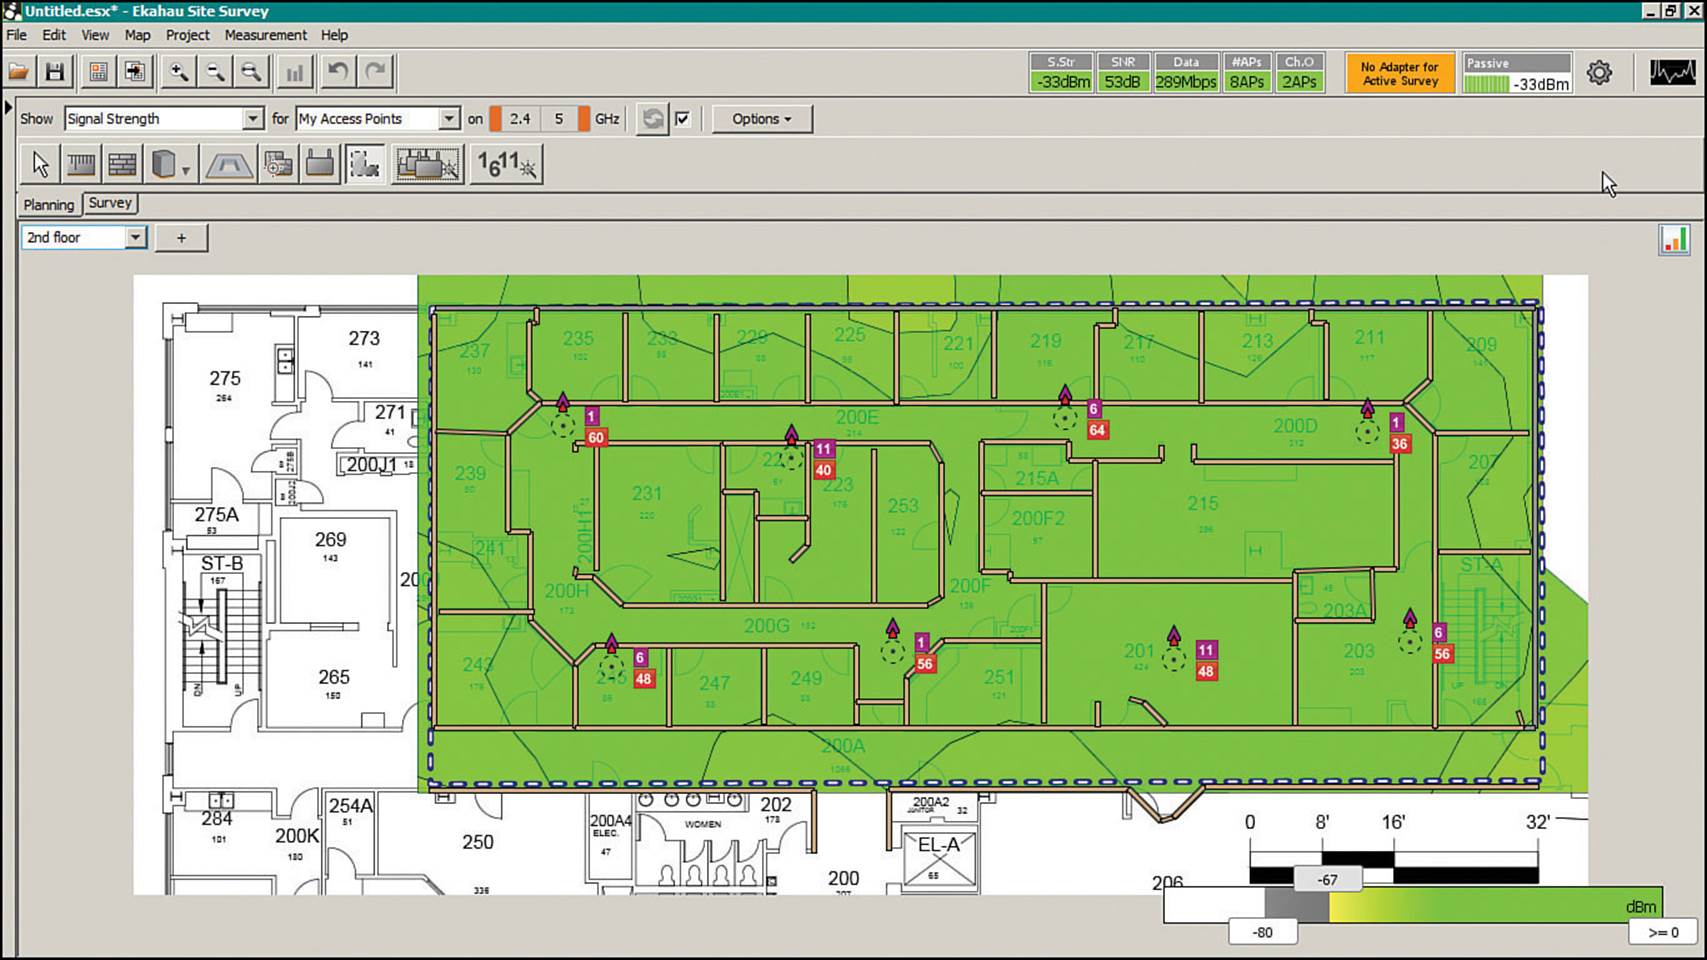
Figure 7-14 Predictive Survey Results with Eight APs
Passive Site Surveys
To measure the effects of any existing APs in an area, you can use a site survey tool to perform a passive site survey. As its name implies, the survey tool passively scans through the wireless bands and channels to listen for any AP that sends a beacon or a probe response frame. The tool records the APs overheard, including their BSSIDs, RSSI, SNR, channels, and many other parameters, for each location in the survey area. That information is presented as a heatmap superimposed on the building floor plan or outdoor map, as shown in Figure 7-15.
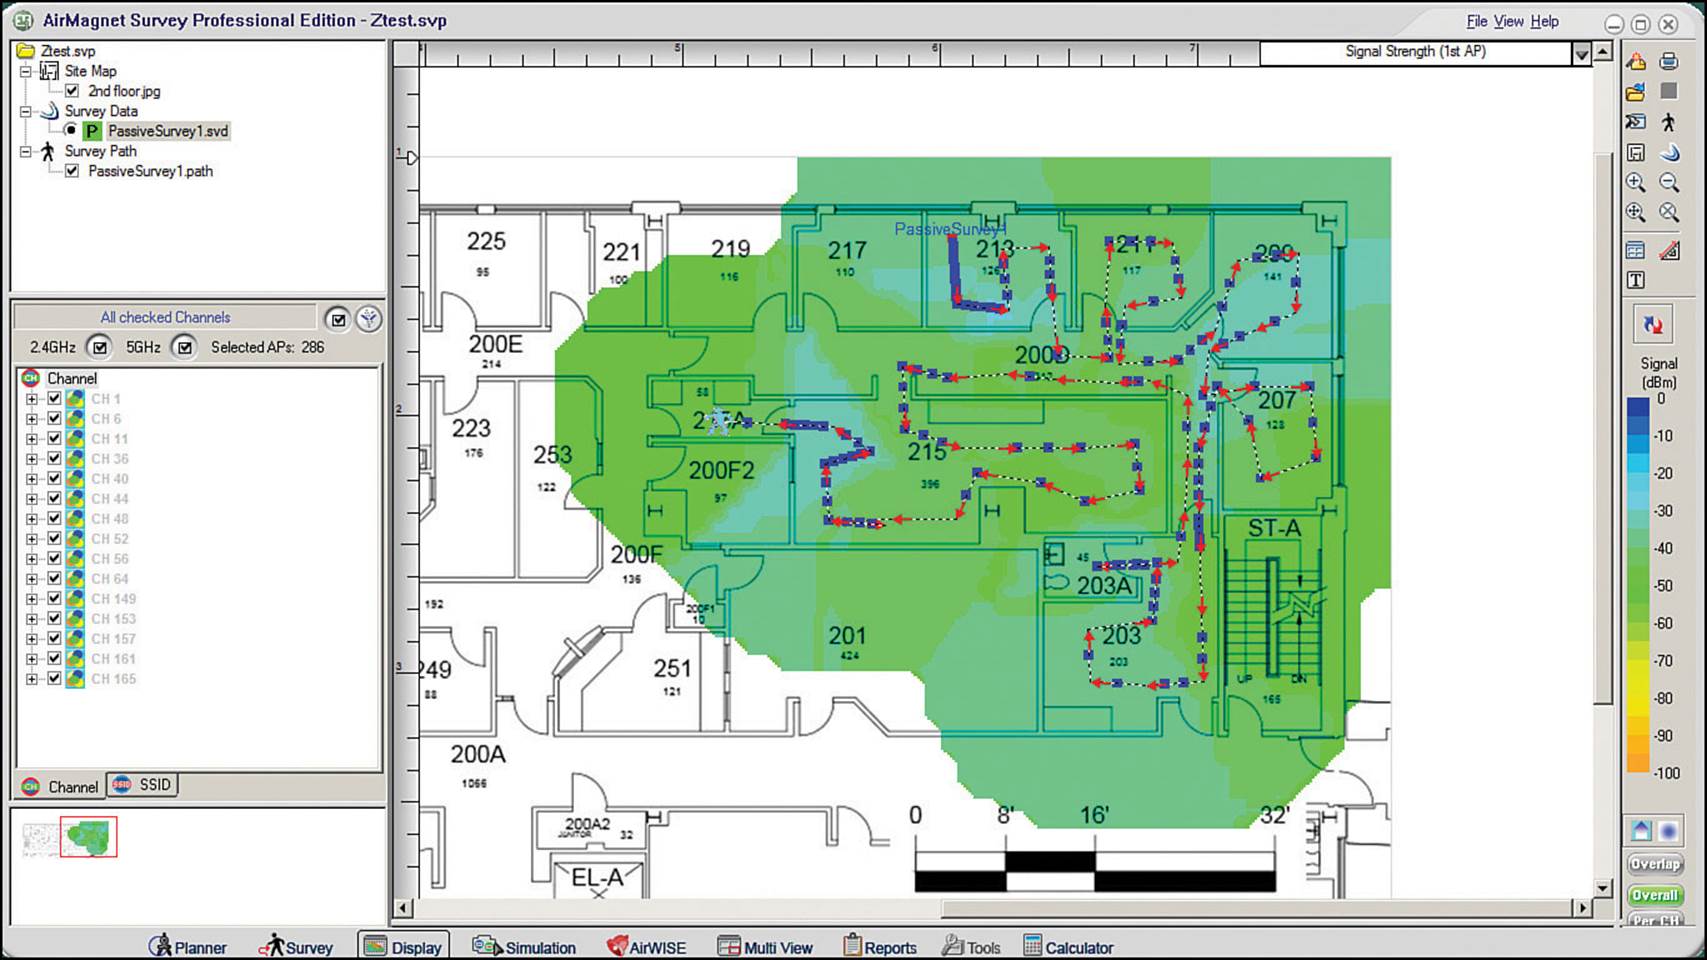
Figure 7-15 Performing a Passive Site Survey
To perform the survey, the user must load a map showing the area to be surveyed and define the map’s scale. Once the survey is initiated, the user clicks her current location, then walks methodically through the area as the survey tool collects signal and RF data at each location. The tool can operate in one of two modes: click-and-go or continuous scan. In click-and-go mode, the user clicks each location where a sample should be taken, walks to the next position, clicks for another sample, and so on. In continuous scan mode, the user clicks once to start data collection, then clicks again at the end of a straight walking path. Between clicks, the tool automatically samples at regular intervals, simplifying the user’s interaction.
The end result is a heatmap like the one displayed in Figure 7-15, which also shows the path that the user walked during the survey. Notice how the user walked into and around each room and hallway within the area surveyed. Each dash or dot along the path represents a data sample. The survey tool (AirMagnet Survey in this case) calculates the RF parameters that might be received at every other location on the heatmap. The overall signal strength is shown in the figure, although you can display many other views, too.
Remember that a passive site survey is useful for gauging the apparent RF coverage over an area and for identifying APs (both legitimate and rogue). All measurements are taken by listening only; the survey tool never actually associates with any of the APs. Therefore, a passive survey will not reveal any information about actual data rates, throughput, or roaming activity from a client perspective.
Tip
Passive surveys base everything on listening to beacon frames sent by APs. Remember that beacons are management frames and are sent at the lowest mandatory data rate that the AP supports. As a result, the beacons might be received at a greater distance from the AP than regular data frames used by associated clients. In other words, passive site surveys are useful as initial or cursory surveys or in troubleshooting scenarios.
Active Site Surveys
Predictive surveys are usually based around theoretical calculations and not actual measurements. You can add a level of accuracy by taking some coarse measurements with an actual AP. The AP is mounted on a tripod, ladder, or pole, at the same height it would be mounted when deployed. Power is applied to the AP and signal strength measurements are taken by walking toward and away from the AP until the desired cell edge is determined. Then the AP is moved where the center of an adjacent cell is expected to be and more cell edge measurements are taken. Because the AP is mounted on a pole or stick, this survey method is commonly called AP-on-a-stick. Because the survey is done by associating to a live AP, the survey process is called an active survey.
The idea behind an AP-on-a-stick survey is to choose a starting point in the coverage area, determine the first cell boundary, then move the AP and measure other cells until the entire area has been covered. More specifically, you would determine the edge of the cell boundary to be when the AP’s signal falls to –67 dBm. Then you would move the AP to a new location where its cell overlaps the previous cell by 20 percent, then move the AP again, and so on. Some people choose the initial starting location to be in one corner of the coverage area, while others will choose a place that is next to a hard obstacle, such as a stairwell, bathroom, or elevator shaft, or where an AP is certain to be located.
Figure 7-16 illustrates this process, beginning with location 1. Once the survey is complete, you will have a good idea of the overlapping cells, as well as the number and location of the APs that are needed.
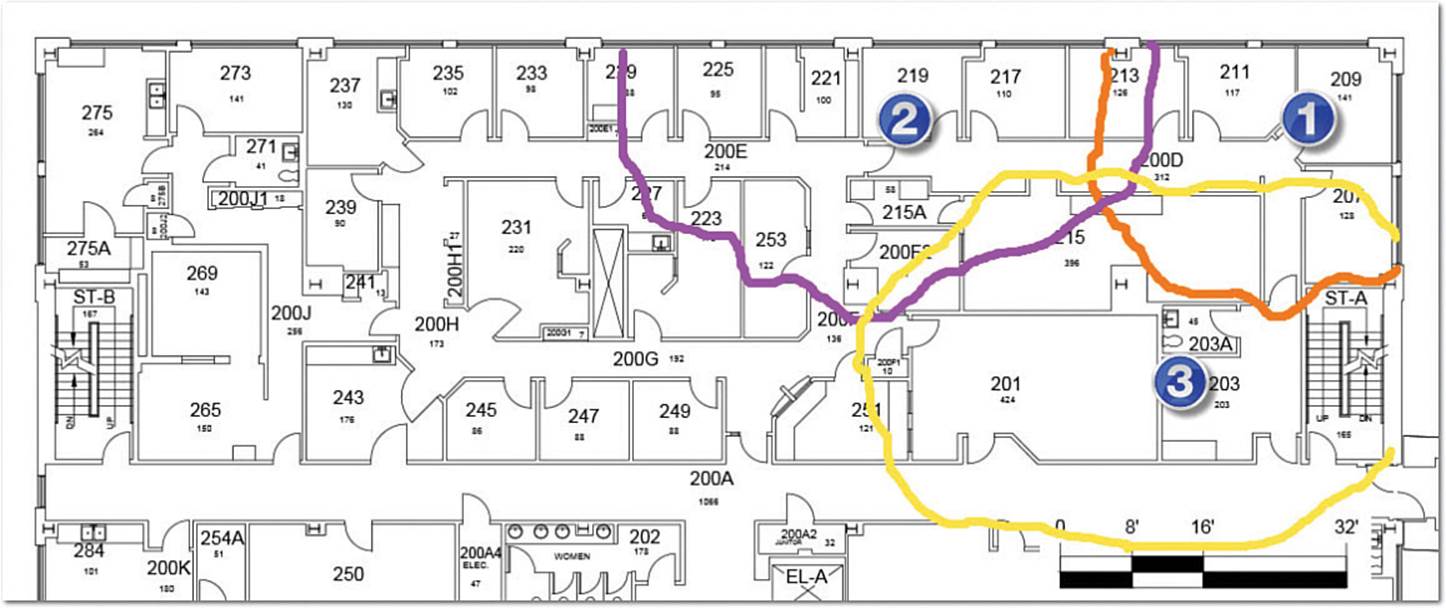
Figure 7-16 Sequence of AP Locations in an AP-on-a-Stick Survey
AP-on-a-stick surveys can produce realistic results taken in the actual physical environment of the coverage area. As you might imagine, it is also a time-consuming and tedious process.
A passive site survey offers a wealth of information about RF conditions and the availability of APs throughout an area, but it does not reveal how an actual client device would behave or perform with the APs. To add a client’s perspective, you can perform a full active site survey.
In an active site survey, the survey device acts as a regular wireless client by associating to an AP. As the survey device is carried throughout the survey area, it is free to associate and roam. Measurements of the client’s associations, data transmissions, and roaming activity are recorded as they occur.
An active site survey begins much like a passive survey. A plan of the survey area is imported into the survey tool and calibrated, and then the survey user begins walking on a path through the area. The survey client can be configured for one of two active survey methods:
![]() BSSID method—The survey is locked to a specific BSSID so that the client stays associated to a single AP, to measure a single cell.
BSSID method—The survey is locked to a specific BSSID so that the client stays associated to a single AP, to measure a single cell.
![]() SSID method—The client can associate and roam to any AP as needed—all over a consistent SSID.
SSID method—The client can associate and roam to any AP as needed—all over a consistent SSID.
Figure 7-17 shows an example of an active site survey. A heatmap depicting the RSSI of the associated AP is shown along with the survey path.
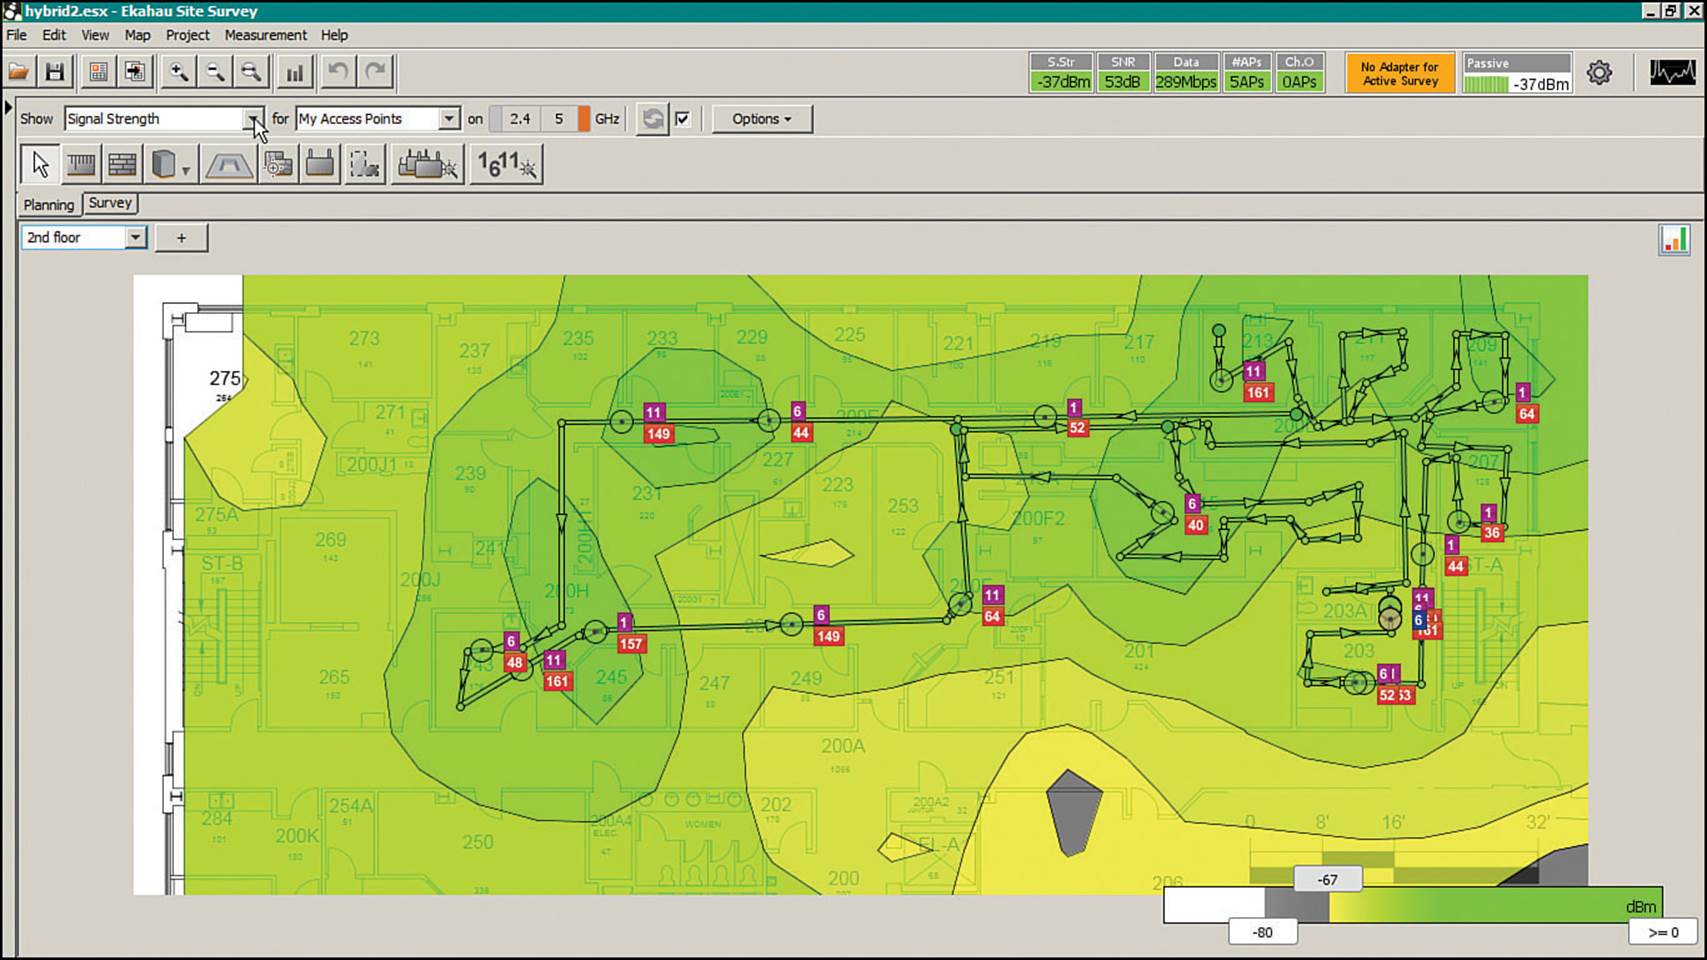
Figure 7-17 Displaying AP Signal Strength in an Active Site Survey
An active survey might also ping a target IP address at regular intervals to measure the round-trip time as the survey progresses. Figure 7-18 shows an active survey heatmap that displays ping round-trip times that were measured and extrapolated over the surveyed area. As well, the survey tool can leverage the iperf tool to send data streams between the survey device and an iperf server to gauge the actual throughput over the wireless network.
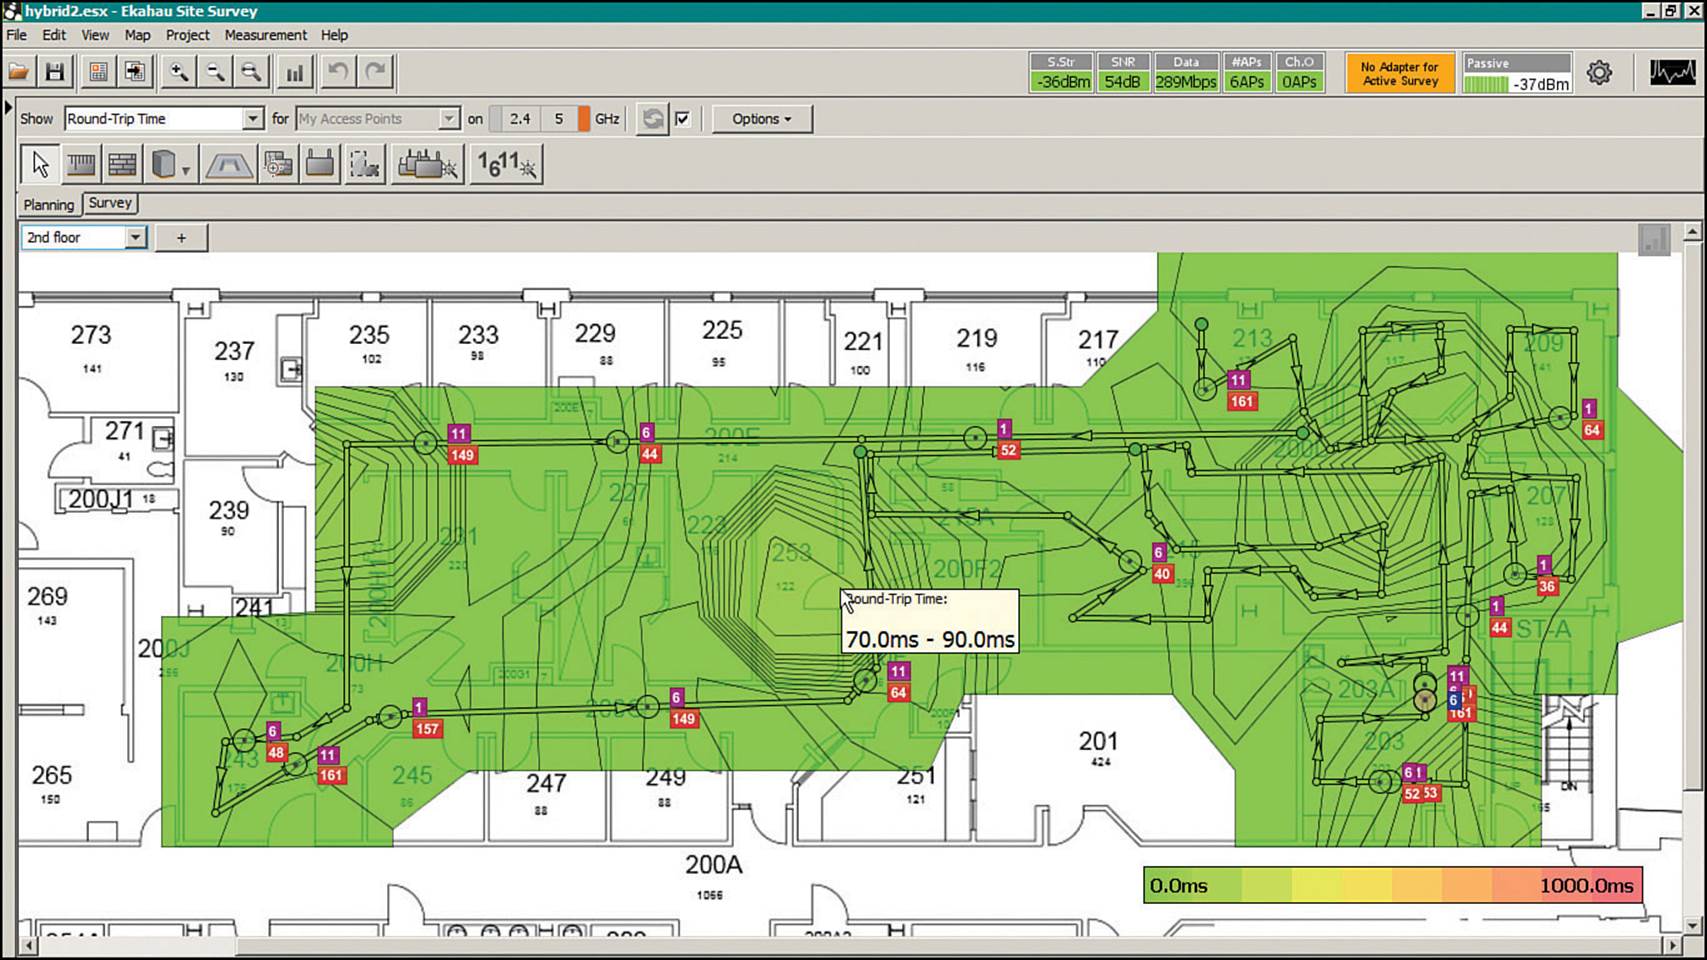
Figure 7-18 Displaying Ping Round-Trip Times Measured in an Active Site Survey
An active site survey also records each AP that the survey device associates with. The associated AP data can be presented in a heatmap, as shown in Figure 7-19. Each color represents a unique AP, so you can easily see where the survey client roamed by noticing where the color changes along the survey path.
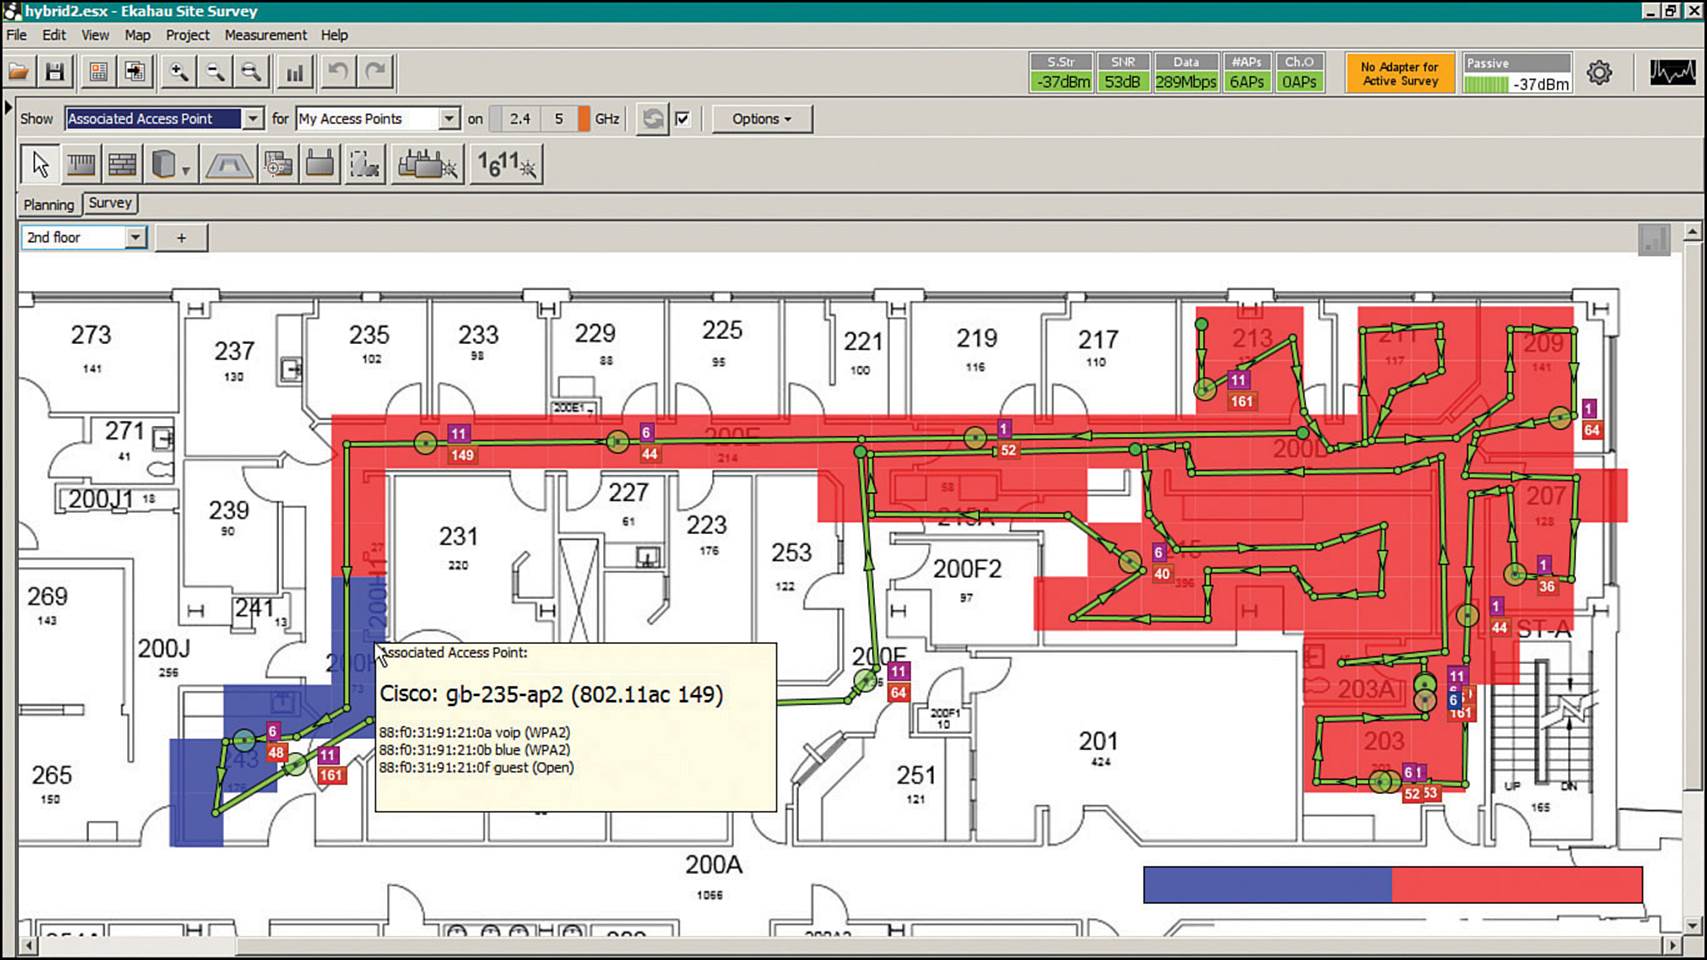
Figure 7-19 Displaying Client Roaming Behavior in an Active Site Survey
Tip
An active site survey uses the survey device as an actual wireless client, so the measurements taken from it represent the behavior of the device’s wireless adapter, antenna, driver, and operating system. The survey results may not necessarily match the behavior of a different client device and software.
Developing a Complete Survey Strategy
Now that you have gotten a taste of the predictive, passive, and active surveys, what is the best practice for using them? A new network deployment has three distinct phases, as listed in Table 7-3: pre-deployment, deployment, and post-deployment, all named for their relation to APs being installed or deployed.
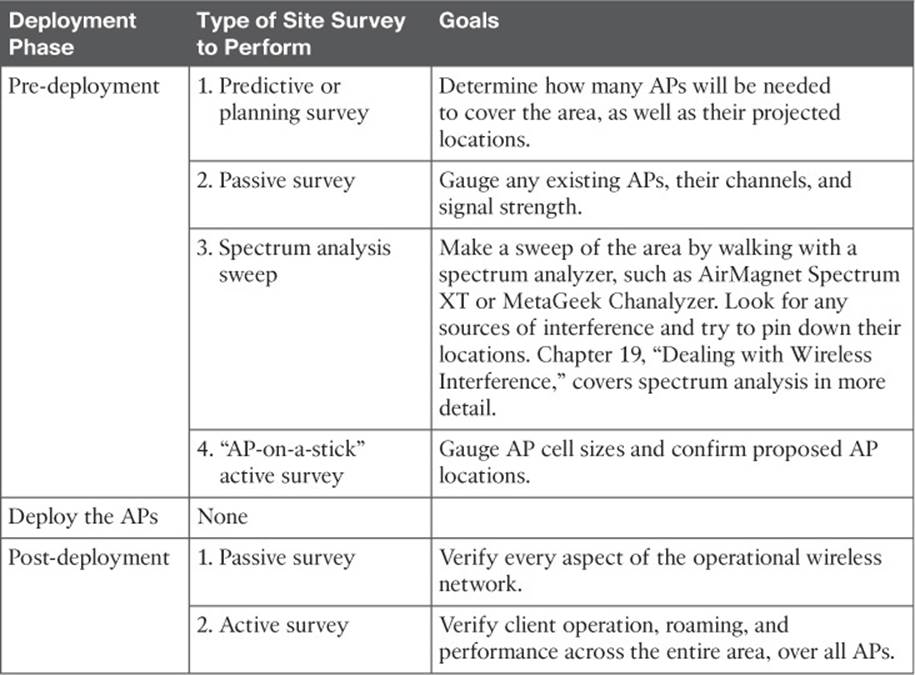
Table 7-3 AP Deployment Phases and Relevant Survey Types
The pre-deployment phase can be the most extensive because you need to plan for your AP layout, gauge any existing APs or interferers, then validate your design. Notice how many different survey types are involved—predictive, passive, spectrum analysis, and active. Each of these could require a complete walking pass through the entire coverage area, as well as a significant investment in time and effort. You can reduce the amount of work if a survey begins to produce acceptable results. For example, if the active AP-on-a-stick survey verifies your predictive design and AP layout after a few initial AP locations, then you might decide that no further results are needed.
Post-deployment is focused on verifying that the new AP deployment meets all of the requirements for acceptable service and performance. The post-deployment phase involves a passive survey and an active survey over the entire coverage area. The goals are to verify RF coverage, cell and channel overlap, SNR, noise floor, and bleed-through between floors and to check for rogue APs and interference sources. At this phase, it is very important to make sure the wireless network works properly before it is put into production.
Tip
Passive and active surveys normally require two separate passes through an area to collect their data. Some standalone survey tools support a hybrid survey model and can perform both passive and active surveys in a single pass. This requires multiple wireless adapters that can be dedicated to each type of survey.
Exam Preparation Tasks
As mentioned in the section, “How to Use This Book,” in the Introduction, you have a couple of choices for exam preparation: the exercises here, Chapter 21, “Final Review,” and the exam simulation questions on the DVD.
Review All Key Topics
Review the most important topics in this chapter, noted with the Key Topic icon in the outer margin of the page. Table 7-4 lists a reference of these key topics and the page numbers on which each is found.
![]()

Table 7-4 Key Topics for Chapter 7
Define Key Terms
Define the following key terms from this chapter and check your answers in the glossary:
active site survey
AP-on-a-stick
asymmetric power problem
BSSID method
channel reuse
passive site survey
post-deployment site survey
pre-deployment site survey
predictive survey
SSID method
Site Survey Type and Application Highlights
You can use Table 7-5 to review the various survey types, their applications, and purposes. The table also lists how relevant survey tools interact with APs during the survey process.
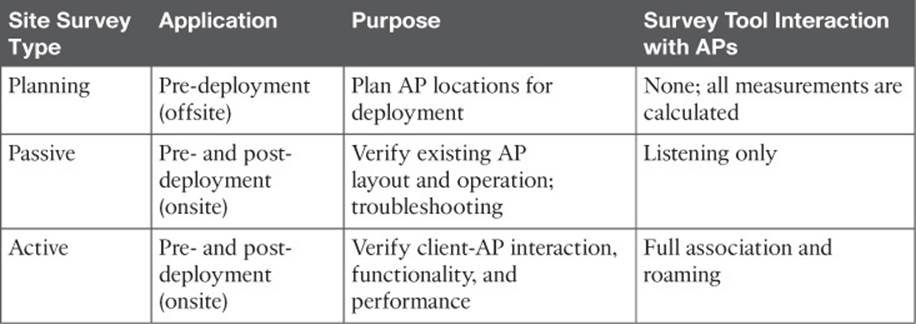
Table 7-5 Review of Site Survey Types and Applications
All materials on the site are licensed Creative Commons Attribution-Sharealike 3.0 Unported CC BY-SA 3.0 & GNU Free Documentation License (GFDL)
If you are the copyright holder of any material contained on our site and intend to remove it, please contact our site administrator for approval.
© 2016-2026 All site design rights belong to S.Y.A.