CCNP Routing and Switching TSHOOT 300-135 Official Cert Guide (2015)
Part I. Fundamental Troubleshooting and Maintenance Concepts
Chapter 2. Troubleshooting and Maintenance Tools
This chapter covers the following topics:
![]() The Troubleshooting and Network Maintenance Toolkit: This section introduces you to the essential tools for troubleshooting and maintenance tasks.
The Troubleshooting and Network Maintenance Toolkit: This section introduces you to the essential tools for troubleshooting and maintenance tasks.
![]() Using Cisco IOS to Verify and Define the Problem: This section reviews the ping, telnet, and traceroute utilities.
Using Cisco IOS to Verify and Define the Problem: This section reviews the ping, telnet, and traceroute utilities.
![]() Using Cisco IOS to Collect Information: This section focuses on how to use the CLI to collect information for troubleshooting and maintenance.
Using Cisco IOS to Collect Information: This section focuses on how to use the CLI to collect information for troubleshooting and maintenance.
![]() Collecting Information in Transit: This section identifies how you can configure switches to send copies of frames to packet capturing devices using SPAN and RSPAN.
Collecting Information in Transit: This section identifies how you can configure switches to send copies of frames to packet capturing devices using SPAN and RSPAN.
![]() Using CLI Tools to Document a Network: This section focuses on the steps and commands required to successfully document a network diagram.
Using CLI Tools to Document a Network: This section focuses on the steps and commands required to successfully document a network diagram.
Collecting network information is an ongoing process. There is no argument that you will be collecting network information when there is an issue. However, if that is the only time you collect network information, you are missing the necessary key element of an efficient and effective troubleshooting process. To be an efficient and effective troubleshooter, you need network information about the good times and the bad times, and you need it now, not later. Therefore, you need to gather baseline data on a regular basis so that you have something to compare your current issue to. In addition, the statistics related to certain network events (for example, processor utilization on a network server exceeding a specified threshold) could trigger the writing of log information (for example, to a syslog server), so you have a snapshot of the device’s health at that point in time.
This chapter introduces you to a sampling of Cisco IOS tools and features designed for network maintenance and troubleshooting.
“Do I Know This Already?” Quiz
The “Do I Know This Already?” quiz allows you to assess whether you should read this entire chapter thoroughly or jump to the “Exam Preparation Tasks” section. If you are in doubt about your answers to these questions or your own assessment of your knowledge of the topics, read the entire chapter. Table 2-1 lists the major headings in this chapter and their corresponding “Do I Know This Already?” quiz questions. You can find the answers in Appendix A, “Answers to the ‘Do I Know This Already?’ Quizzes.”
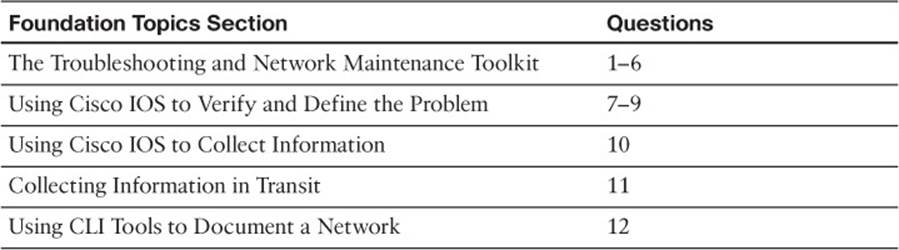
Table 2-1 “Do I Know This Already?” Section-to-Question Mapping
Caution
The goal of self-assessment is to gauge your mastery of the topics in this chapter. If you do not know the answer to a question or are only partially sure of the answer, you should mark that question as wrong for purposes of the self-assessment. Giving yourself credit for an answer that you correctly guess skews your self-assessment results and might provide you with a false sense of security.
1. Which three of the following are components that would be most useful when recovering from a network equipment outage?
a. Backup of device configuration information
b. Physical topology
c. Duplicate hardware
d. Operating system and application software (along with any applicable licensing) for the device
2. The types of information collection used in troubleshooting fall into which three broad categories?
a. Troubleshooting information collection
b. Baseline information collection
c. QoS information collection
d. Network event information collection
3. Which of the following would be appropriate for a collaborative web-based documentation solution?
a. Blog
b. Vlog
c. Wiki
d. Podcast
4. Which command enables you to view archival copies of a router’s startup configuration?
a. show backup
b. show archive
c. show flash: | begin backup
d. show ftp: | begin archive
5. Which of the following is a Cisco IOS technology that uses a collector to take data from monitored devices and present graphs, charts, and tables to describe network traffic patterns?
a. NBAR
b. NetFlow
c. QDM
d. IPS
6. Which two of the following are characteristics of the NetFlow feature? (Choose the two best answers.)
a. Collects detailed information about traffic flows
b. Collects detailed information about device statistics
c. Uses a pull model
d. Uses a push model
7. Which of the following is the ping response to a transmitted ICMP echo datagram that needed to be fragmented when fragmentation was not permitted?
a. U
b. .
c. M
d. D
8. Which command can be used to determine whether transport layer connectivity is functioning?
a. telnet
b. ping
c. traceroute
d. arp -a
9. Which command enables you to determine whether a routing loop exists?
a. telnet
b. ping
c. traceroute
d. arp -a
10. Which of the following commands displays a router’s running configuration, starting where the routing protocol configuration begins?
a. show running-config | tee router
b. show running-config | begin router
c. show running-config | redirect router
d. show running-config | append router
11. What feature available on Cisco Catalyst switches enables you to connect a network monitor to a port on one switch to monitor traffic flowing through a port on a different switch?
a. RSTP
b. SPAN
c. RSPAN
d. SPRT
12. What IOS command enables you to discover the Cisco devices that are directly connected to other Cisco devices?
a. show ip interface brief
b. show interface status
c. show cdp neighbor
d. show version
Foundation Topics
The Troubleshooting and Network Maintenance Toolkit
As previously discussed, troubleshooting and maintenance go hand and hand. A relationship exists between the two. Therefore, the tools we use for troubleshooting and maintenance will be very similar, if not the same.
Chapter 1, “Introduction to Troubleshooting and Network Maintenance,” introduced you to a series of steps that provide a structured troubleshooting process. Several of these steps involve the use of tools that will help gather, examine, and compare information, in addition to fixing and possibly rolling back configurations. Let’s examine four of these steps:
![]() Problem report: By proactively monitoring network devices with specialized reporting tools, you might be alerted to impending performance issues before users are impacted and report it.
Problem report: By proactively monitoring network devices with specialized reporting tools, you might be alerted to impending performance issues before users are impacted and report it.
![]() Collect information: The collection of information when troubleshooting a problem can often be made more efficient through the use of specialized maintenance and troubleshooting tools. At this point, you are gathering more information that will help paint a clearer picture of the issue at hand.
Collect information: The collection of information when troubleshooting a problem can often be made more efficient through the use of specialized maintenance and troubleshooting tools. At this point, you are gathering more information that will help paint a clearer picture of the issue at hand.
![]() Examine collected information: As troubleshooters investigate the information they collected during the troubleshooting process, they need to know what normal network behavior looks like. They can then contrast that normal behavior against what they are observing in their collected data. Specialized maintenance tools can be used in a network to collect baseline data on an ongoing basis so that it is available and current when needed.
Examine collected information: As troubleshooters investigate the information they collected during the troubleshooting process, they need to know what normal network behavior looks like. They can then contrast that normal behavior against what they are observing in their collected data. Specialized maintenance tools can be used in a network to collect baseline data on an ongoing basis so that it is available and current when needed.
![]() Verify hypothesis: Specialized maintenance and troubleshooting tools help a troubleshooter implement his fix for an issue; however, he can also help roll back an attempted fix, if that fix proves unsuccessful.
Verify hypothesis: Specialized maintenance and troubleshooting tools help a troubleshooter implement his fix for an issue; however, he can also help roll back an attempted fix, if that fix proves unsuccessful.
If you look closely, the information that is collected essentially falls into one of three categories:

![]() Troubleshooting information collection: This is the information collected while troubleshooting an issue that was either reported by a user or a network management station (NMS).
Troubleshooting information collection: This is the information collected while troubleshooting an issue that was either reported by a user or a network management station (NMS).
![]() Baseline information collection: This is the information collected when the network is operating normally. This information provides a frame of reference against which other data can be compared when we are troubleshooting an issue.
Baseline information collection: This is the information collected when the network is operating normally. This information provides a frame of reference against which other data can be compared when we are troubleshooting an issue.
![]() Network event information collection: This is the information collected when our devices automatically generate alerts in response to specific conditions (for example, configured utilization levels on a switch, router, or server being exceeded). These alerts can be simple notification messages or emergency messages. At some point, they will come in handy.
Network event information collection: This is the information collected when our devices automatically generate alerts in response to specific conditions (for example, configured utilization levels on a switch, router, or server being exceeded). These alerts can be simple notification messages or emergency messages. At some point, they will come in handy.
Because such a tight relationship exists between troubleshooting and network maintenance, you should identify the tools required to carry out your maintenance processes based on how well targeted they are toward your specific business processes and tasks, while helping you focus your troubleshooting efforts without having to wade through reams of irrelevant information. This section focuses on tools that are necessary for troubleshooting and maintenance tasks.
Network Documentation Tools
It is fitting that we start this chapter with a discussion on network documentation tools, because without them, all the other tools we use mean nothing if we are not documenting their findings. Chapter 1 discussed the importance of network documentation. However, for this documentation to truly add value and be an asset, it should be easy to retrieve and, more important, be current. To keep the documentation current is a challenge for most people. The big reason is time. However, you can make it less challenging and less time-consuming if it is easy to update with the proper tools.
Many solutions are available on the market. The features you want the tool to provide will determine the overall cost. However, you do not have to purchase the most expensive tool to get the best product. Shop around and communicate with the vendors to see what they have to offer you and your business needs. Get free trials and work with them for a while. That is the only way you will be able to determine whether the product will work for you. A couple of documentation management system examples are as follows:
![]() Trouble ticket reporting system: Several software applications are available for recording, tracking, and archiving trouble reports (that is, trouble tickets). These applications are often referred to as help desk applications. However, their usefulness extends beyond the help desk environment.
Trouble ticket reporting system: Several software applications are available for recording, tracking, and archiving trouble reports (that is, trouble tickets). These applications are often referred to as help desk applications. However, their usefulness extends beyond the help desk environment.
![]() Wiki: A wiki can act as a web-based collaborative documentation platform. A popular example of a wiki is Wikipedia (http://www.wikipedia.com), an Internet-based encyclopedia that can be updated by users. This type of wiki technology can also be used on your local network to maintain a central repository for documentation that is both easy to access and easy to update.
Wiki: A wiki can act as a web-based collaborative documentation platform. A popular example of a wiki is Wikipedia (http://www.wikipedia.com), an Internet-based encyclopedia that can be updated by users. This type of wiki technology can also be used on your local network to maintain a central repository for documentation that is both easy to access and easy to update.
The true power of documentation is seen during the troubleshooting process, and this is especially true when you have a well-organized, searchable repository of information. During the troubleshooting process, if you have a searchable database of past issues that were solved, and guides that can be followed to resolve issues, you can leverage that information and be more efficient and effective. However, do not forget to update the documentation after you solve the ticket. Just because it was reported in the past and already had a resolution does not mean you can skip the documentation process. At some point, we may need to rely on the number of entries in a ticket reporting system to determine whether some greater issue is lurking in the shadows and causing the reoccurrence of the same minor issues over and over.
Basic Tools
Troubleshooting and network maintenance tools often range in expense from free to tens of thousands of dollars. Similarly, these tools vary in their levels of complexity and usefulness for troubleshooting and maintaining specific issues. You need to select tools that balance your troubleshooting and maintenance needs while meeting your budgetary constraints.
Regardless of budget, all Cisco troubleshooting and network maintenance toolkits will contain the command-line interface (CLI) commands that are executable from a router or switch prompt. In addition, many network devices have a graphical user interface (GUI) to assist network administrators in their configuration and monitoring tasks. External servers (for example, backup servers, logging servers, and time servers) can also collect, store, or provide valuable information for day-to-day network operations and for troubleshooting and maintenance.
CLI Tools
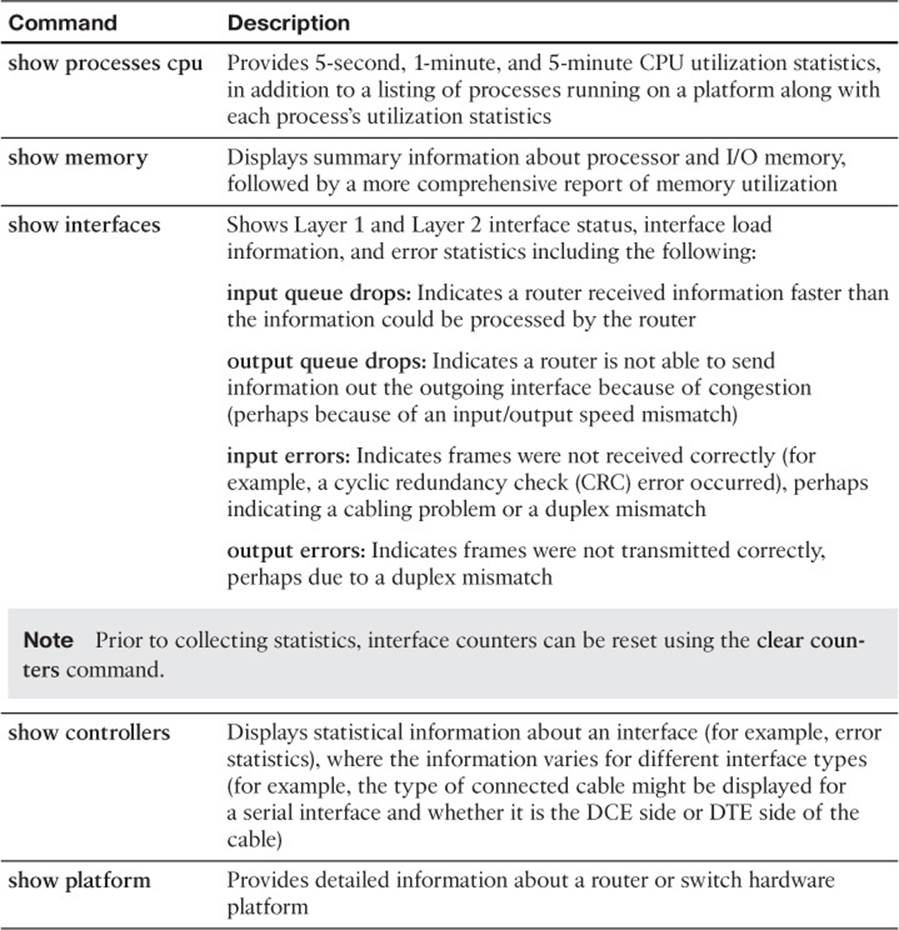
Cisco IOS offers a wealth of CLI commands, which can prove invaluable when troubleshooting a network issue. For example, a show command, which displays a static snapshot of information, can display router configuration information and the routes that have been learned by a routing process. The debug command can provide real-time information about router or switch processes. The focus of this book is on those show and debug CLI commands that will assist us in solving trouble tickets. To illustrate, consider Example 2-1, which shows router R2 receiving Open Shortest Path First (OSPF) link-state updates from its OSPF neighbors as those updates occur.
Example 2-1 Sample debug Output
R2#debug ip ospf events
OSPF events debugging is on
R2#
*Mar 1 00:06:06.679: OSPF: Rcv LS UPD from 10.4.4.4 on Serial1/0.2 length 124
LSA count 1
*Mar 1 00:06:06.691: OSPF: Rcv LS UPD from 10.3.3.3 on Serial1/0.1 length 124
LSA count 1
*Mar 1 00:06:06.999: OSPF: Rcv LS UPD from 10.4.4.4 on Serial1/0.2 length 124
LSA count 1
*Mar 1 00:06:07.067: OSPF: Rcv LS UPD from 10.3.3.3 on Serial1/0.1 length 156
LSA count 2
This is one of many show and debug examples you will see throughout this book. Cisco IOS also has a CLI feature that allows a router to monitor events and automatically respond to a specific event (such as a defined threshold being reached) with a predefined action. This feature is called Cisco IOS Embedded Event Manager (EEM), which we cover in more detail later.
GUI Tools
Although Cisco has a great number of GUI tools, when it comes to router and switch configuration and troubleshooting for the CCNP Routing and Switching track, you will spend all your time in the CLI. Therefore, do not get too comfortable with GUI tools for the Routing and Switching track. However, as an example, you can use the GUI tool known as Cisco Configuration Professional (CCP) to configure and troubleshoot your Integrated Services Routers (ISRs). Figure 2-1 provides a sample of the CCP home page.
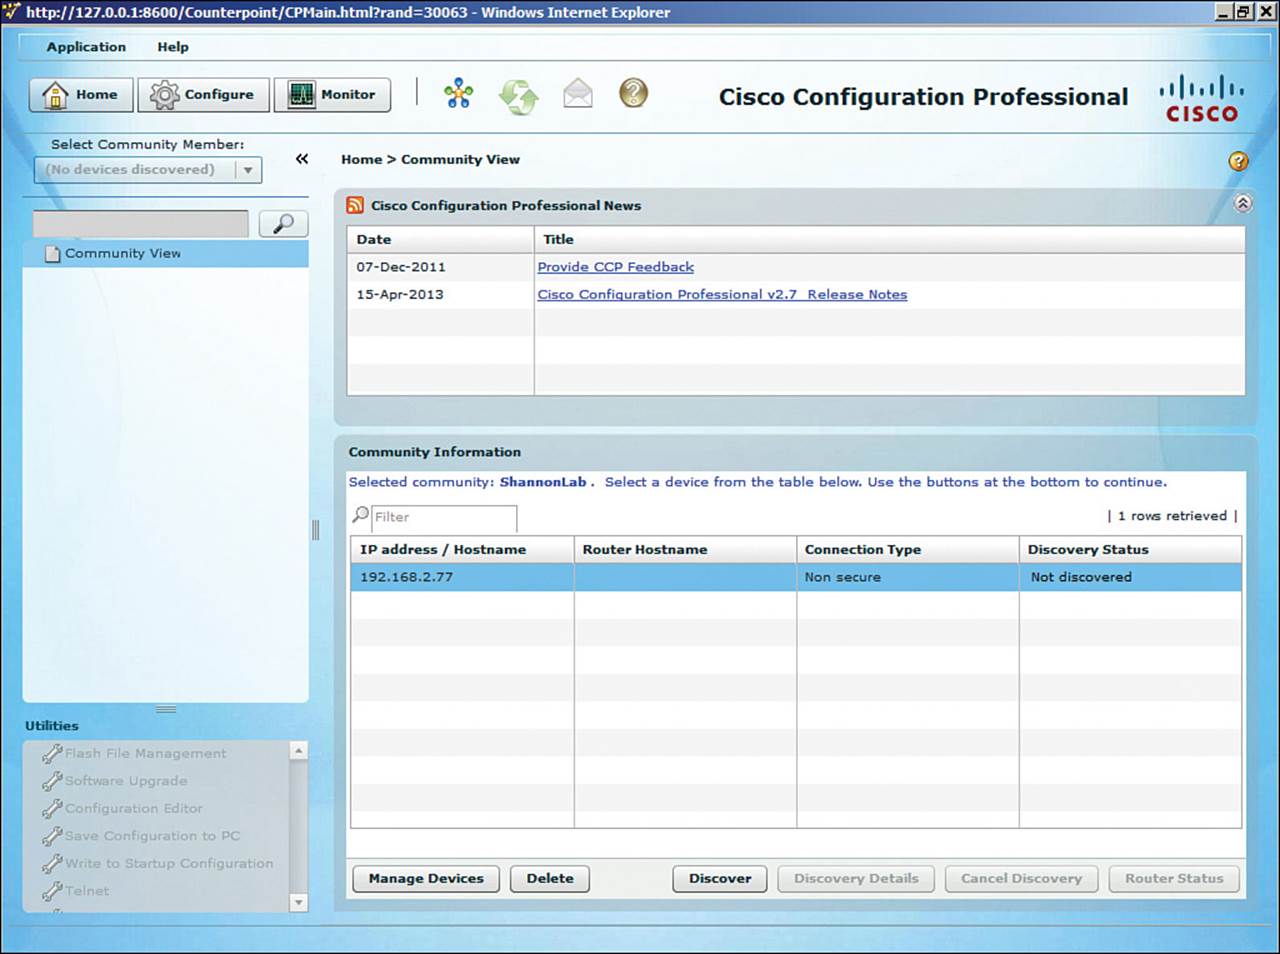
Figure 2-1 Cisco Configuration Professional
Recovery Tools
During the recovery process, you need access to duplicate hardware and the IOS. However, you also need a backup of the failed devices configurations. External servers are often used to store archival backups of a device’s operating system (for example, a Cisco IOS image) and the configuration information. Depending on your network device, you might be able to back up your operating system and configuration information to a TFTP, FTP, HTTP, or SCP server. To illustrate, consider Example 2-2.
Example 2-2 Backing Up a Router’s Startup Configuration to an FTP Server
R1#copy startup-config ftp://cisco:cisco@192.168.1.74
Address or name of remote host [192.168.1.74]?
Destination filename [r1-confg]?
Writing r1-confg !
1446 bytes copied in 3.349 secs (432 bytes/sec)
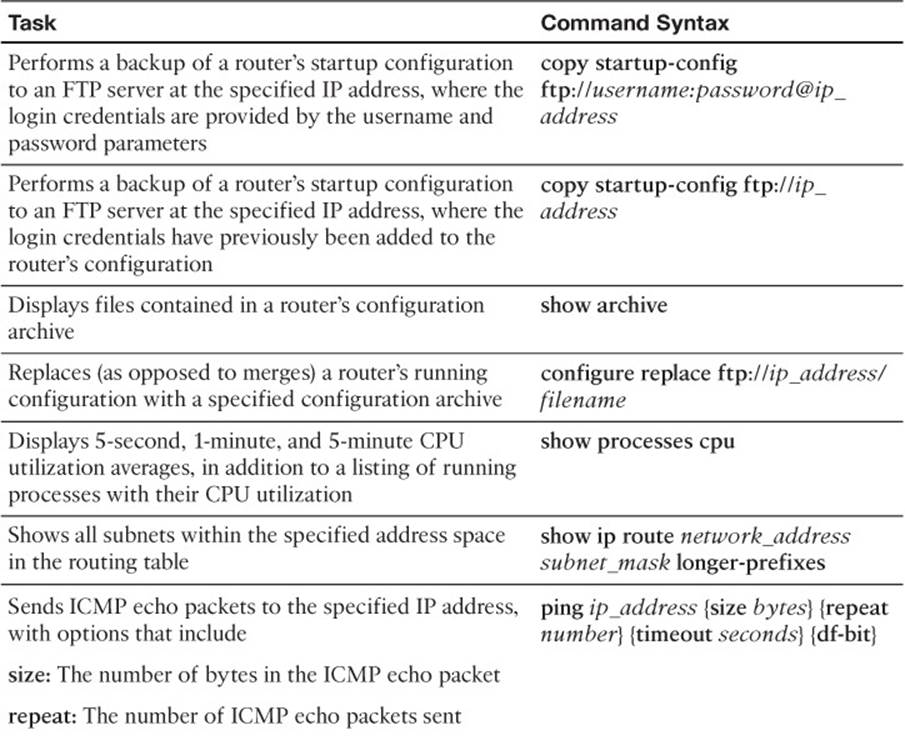
In Example 2-2, router R1’s startup configuration is being copied to an FTP server with an IP address of 192.168.1.74. Notice that the login credentials (that is, username=cisco and password=cisco) for the FTP server are specified in the copy command. In a production environment, the username and password should be stronger and not easily guessed.
If you intend to routinely copy backups to an FTP server, you can avoid specifying the login credentials each time (for security purposes), by adding those credentials to the router’s configuration. Example 2-3 shows how to add FTP username and password credentials to the router’s configuration, and Example 2-4 shows how the startup configuration can be copied to an FTP server without explicitly specifying those credentials in the copy command.
Example 2-3 Adding FTP Server Login Credentials to a Router’s Configuration
R1#configure terminal
Enter configuration commands, one per line. End with CNTL/Z.
R1(config)#ip ftp username cisco
R1(config)#ip ftp password cisco
R1(config)#end
Example 2-4 Backing Up a Router’s Startup Configuration to an FTP Server Without Specifying Login Credentials
R1#copy startup-config ftp://192.168.1.74
Address or name of remote host [192.168.1.74]?
Destination filename [r1-confg]?
Writing r1-confg !
1446 bytes copied in 3.389 secs (427 bytes/sec)
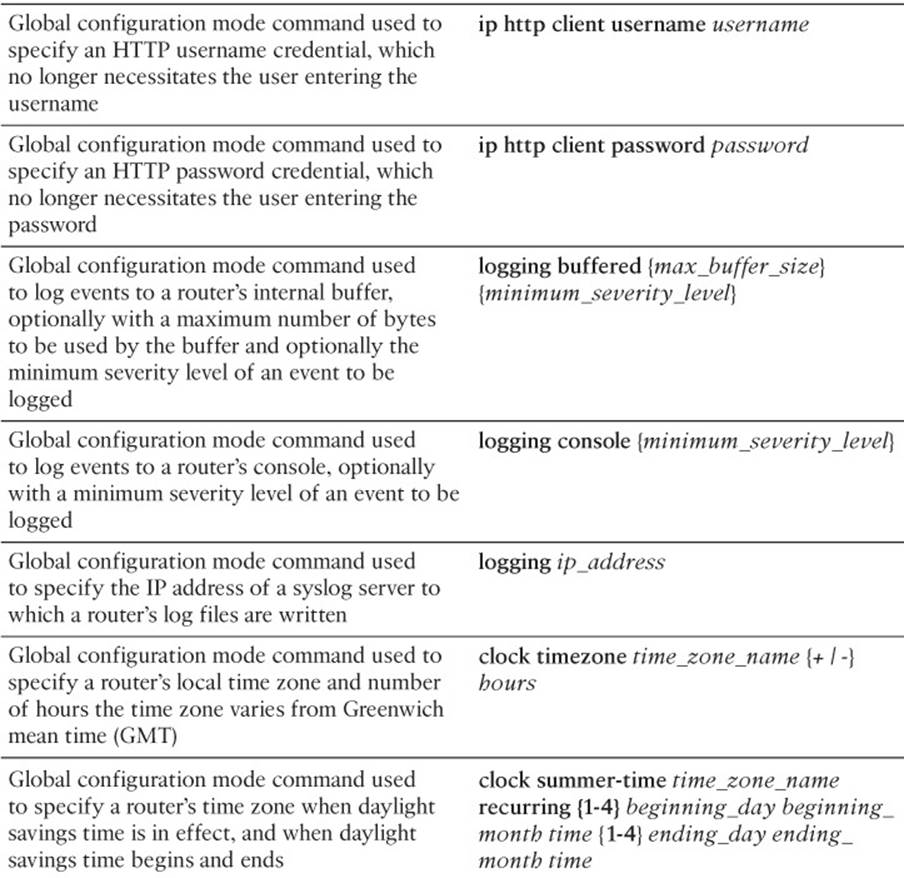
Example 2-5 shows how to add HTTP username and password credentials to the router’s configuration. Compare this to the FTP configuration commands and notice the difference.
Example 2-5 Adding HTTP Server Login Credentials to a Router’s Configuration
R1#configure terminal
Enter configuration commands, one per line. End with CNTL/Z.
R1(config)#ip http client username cisco
R1(config)#ip http client password cisco
R1(config)#end
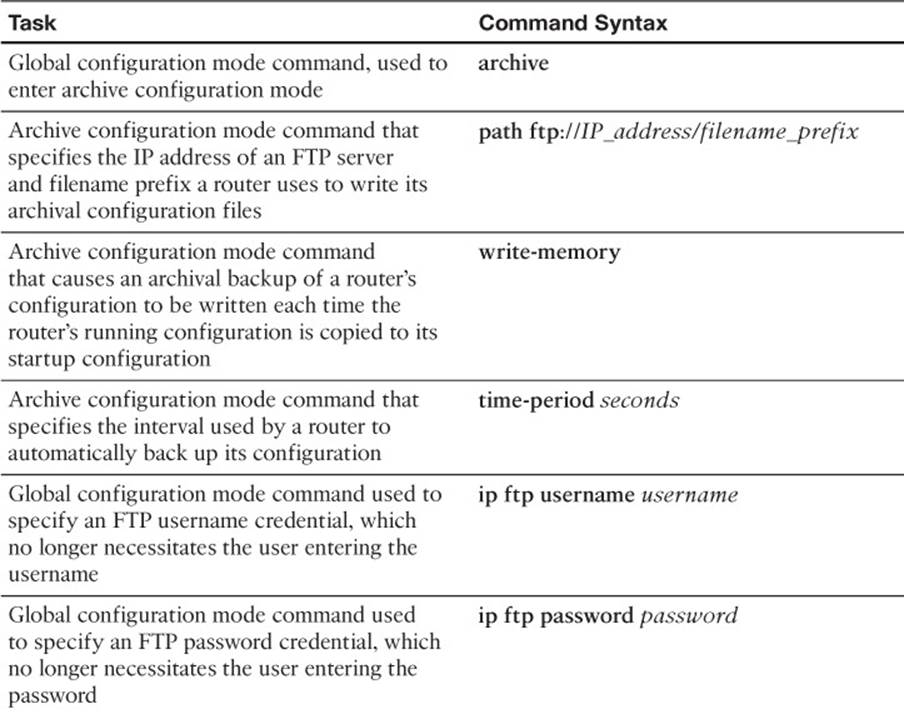
The process of backing up a router’s configuration can be automated using an archiving feature, which is part of the Cisco IOS Configuration Replace and Configuration Rollback feature. Specifically, you can configure a Cisco IOS router to periodically (that is, at intervals specified in minutes) back up a copy of the configuration to a specified location (for example, the router’s flash, or an FTP server). Also, the archive feature can be configured to create an archive every time you copy a router’s running configuration to the startup configuration.
Example 2-6 illustrates a router configured to back up the running configuration every 1440 minutes to an FTP server with an IP address of 192.168.1.74. The login credentials have already been configured in the router’s configuration. In addition, the write-memory command causes the router to archive a copy of the configuration whenever the router’s running configuration is copied to the startup configuration using either the write-memory or copy running-config startup-config commands.
Example 2-6 Automatic Archive Configuration
R1#show run
Building configuration...
...OUTPUT OMITTED...
ip ftp username cisco
ip ftp password cisco
!
archive
path ftp://192.168.1.74/R1-config
write-memory
time-period 1440
...OUTPUT OMITTED...
You can view the files stored in a configuration archive by issuing the show archive command, as demonstrated in Example 2-7.
Example 2-7 Viewing a Configuration Archive
R1#show archive
The maximum archive configurations allowed is 10.
The next archive file will be named ftp://192.168.1.74/R1-config-3
Archive # Name
1 ftp://192.168.1.74/R1-config-1
2 ftp://192.168.1.74/R1-config-2 <- Most Recent
3
4
5
6
7
8
9
10
Example 2-8 shows the execution of the copy run start command, which copies a router’s running configuration to the router’s startup configuration. The show archive command is then reissued, and the output confirms that an additional configuration archive (named R1-config-3) has been created on the FTP server because of the write-memory command we issued in config-archive configuration mode.
Example 2-8 Confirming Automated Backups
R1#copy run start
Destination filename [startup-config]?
Building configuration...
[OK]
Writing R1-config-3 !
R1#show archive
The maximum archive configurations allowed is 10.
The next archive file will be named ftp://192.168.1.74/R1-config-4
Archive # Name
1 ftp://192.168.1.74/R1-config-1
2 ftp://192.168.1.74/R1-config-2
3 ftp://192.168.1.74/R1-config-3 <- Most Recent
4
5
6
7
8
9
10
The output of show archive indicates that the maximum configurations allowed is ten. This is not entirely true. Because the path is pointing to an FTP server, we are limited only by the amount of storage space on the server. Therefore, the router will continue to create an archive of the running configuration at its scheduled interval. If the archive list on the router fills up (maximum ten), the output of show archive will erase the entry for Archive 1, move all entries up the list one spot, and add the new entry to Archive 10, as shown in Example 2-9. Note that this does not delete anything from the FTP server. Only the entry in show archive is removed to make space in the list.
Example 2-9 Confirming Archive Configuration
R1#copy run start
Destination filename [startup-config]?
Building configuration...
[OK]
Writing R1-config-3 !
R1#show archive
The maximum archive configurations allowed is 10.
The next archive file will be named ftp://192.168.1.74/R1-config-4
Archive # Name
1 ftp://192.168.1.74/R1-config-7
2 ftp://192.168.1.74/R1-config-8
3 ftp://192.168.1.74/R1-config-9
4 ftp://192.168.1.74/R1-config-10
5 ftp://192.168.1.74/R1-config-11
6 ftp://192.168.1.74/R1-config-12
7 ftp://192.168.1.74/R1-config-13
8 ftp://192.168.1.74/R1-config-14
9 ftp://192.168.1.74/R1-config-15
10 ftp://192.168.1.74/R1-config-16 <- Most Recent
However, if you are storing the archive locally in flash as an example, the older files will be deleted to make space, in addition to moving the entries listed in the show archive command output. You can change the maximum number of archives with the maximum command in config-archive configuration mode.
Restoring a configuration backup requires copying the configuration file from its storage location to the running configuration on the router or switch. The Cisco IOS copy command treats this as a merge operation instead of a copy and replace operation. This means that copying anything into the running configuration from any source might not produce the result we desire. We can witness this with the password recovery process on a Cisco router. During this process, after you have loaded the router to factory defaults, you copy the startup configuration into the running configuration, which produces a merge. This merge is easily witnessed with the interfaces. Interfaces that were enabled do not have a no shutdown command in the startup configuration, and the factory default setting of a router interface is shutdown and includes a shutdown command. This is illustrated in Example 2-10.
Example 2-10 Comparing the Running Configuration and Startup Configuration Before Issuing the copy Command
R1#show run
...OUTPUT OMITTED...
interface FastEthernet0/0
no ip address
shutdown
...OUTPUT OMITTED...
R1#show start
...OUTPUT OMITTED...
interface FastEthernet0/0
ip address 192.168.1.11 255.255.255.0
...OUTPUT OMITTED...
Once the startup configuration is copied to (merged with) the running configuration, the shutdown command prevails in the running configuration because there is not a no shutdown in the startup configuration that will overwrite that, as shown in Example 2-11. To fix this, after you have copied the startup configuration to the running configuration, you have to issue the no shutdown command on all interfaces you want enabled.
Example 2-11 Witnessing a Configuration Merge
R1#copy start run
Destination filename [running-config]?
1881 bytes copied in 1.444 secs (1303 bytes/sec)
R1#show run
...OUTPUT OMITTED...
interface FastEthernet0/0
ip address 192.168.1.11 255.255.255.0
shutdown
...OUTPUT OMITTED...
R1#
On the bright side, you can restore a previously archived configuration using the configure replace command. Unlike the copy command, this does not merge the archived configuration with the running configuration, but rather completely replaces the running configuration with the archived configuration. Example 2-12 shows the restoration of an archived configuration to a router. Notice how the IOS warns you that this is a copy replace function that completely overwrites the current configuration. In this case, there was only one small difference between the running configuration and the archive, as indicated by the statement “Total number of passes: 1.” It was the hostname.
Example 2-12 Restoring an Archived Configuration
Router#configure replace ftp://192.168.1.74/R1-config-3
This will apply all necessary additions and deletions
to replace the current running configuration with the
contents of the specified configuration file, which is
assumed to be a complete configuration, not a partial
configuration. Enter Y if you are sure you want to proceed. ? [no]: Y
Loading R1-config-3 !
[OK - 3113/4096 bytes]
Total number of passes: 1
Rollback Done
R1#
Logging Tools
Device logs offer valuable information when troubleshooting a network issue. Many events that occur on a router are automatically reported to the router’s console. For example, if a router interface goes down or up, a message is written to the console. However, once in production, we are usually not staring at the console output or even connected to the console port. In most cases, we would connect to the device when needed using Telnet or Secure Shell (SSH), and these logging messages are not displayed via Telnet or SSH by default. If you are connected to a router through Telnet or SSH and want to see console messages, you have to enter the command terminal monitor in privilege EXEC mode.
A downside of solely relying on console messages is that those messages can scroll off the screen, or you might close your terminal emulator, after which those messages would no longer be visible as the session is reset. Therefore, a step beyond logging messages to the console is logging messages to a router’s buffer (the router’s RAM). To cause messages to be written to a router’s buffer, you can issue the logging buffered command. As part of that command, you can specify how much of the router’s RAM can be dedicated to logging. After the buffer fills to capacity, older entries will be deleted to make room for newer entries. You can view the logging messages in the buffer by issuing the show logging command. If you need to clear the logging messages in the buffer, issue the clear logging command in privilege EXEC mode.
Logging severity levels range from 0 to 7, with corresponding names, as shown in Table 2-2. Notice that lower severity levels are more severe than those with higher levels. By default, the console, vty lines, and buffer will log all messages with a severity level of 7 and lower. However, debugs are logged only when they are turned on with debug commands.
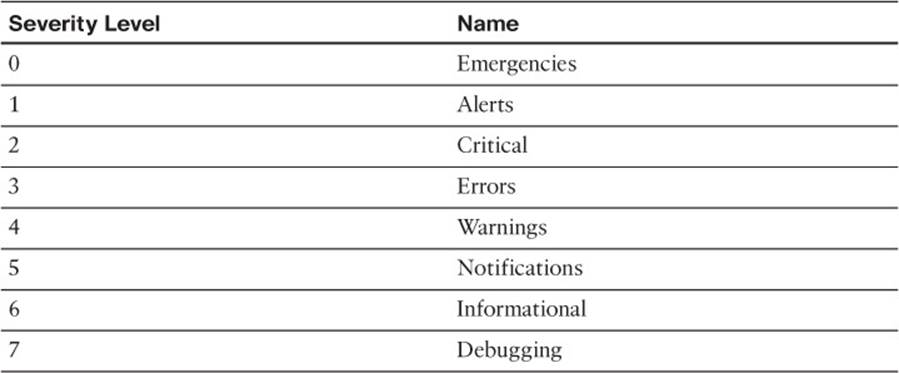
Table 2-2 Severity Levels
You might want to log messages of one severity level to a router’s console and messages of another severity level to the router’s buffer. This is possible by using the logging console severity_level and logging buffered severity_level commands. For example, if you want to log level 6 and lower to the console and level 7 and lower to the buffer, you enter logging console 6 and logging buffered 7 in global configuration mode. You can also specify the severity level by name instead of number.
Another logging option is to log messages to an external syslog server. By sending log messages to an external server, you can keep a longer history of logging messages. Depending on the syslog server software, you might be able to schedule automated log archiving, configure advanced script actions, create advanced alerts, and produce statistical graphs. You can direct your router’s log output to a syslog server’s IP address using the logging ip_address command, and you can specify the severity level that will be sent to the syslog server by using the logging trapseverity_level command.
Example 2-13 illustrates several of the logging configurations discussed here.
Example 2-13 Logging Configuration
R1#show run
...OUTPUT OMITTED...
Building configuration...
!
logging buffered 4096 warnings
logging console warnings
!
logging 192.168.1.50
logging trap 6
...OUTPUT OMITTED...
In Example 2-13, events with a severity level of warning (that is, 4) or less (that is, 0 to 4) are logged to the router’s buffer. This buffer can be viewed with the show logging command. The router can use a maximum of 4096 bytes of RAM for the buffered logging. The console is configured for logging events of the same severity level. In addition, the router is configured to log messages with a severity of 6 or lower to a syslog server with an IP address 192.168.1.50. Figure 2-2 shows logging messages being collected by a Kiwi Syslog Server (available fromhttp://www.kiwisyslog.com).
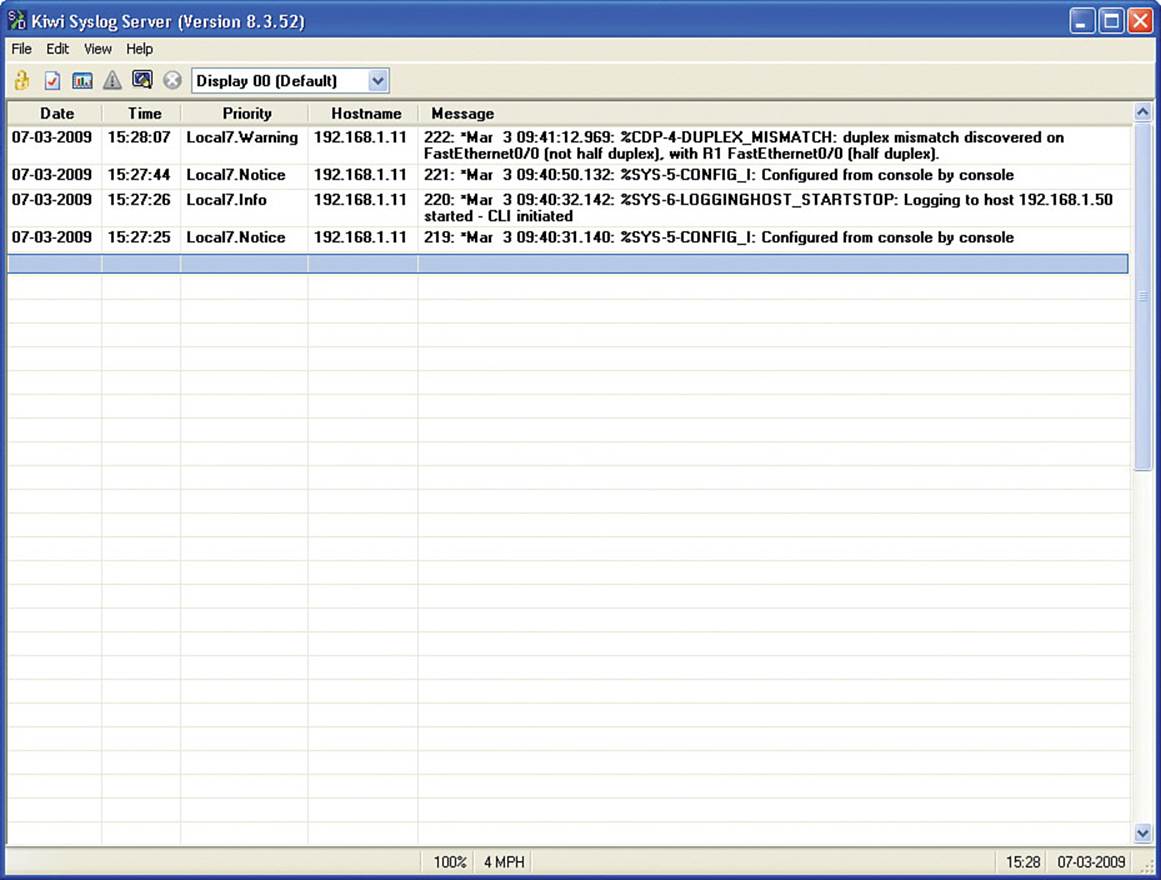
Figure 2-2 Syslog Server
Network Time Protocol as a Tool
Picture this scenario. You have just been assigned a trouble ticket. Users are complaining that the network is slow at 5:30 p.m. local time. The problem ticket indicates that this happens every day. You are browsing the logs to see whether anything abnormal is occurring on the network at that time. However, your search will be worthwhile only if the logs have time stamps. If they don’t, you will not be able to correlate the log entrees to the problem the users are reporting. Therefore, time stamps are useless if they are not accurate. For example, there may be a log entry for 2:25 p.m. that reports high network utilization. Is that really 2:25 p.m. or is it 5:30 p.m.? Time-stamp accuracy is paramount when it comes to troubleshooting. Therefore, you need to make sure the clocks are set correctly on all the devices.
Although you could individually set the clock on each of your devices, those clocks might drift over time and not agree causing variations in the log entries. You might have heard the saying that a man with one watch always knows what time it is, whereas a man with two watches is never quite sure. This implies that devices need to have a common point of reference for their time. Such a reference point is made possible by Network Time Protocol (NTP), which allows network devices to point to a device acting as an NTP server (a time source). However, this must be a reliable time source. For example, the U.S. Naval Observatory in Washington, D.C., is a stratum 1 time source. Stratum 1 time sources are the most reliable and accurate. In addition, because the NTP server might be referenced by devices in different time zones, each device has its own time zone configuration, which indicates how many hours its time zone differs from Greenwich mean time (GMT).
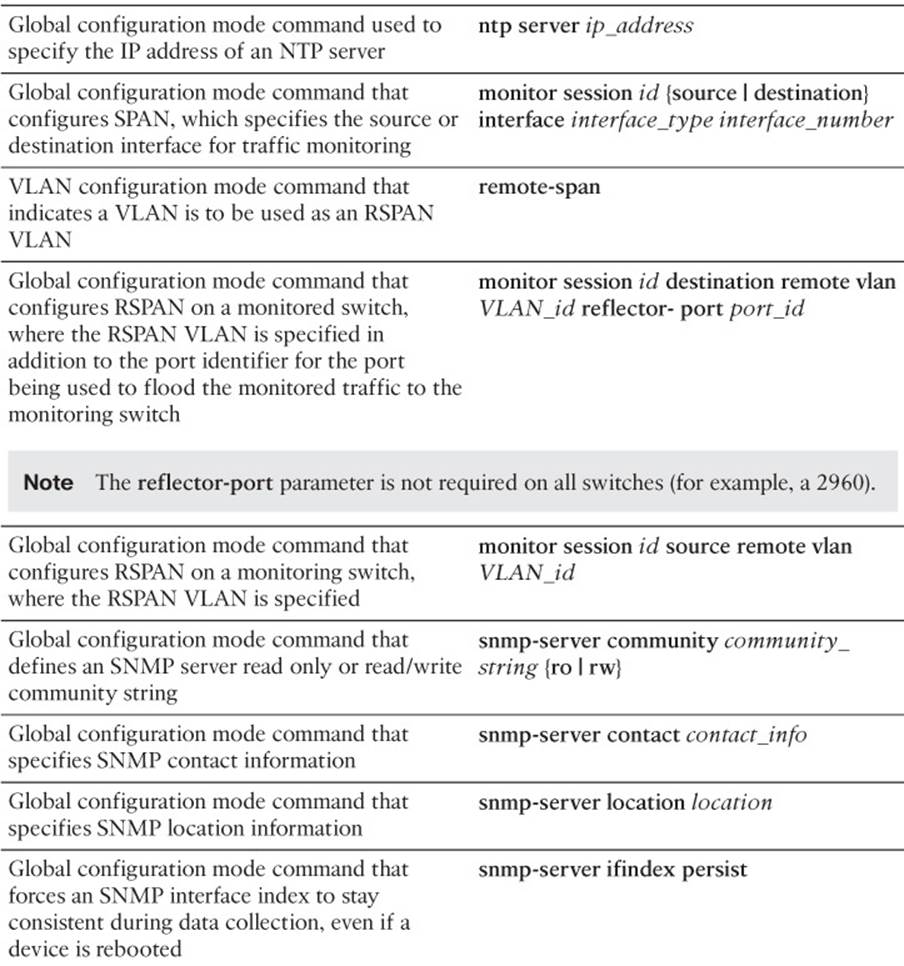
Example 2-14 shows an NTP configuration entered on a router located in the eastern time zone, which is 5 hours behind GMT when daylight savings time is not in effect. The clock summer-time command defines when daylight savings time begins and ends. In this example, daylight savings time begins at 2:00 a.m. on the second Sunday in March and ends at 2:00 a.m. on the first Sunday in November. The ntp server command is used to point to an NTP server. Note that a configuration can have more than one ntp server command, for redundancy. In such cases, NTP will decide based on its protocol which is the most reliable, or you can manually specify which is most reliable by adding the prefer option to the ntp server command.
Example 2-14 Configuring a Router to Point to an NTP Server
R1#configure terminal
Enter configuration commands, one per line. End with CNTL/Z.
R1(config)#clock timezone EST -5
R1(config)#clock summer-time EDT recurring 2 Sun Mar 2:00 1 Sun Nov 2:00
R1(config)#ntp server 192.168.1.150
R1(config)#ntp server 192.168.1.151 prefer
R1(config)#end
NTP uses a hierarchy of time servers based on stratum levels from 1 to 15. Stratum 1 is the most reliable. Because it is based on a hierarchy, you may not want all of your devices pointing to the stratum 1 time source that is connected to the Internet. In these instances, you could set up a device or two in your organization to receive their time from the stratum 1 source (making them a stratum 2 source) and then configure the other devices in your organization to receive their time from these local devices in your organization (making them a stratum 3).
Advanced Tools
Keeping an eye on network traffic patterns and performance metrics can help you anticipate problems before they occur. You can then take the necessary measures to address them proactively before they become a major issue. This is in contrast to taking a reactive stance where you continually respond to problem reports as they occur. The saying “If it ain’t broke don’t fix it” does not apply in a proactive network maintenance environment. Your stance in this type of environment should be “If it appears that it will break, fix it.” To be proactive, you need more than just basic show and debug commands. You need advanced tools to proactively monitor the health of your devices and the health of your network traffic, such as SNMP, NetFlow, and EEM.
Overview of SNMP and NetFlow
Simple Network Management Protocol (SNMP) allows a monitored device (for example, a router or a switch) to run an SNMP agent that collects data such as utilization statistics for processors and memory. An SNMP server can then query the SNMP agent to retrieve those statistics to determine the overall health of that device.
Cisco IOS NetFlow can provide you with tremendous insight into your network traffic patterns. Several companies market NetFlow collectors, which are software applications that can take the NetFlow information reported from a Cisco device and convert that raw data into useful graphs, charts, and tables reflecting traffic patterns. Reasons to monitor network traffic include the following:
![]() Ensuring compliance with an SLA: If you work for a service provider or are a customer of a service provider, you might want to confirm that performance levels to and from the service provider’s cloud are conforming to the agreed-upon service level agreement (SLA).
Ensuring compliance with an SLA: If you work for a service provider or are a customer of a service provider, you might want to confirm that performance levels to and from the service provider’s cloud are conforming to the agreed-upon service level agreement (SLA).
![]() Trend monitoring: Monitoring resource utilization on your network (for example, bandwidth utilization and router CPU utilization) can help you recognize trends and forecast when upgrades will be required or if users are abusing the network resources.
Trend monitoring: Monitoring resource utilization on your network (for example, bandwidth utilization and router CPU utilization) can help you recognize trends and forecast when upgrades will be required or if users are abusing the network resources.
![]() Troubleshooting performance issues: Performance issues can be difficult to troubleshoot in the absence of a baseline. By routinely monitoring network performance, you have a reference point (that is, a baseline) against which you can compare performance metrics collected after a user reports a performance issue.
Troubleshooting performance issues: Performance issues can be difficult to troubleshoot in the absence of a baseline. By routinely monitoring network performance, you have a reference point (that is, a baseline) against which you can compare performance metrics collected after a user reports a performance issue.
Creating a Baseline with SNMP and NetFlow
SNMP and NetFlow are two technologies available on most Cisco IOS platforms that can automate the collection statistics. These statistics can be used, for example, to establish a baseline that can be used in a troubleshooting scenario or in proactive network management and maintenance.Table 2-3 contrasts these two technologies.
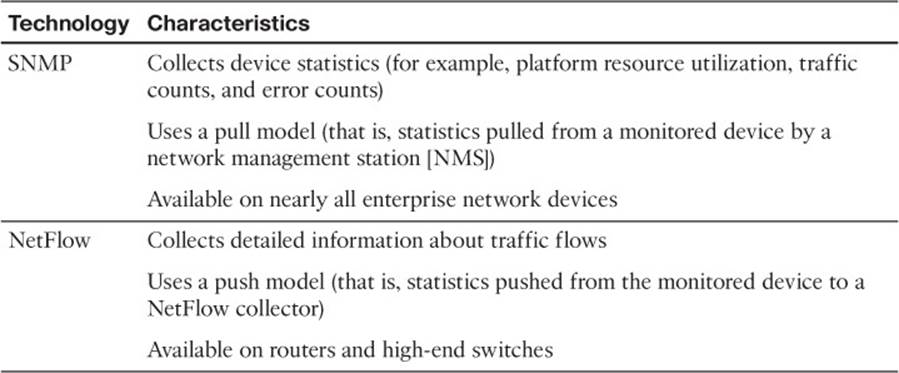
Table 2-3 Comparing SNMP and NetFlow
Although both SNMP and NetFlow are useful for statistical data collection, they target different fundamental functions. For example, SNMP is primarily focused on device statistics (the health of a device), whereas NetFlow is primarily focused on traffic statistics (the health of network traffic).
SNMP
A device being managed by SNMP runs a process called an SNMP agent, which collects statistics about the device and stores those statistics in a Management Information Base (MIB). A network management system (NMS) can then query the agent for information in the MIB, using the SNMP protocol. SNMP Version 3 (SNMPv3) supports encryption and hashed authentication of SNMP messages. Before SNMPv3, the most popular SNMP version was SNMPv2c, which used community strings for authentication. Today, many SNMP deployments are still using version 2c because of its simplicity. Specifically, for an NMS to be allowed to read data from a device running an SNMP agent, the NMS must be configured with a community string that matches the managed device’s read-only community string. For the NMS to change the information on the managed device, the NMS must be configured with a community string that matches the managed device’s read-write community string. To enhance the security available with SNMPv2c, you can create an access list that determines valid IP addresses or network addresses for NMS servers that are allowed to manage or collect information from the MIB of the device.
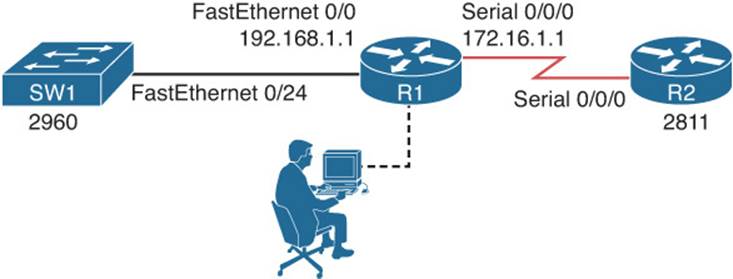
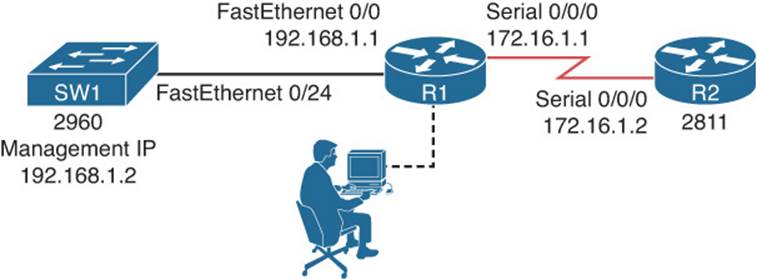
Figure 2-3 shows a topology using SNMP. In the topology, router R1 is running an SNMP agent that the NMS server can query.
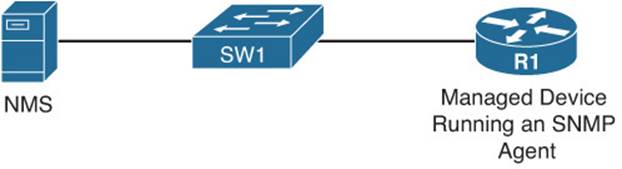
Figure 2-3 SNMP Sample Topology
Example 2-15 illustrates the SNMPv2c configuration on router R1. The snmp-server community string [ro | rw] [access_list_number] commands specify a read-only (that is, ro) community string of CISCO and a read-write (that is, rw) community string of PRESS. Only NMSs permitted in access list 10 and 11 will be able to read, or read/write, respectively, this device using SNMP. Contact and location information for the device is also specified. Finally, notice the snmp-server ifindex persist command. This command ensures that the SNMP interface index stays consistent during data collection, even if the device is rebooted. This consistency is important when data is being collected for baselining purposes.
Example 2-15 SNMP Sample Configuration
R1#configure terminal
R1(config)#snmp-server community CISCO ro 10
R1(config)#snmp-server community PRESS rw 11
R1(config)#snmp-server contact demo@ciscopress.local
R1(config)#snmp-server location 3rd Floor of Lacoste Building
R1(config)#snmp-server ifindex persist
NetFlow
NetFlow can distinguish between different traffic flows. A flow is a series of packets, all of which have shared header information such as source and destination IP addresses, protocol numbers, port numbers, and type of service (TOS) field information. In addition, they are entering the same interface on the device. NetFlow can keep track of the number of packets and bytes observed in each flow. This information is stored in a flow cache. Flow information is removed from a flow cache if the flow is terminated, times out, or fills to capacity.
You can use the NetFlow feature as a standalone feature on an individual router. Such a standalone configuration might prove useful for troubleshooting because you can observe flows being created as packets enter a router. However, rather than using just a standalone implementation of NetFlow, you can export the entries in a router’s flow cache to a NetFlow collector, which is a software application running on a computer/server in your network. After the NetFlow collector has received flow information over a period of time, analysis software running on the NetFlow collector can produce reports detailing traffic statistics.
Figure 2-4 shows a sample topology in which NetFlow is enabled on router R4, and a NetFlow collector is configured on a PC at IP address 192.168.1.50.
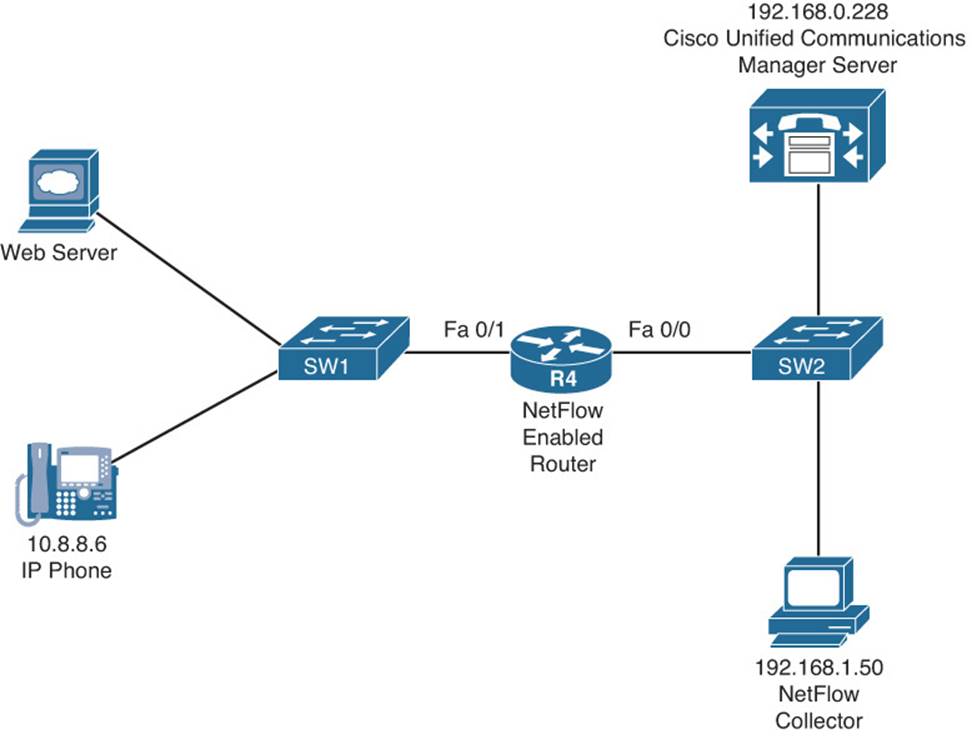
Figure 2-4 NetFlow Sample Topology
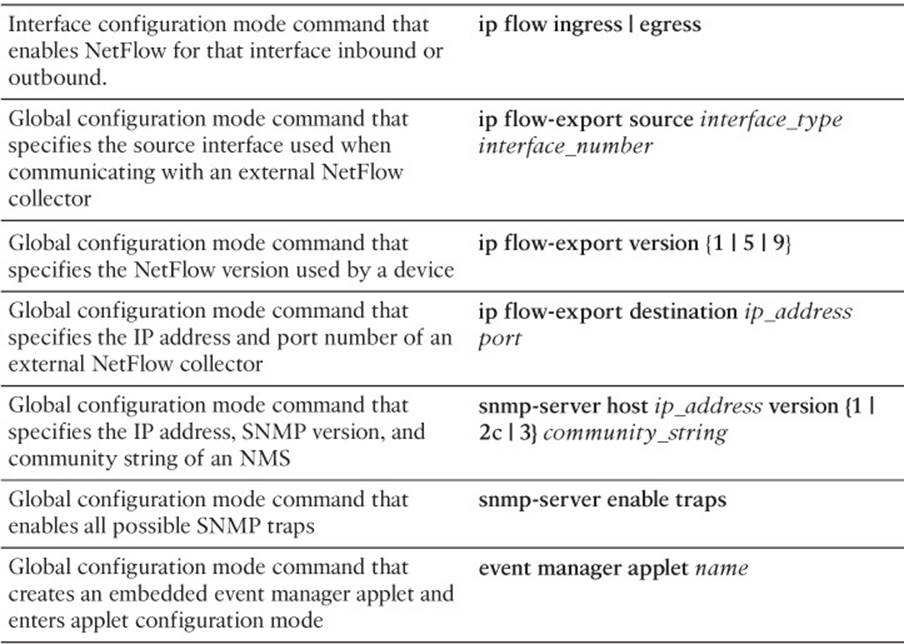
Example 2-16 illustrates the NetFlow configuration on router R4. Notice that the ip flow ingress command is issued for both the Fast Ethernet 0/0 and Fast Ethernet 0/1 interfaces. This ensures that all flows passing through the router, regardless of direction, can be monitored. Although not required, router R4 is configured to report its NetFlow information to a NetFlow collector at IP address 192.168.1.50. The ip flow-export source lo 0 command indicates that all communication between router R4 and the NetFlow collector will be via interface Loopback 0. A NetFlow Version of 5 was specified. You should check the documentation for your NetFlow collector software to confirm which version to configure. Finally, the ip flow-export destination 192.168.1.50 5000 command is issued to specify that the NetFlow collector’s IP address is 192.168.1.50, and communication to the NetFlow collector should be done over UDP port 5000. Because NetFlow does not have a standardized port number, check your NetFlow collector’s documentation when selecting a port.
Example 2-16 NetFlow Sample Configuration
R4#configure terminal
R4(config)#int fa 0/0
R4(config-if)#ip flow ingress
R4(config-if)#exit
R4(config)#int fa 0/1
R4(config-if)#ip flow ingress
R4(config-if)#exit
R4(config)#ip flow-export source lo 0
R4(config)#ip flow-export version 5
R4(config)#ip flow-export destination 192.168.1.50 5000
R4(config)#end
Using your favorite search engine, search for images of “NetFlow collector” (without the quotes) to see various sample images of what a NetFlow collector can provide you. Although an external NetFlow collector is valuable for longer-term flow analysis and can provide detailed graphs and charts, you can issue the show ip cache flow command at a router’s CLI prompt to produce a summary of flow information, as shown in Example 2-17. A troubleshooter can look at the output displayed in Example 2-17 and be able to confirm, for example, that traffic is flowing between IP address 10.8.8.6 (a Cisco IP Phone) and 192.168.0.228 (a Cisco Unified Communications Manager server).
Example 2-17 Viewing NetFlow Information
R4#show ip cache flow
...OUTPUT OMITTED...
Protocol Total Flows Packets Bytes Packets Active(Sec) Idle(Sec)
---------- Flows /Sec /Flow /Pkt /Sec /Flow /Flow
TCP-Telnet 12 0.0 50 40 0.1 15.7 14.2
TCP-WWW 12 0.0 40 785 0.1 7.1 6.2
TCP-other 536 0.1 1 55 0.2 0.3 10.5
UDP-TFTP 225 0.0 4 59 0.1 11.9 15.4
UDP-other 122 0.0 114 284 3.0 15.9 15.4
ICMP 41 0.0 13 91 0.1 49.9 15.6
IP-other 1 0.0 389 60 0.0 1797.1 3.4
Total: 949 0.2 18 255 3.8 9.4 12.5
SrcIf SrcIPaddress DstIf DstIPaddress Pr SrcP DstP Pkts
Fa0/0 10.3.3.1 Null 224.0.0.10 58 0000 0000 62
Fa0/1 10.8.8.6 Fa0/0 192.168.0.228 06 C2DB 07D0 2
Fa0/0 192.168.0.228 Fa0/1 10.8.8.6 06 07D0 C2DB 1
Fa0/0 192.168.1.50 Fa0/1 10.8.8.6 11 6002 6BD2 9166
Fa0/1 10.8.8.6 Fa0/0 192.168.1.50 11 6BD2 6002 9166
Fa0/0 10.1.1.2 Local 10.3.3.2 06 38F2 0017 438
Providing Notifications for Network Events
Whereas responding to problem reports from users is a reactive form of troubleshooting, monitoring network devices for significant events and responding to those events is a proactive form of troubleshooting. For example, before a user loses connectivity with the Internet, a router that is dual-homed to the Internet might report the event of one of its Internet connections going down. The redundant link can then be repaired, in response to the notification, thus resolving the problem without users being impacted.
Both syslog and SNMP are protocols that can report the occurrence of specific events on a network device, and NetFlow can report events related to network traffic flows. Although these protocols by themselves lack a mechanism to alert a network administrator (for example, via e-mail) when a network event is logged, third-party software is available that can selectively alert appropriate personnel when specific events are logged.
Earlier, this section discussed how a network device running an SNMP agent can be queried for information from an NMS. However, a network device running an SNMP agent can also initiate communication with an NMS. If an interface goes down, for example, the SNMP agent on a managed network device can send a message containing information about the interface state change to an NMS, and then the NMS can notify a network administrator via e-mail. These messages, from the agent to the NMS, are called traps. These traps require the NMS to interpret them because they are not in an easy, readable format.

Example 2-18 demonstrates how to enable a router to send SNMP traps to an NMS. The snmp-server host 192.168.1.50 version 2c CISCOPRESS command points router R4 to an SNMP server (that is, an NMS) at IP address 192.168.1.50. The SNMP server is configured for SNMPversion 2c and a community string of CISCOPRESS; therefore, we include that information on the router for communication purposes with the NMS.
The snmp-server enable traps command is used to enable all traps on the router. If you only need to enable specific traps, you may do so by adding the individual trap keyword to the snmp-server enable traps command (for example, snmp-server enable traps bgp). You can view the enabled traps by using the show run | include traps command.
Example 2-18 Enabling SNMP Traps
R4#configure terminal
R4(config)#snmp-server host 192.168.1.150 version 2c CISCOPRESS
R4(config)#snmp-server enable traps
R4(config)#end
R4#show run | include traps
snmp-server enable traps snmp authentication linkdown linkup coldstart warmstart
snmp-server enable traps vrrp
snmp-server enable traps ds1
snmp-server enable traps gatekeeper
snmp-server enable traps tty
snmp-server enable traps eigrp
snmp-server enable traps xgcp
snmp-server enable traps ds3
...OUTPUT OMITTED...
The messages received via syslog and SNMP are predefined within Cisco IOS. Although this is a rather large collection of predefined messages and should accommodate most network management requirements, Cisco IOS also supports a feature called Embedded Event Manager (EEM) that enables you to create your own event definitions and specify custom responses to those events. An event can be defined and triggered based on a syslog message, SNMP trap, and even the issuing of a specific Cisco IOS command, as just a few examples. In response to a defined event, EEM can perform various actions, including sending an SNMP trap to an NMS, writing a log message to a syslog server, executing specified Cisco IOS commands, capturing output of specific show commands, sending an e-mail to an appropriate party, or executing a tool command language (Tcl) script. From this short list, you can already see how powerful the EEM can be.
To illustrate the basic configuration steps involved in configuring an EEM applet, consider Example 2-19. The purpose of this configuration is to create a syslog message that will be displayed on the router console when someone clears the router’s interface counters using the clear counterscommand. The message reminds the administrator to update the network documentation and lists the rationale for clearing the interface counters.
Example 2-19 EEM Sample Configuration
R4#configure terminal
R4(config)#event manager applet COUNTER-RESET
R4(config-applet)#event cli pattern "clear counters" sync no skip no occurs 1
R4(config-applet)#action A syslog priority informational msg "Please update network
documentation to record why the counters were reset."
R4(config-applet)#end
The event manager applet COUNTER-RESET command creates an EEM applet named COUNTER-RESET and enters applet configuration mode. The event command specifies what you are looking for in your custom-defined event. In this example, you are looking for the CLI command clear counters. Note that the clear counters command would be detected even if a shortcut (for example, cle co) were used. The sync no parameter says that the EEM policy will run asynchronously with the CLI command. Specifically, the EEM policy will not be executed before the CLI command executes. The skip no parameter says that the CLI command will not be skipped (that is, the CLI command will be executed). Finally, the occurs 1 parameter indicates that the EEM event is triggered by a single occurrence of the clear counters command being issued.
The action command is then entered to indicate what should be done in response to the defined event. In Example 2-19, the action is given a locally significant name of A and is assigned a syslog priority level of informational. The specific action to be taken is producing this informational message saying: Please update network documentation to record why the counters were reset.
To verify the operation of the EEM configuration presented in Example 2-19, the clear counters command is executed in Example 2-20. Notice that entering the clear counters command triggers the custom-defined event, resulting in generation of a syslog message reminding an administrator to document the reason they cleared the interface counters.
Example 2-20 Testing EEM Configuration
R4#clear counters
Clear "show interface" counters on all interfaces [confirm]
R4#
%HA_EM-6-LOG: COUNTER-RESET: Please update network documentation to record why the
counters were reset.
R4#
Cisco Support Tools
Cisco has several other configuration, troubleshooting, and maintenance tools available on its website:
http://www.cisco.com/en/US/support/tsd_most_requested_tools.html
Some of the tools available at this website require login credentials with appropriate privilege levels.
Using Cisco IOS to Verify and Define the Problem
When you receive a trouble ticket, your first couple of tasks should be to verify and define the problem. Some relatively simple tasks can confirm the issue reported and in most cases help to focus your troubleshooting efforts. Three easy-to-use tools built in to the Cisco IOS can help you verify connectivity and further define the problem. They are ping, Telnet, and traceroute. This section discusses how ping, Telnet, and traceroute can verify the problem and help focus our efforts.
Ping
A common command, which you can use to check network connectivity, is the ping command. If you recall from Chapter 1, a successful ping indicates that Layer 1, 2, and 3 of the OSI model are functioning, and so you can focus your attention on higher OSI layers. The same holds true in reverse with an unsuccessful ping. If it is unsuccessful, you focus your troubleshooting on the lower layers of the OSI model.
A basic ping command sends Internet Control Message Protocol (ICMP) echo messages to a specified destination. For every ICMP echo reply received from that specified destination, an exclamation point appears in the output, as shown in Example 2-21.
Example 2-21 Basic ping Command
R1#ping 10.4.4.4
Type escape sequence to abort.
Sending 5, 100-byte ICMP Echos to 10.4.4.4, timeout is 2 seconds:
!!!!!
The ping command does have several options that can prove useful during troubleshooting, including the following:
![]() size: Specifies the number of bytes per datagram (defaults to 100 bytes on Cisco IOS)
size: Specifies the number of bytes per datagram (defaults to 100 bytes on Cisco IOS)
![]() repeat: Specifies the number of ICMP echo messages sent (defaults to 5)
repeat: Specifies the number of ICMP echo messages sent (defaults to 5)
![]() timeout: Specifies the number of seconds to wait for an ICMP echo reply (defaults to 2)
timeout: Specifies the number of seconds to wait for an ICMP echo reply (defaults to 2)
![]() source: Specifies the source of the ICMP echo datagrams
source: Specifies the source of the ICMP echo datagrams
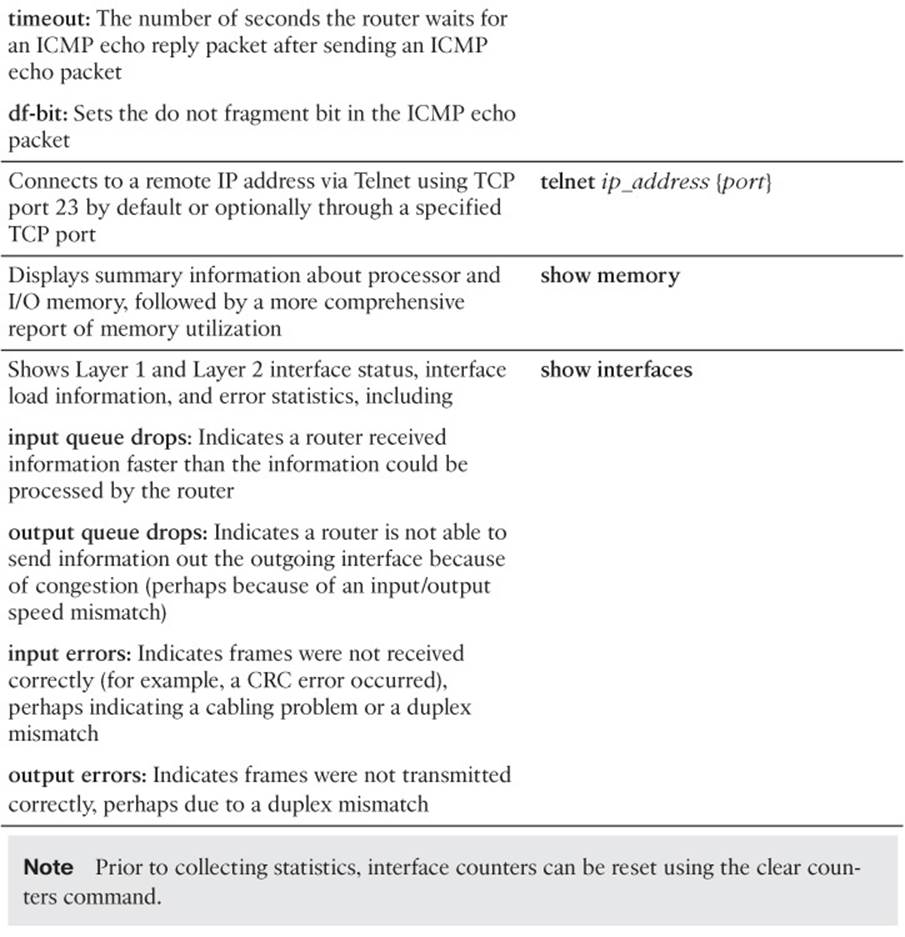
![]() df-bit: Sets the do not fragment bit in the ICMP echo datagram
df-bit: Sets the do not fragment bit in the ICMP echo datagram
Not only can a ping command indicate that a given IP address is reachable, but the response to a ping command might provide insight into the nature of a problem. For example, if the ping results indicate alternating failures and successes (that is, !.!.!), a troubleshooter might conclude that traffic is being load balanced between the source and destination IP addresses. Traffic flowing across one path is successful, whereas traffic flowing over the other path is failing.
You can also use the ping command to create a load on the network to troubleshoot the network under heavy use. For example, you can specify a datagram size of 1500 bytes, along with a large byte count (repeat value) and a timeout of 0 seconds, as shown in Example 2-22.
Notice that all the pings failed. These failures occurred because of the 0-second timeout. The router did not wait before considering the ping to have failed and sending another ICMP echo message. Remember, in this case, we do not care that it failed; we are doing this for the artificial load generated for testing purposes.
Example 2-22 Creating a Heavy Load on the Network
R1#ping 10.4.4.4 size 1500 repeat 9999 timeout 0
Type escape sequence to abort.
Sending 9999, 1500-byte ICMP Echos to 10.4.4.4, timeout is 0 seconds:
......................................................................
......................................................................
......................................................................
...OUTPUT OMITTED...
Perhaps you suspect that an interface has a nondefault maximum transmission unit (MTU) size, which is commonly seen with Q-n-Q tunnels, generic routing encapsulation (GRE) tunnels, and even Point-to-Point Protocol over Ethernet (PPPoE) interfaces. To verify your suspicion, you could send ICMP echo messages across that interface using the df-bit and size options of the ping command to specify the size of the datagram to be sent. The df-bit option instructs a router to drop this datagram rather than fragmenting it if fragmentation is required.
Example 2-23 shows the sending of pings with the do not fragment bit set. Notice the M in the ping responses, which indicates that fragmentation was required but could not be performed because the do not fragment bit was set. Therefore, you can conclude that a link between the source and destination is using a nonstandard MTU (that is, an MTU less than 1500 bytes).
Example 2-23 Pinging with the Do Not Fragment Bit Set
R1#ping 10.4.4.4 size 1500 df-bit
Type escape sequence to abort.
Sending 5, 1500-byte ICMP Echos to 10.4.4.4, timeout is 2 seconds:
Packet sent with the DF bit set
M.M.M
The challenge is how to determine the nondefault MTU size without multiple manual attempts. An extended ping can help with such a scenario. Consider Example 2-24, which issues the ping command without command-line parameters. This invokes the extended ping feature. The extended ping feature enables you to granularly customize your pings. For example, you could specify a range of datagram sizes to use in your pings to help determine the size of a nondefault MTU. Specifically, in Example 2-24 you could determine that the MTU across at least one of the links from the source to the destination IP address was set to 1450 bytes, because the M ping responses begin after 51 ICMP echo datagrams were sent (with datagram sizes in the range of 1400 to 1450 bytes).
Example 2-24 Extended Ping Performing a Ping Sweep
R1#ping
Protocol [ip]:
Target IP address: 10.4.4.4
Repeat count [5]: 1
Datagram size [100]:
Timeout in seconds [2]:
Extended commands [n]: y
Source address or interface:
Type of service [0]:
Set DF bit in IP header? [no]: yes
Validate reply data? [no]:
Data pattern [0xABCD]:
Loose, Strict, Record, Timestamp, Verbose[none]:
Sweep range of sizes [n]: y
Sweep min size [36]: 1400
Sweep max size [18024]: 1500
Sweep interval [1]:
Type escape sequence to abort.
Sending 101, [1400..1500]-byte ICMP Echos to 10.4.4.4, timeout is 2 seconds:
Packet sent with the DF bit set