CCNP Routing and Switching TSHOOT 300-135 Official Cert Guide (2015)
Part I. Fundamental Troubleshooting and Maintenance Concepts
Chapter 3. Troubleshooting Device Performance
This chapter covers the following topics:
![]() Troubleshooting Switch Performance Issues: This section identifies common reasons why a switch might not be performing as expected.
Troubleshooting Switch Performance Issues: This section identifies common reasons why a switch might not be performing as expected.
![]() Troubleshooting Router Performance Issues: This section identifies common reasons why a router might not be performing as expected.
Troubleshooting Router Performance Issues: This section identifies common reasons why a router might not be performing as expected.
Switches and routers consist of many different components. For example, they contain a processor, memory (volatile such as RAM and nonvolatile such as NVRAM and flash), and various interfaces. They are also responsible for performing many different tasks, such as routing, switching, and building all the necessary tables and structures needed to perform various tasks.
The building of the tables and structures is done by the CPU. The storage of these tables and structures is in some form of memory. The routers and switches forward traffic from one interface to another interface based on these tables and structures. Therefore, if a router’s or switch’s CPU is constantly experiencing high utilization, the memory is overloaded, or the interface buffers are full, these devices will experience performance issues.
This chapter discusses common reasons for high CPU and memory utilization on routers and switches, in addition to how we can recognize them. This chapter also covers interface statistics because they sometimes provide the initial indication of some type of issue.
“Do I Know This Already?” Quiz
The “Do I Know This Already?” quiz allows you to assess whether you should read this entire chapter thoroughly or jump to the “Exam Preparation Tasks” section. If you are in doubt about your answers to these questions or your own assessment of your knowledge of the topics, read the entire chapter. Table 3-1 lists the major headings in this chapter and their corresponding “Do I Know This Already?” quiz questions. You can find the answers in Appendix A, “Answers to the ‘Do I Know This Already?’ Quizzes.”
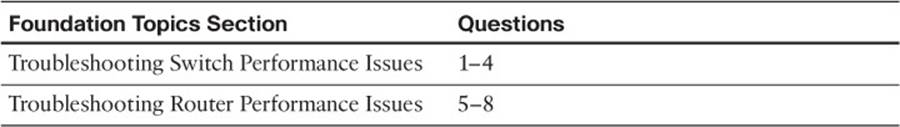
Table 3-1 “Do I Know This Already?” Section-to-Question Mapping
Caution
The goal of self-assessment is to gauge your mastery of the topics in this chapter. If you do not know the answer to a question or are only partially sure of the answer, you should mark that question as wrong for purposes of the self-assessment. Giving yourself credit for an answer that you correctly guess skews your self-assessment results and might provide you with a false sense of security.
1. What are the components of a switch’s control plane? (Choose two.)
a. Backplane
b. Memory
c. CPU
d. Forwarding logic
2. What are good indications that you have a duplex mismatch? (Choose two.)
a. The half-duplex side of the connection has a high number of FCS errors.
b. The full-duplex side of the connection has a high number of FCS errors.
c. The half-duplex side of the connection has a high number of late collisions.
d. The full-duplex side of the connection has a high number of late collisions.
3. Which of the following are situations when a switch’s TCAM would punt a packet to the switch’s CPU? (Choose the three best answers.)
a. OSPF sends a multicast routing update.
b. An administrator telnets to a switch.
c. An ACL is applied to a switchport.
d. A switch’s TCAM has reached capacity.
4. The output of a show processes cpu command on a switch displays the following in the first line of the output:
CPU utilization for five seconds: 10%/7%; one minute: 12%; five minutes: 6%
Based on the output, what percent of the switch’s CPU is being consumed with interrupts?
a. 10 percent
b. 7 percent
c. 12 percent
d. 6 percent
5. Which router process is in charge of handling interface state changes?
a. TCP Timer process
b. IP Background process
c. Net Background process
d. ARP Input process
6. Which of the following is the least efficient (that is, the most CPU intensive) of a router’s packet-switching modes?
a. Fast switching
b. CEF
c. Optimum switching
d. Process switching
7. What command is used to display the contents of a router’s FIB?
a. show ip cache
b. show processes cpu
c. show ip route
d. show ip cef
8. Identify common reasons that a router displays a MALLOCFAIL error. (Choose the two best answers.)
a. Cisco IOS bug
b. Security issue
c. QoS issue
d. BGP filtering
Foundation Topics
Troubleshooting Switch Performance Issues
Switch performance issues can be tricky to troubleshoot because the problem reported is often subjective. For example, if a user reports that the network is running “slowly,” the user’s perception might mean that the network is slow compared to what he expects. However, network performance might very well be operating at a level that is hampering productivity and at a level that is indeed below its normal level of operation. At that point, as part of the troubleshooting process, you need to determine what network component is responsible for the poor performance. Rather than a switch or a router, the user’s client, server, or application could be the cause of the performance issue.
If you do determine that the network performance is not meeting technical expectations (as opposed to user expectations), you should isolate the source of the problem and diagnose the problem on that device. This section assumes that you have isolated the device causing the performance issue, and that device is a Cisco Catalyst switch.
Cisco Catalyst Switch Troubleshooting Targets
Cisco offers a variety of Catalyst switch platforms, with different port densities, different levels of performance, and different hardware. Therefore, troubleshooting switches will be platform dependent. Many similarities do exist, however. For example, all Cisco Catalyst switches include the following components:

![]() Ports: A switch’s ports physically connect the switch to other network devices. These ports (also known as interfaces) allow a switch to receive and transmit traffic.
Ports: A switch’s ports physically connect the switch to other network devices. These ports (also known as interfaces) allow a switch to receive and transmit traffic.
![]() Forwarding logic: A switch contains hardware that makes forwarding decisions based on different tables in the data plane.
Forwarding logic: A switch contains hardware that makes forwarding decisions based on different tables in the data plane.
![]() Backplane: A switch’s backplane physically interconnects a switch’s ports. Therefore, depending on the specific switch architecture, frames flowing through a switch enter through a port (that is, the ingress port), flow across the switch’s backplane, and are forwarded out of another port (that is, an egress port).
Backplane: A switch’s backplane physically interconnects a switch’s ports. Therefore, depending on the specific switch architecture, frames flowing through a switch enter through a port (that is, the ingress port), flow across the switch’s backplane, and are forwarded out of another port (that is, an egress port).
![]() Control plane: A switch’s CPU and memory reside in the control plane. This control plane is responsible for running the switch’s operating system and building the necessary structures used to make forwarding decisions—for example, the MAC address table and the spanning-tree topology to name a few.
Control plane: A switch’s CPU and memory reside in the control plane. This control plane is responsible for running the switch’s operating system and building the necessary structures used to make forwarding decisions—for example, the MAC address table and the spanning-tree topology to name a few.
Figure 3-1 depicts these components within a switch. Notice that the control plane does not directly participate in the frame-forwarding process. However, the forwarding logic contained in the forwarding hardware comes from the control plane. Therefore, an indirect relationship exists between frame forwarding and the control plane. As a result, a continuous load on the control plane could, over time, impact the rate at which the switch forwards frames. Also, if the forwarding hardware is operating at maximum capacity, the control plane begins to provide the forwarding logic. So, although the control plane does not architecturally appear to impact switch performance, it should be considered when troubleshooting.
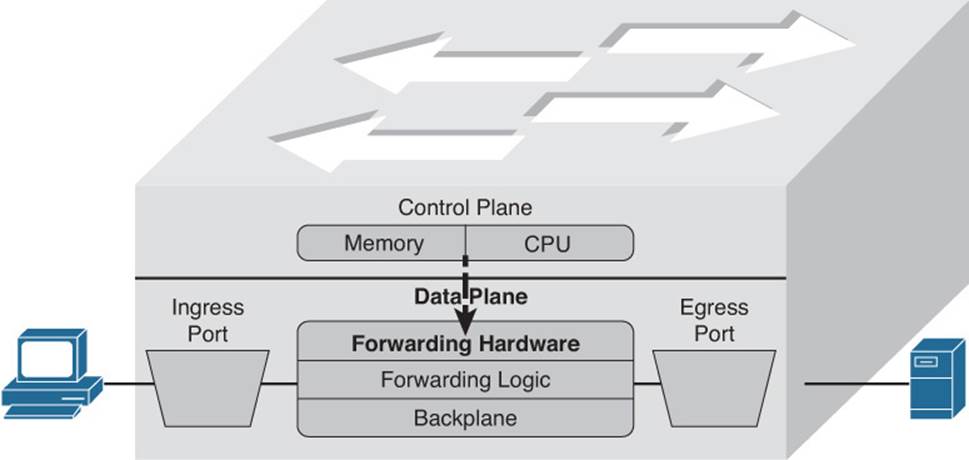
Figure 3-1 Cisco Catalyst Switch Hardware Components
The following are two common troubleshooting targets to consider when diagnosing a suspected switch issue:
![]() Port errors
Port errors
![]() Mismatched duplex settings
Mismatched duplex settings
The sections that follow evaluate these target areas in greater detail.
Port Errors
When troubleshooting a suspected Cisco Catalyst switch issue, a good first step is to check port statistics. For example, examining port statistics can let a troubleshooter know whether an excessive number of frames are being dropped. If a TCP application is running slowly, the reason might be that TCP flows are going into TCP slow start, which causes the window size, and therefore the bandwidth efficiency, of TCP flows to be reduced. A common reason that a TCP flow enters slow start is packet drops. Similarly, packet drops for a UDP flow used for voice or video could result in noticeable quality degradation, because dropped UDP segments are not retransmitted.
Although dropped frames are most often attributed to network congestion, another possibility is that the cabling could be bad. To check port statistics, a troubleshooter could leverage the show interfaces command. Consider Example 3-1, which shows the output of the show interfaces gig 1/0/9 counters command on a Cisco Catalyst 3750-E switch. Notice that this output shows the number of inbound and outbound frames seen on the specified port.
Example 3-1 show interfaces gig 1/0/9 counters Command Output
SW1#show interfaces gig 1/0/9 counters
Port InOctets InUcastPkts InMcastPkts InBcastPkts
Gi1/0/9 31265148 20003 3179 1
Port OutOctets OutUcastPkts OutMcastPkts OutBcastPkts
Gi1/0/9 18744149 9126 96 6
To view errors that occurred on a port, you could add the keyword of errors after the show interfaces interface_type interface_number counters command. Example 3-2 illustrates sample output from the show interfaces gig 1/0/9 counters errors command.
Example 3-2 show interfaces gig 1/0/9 counters errors Command Output
SW1#show interfaces gig 1/0/9 counters errors
Port Align-Err FCS-Err Xmit-Err Rcv-Err UnderSize
Gi1/0/9 0 0 0 0 0
Port Single-Col Multi-Col Late-Col Excess-Col Carri-Sen Runts Giants
Gi1/0/9 5603 0 5373 0 0 0 0
Table 3-2 provides a reference for the specific errors that might show up in the output of the show interfaces interface_type interface_number counters errors command.
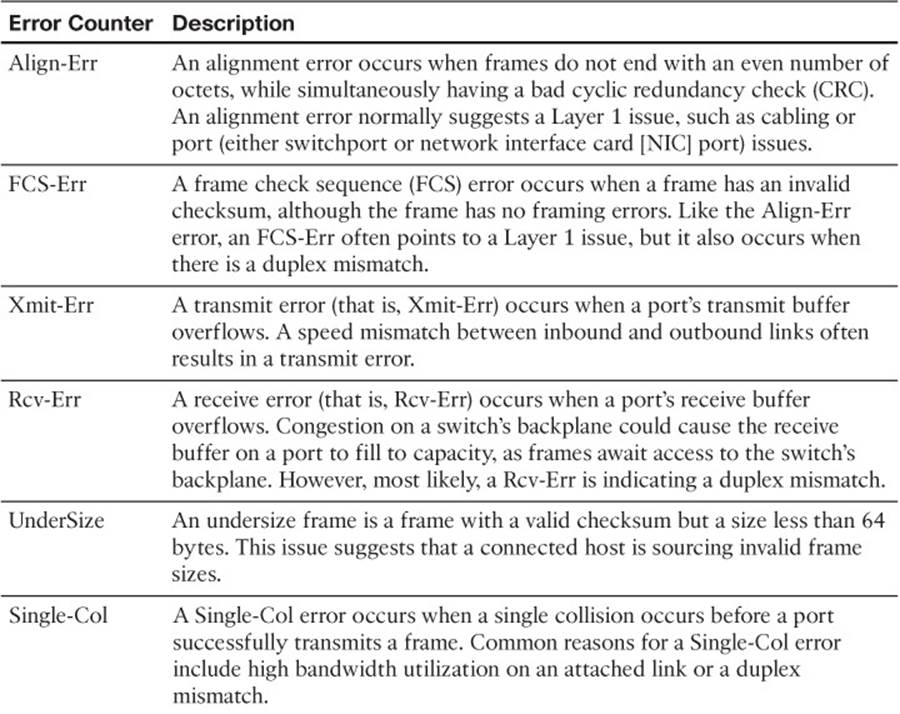
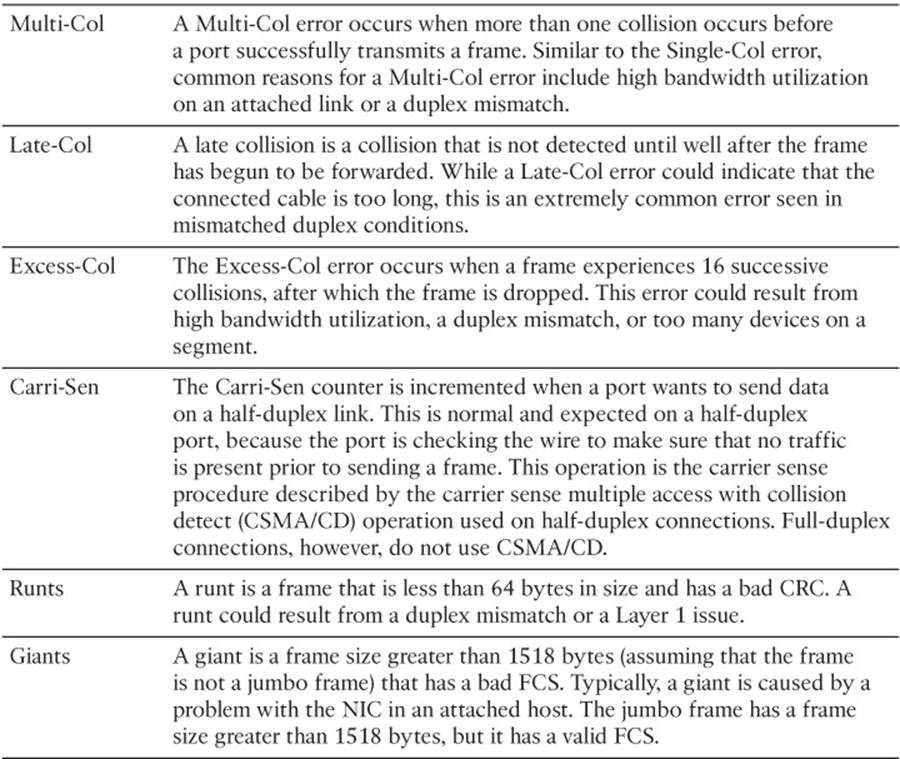
Table 3-2 Errors in the show interfaces interface_type interface_number counters errors Command
Mismatched Duplex Settings
As shown in Table 3-2, duplex mismatches can cause a wide variety of port errors. Keep in mind that almost all network devices, other than shared media hubs, can run in full-duplex mode. Therefore, if you have no hubs in your network, all devices should be running in full-duplex mode.
Cisco Catalyst switchports should be configured to autonegotiate both speed and duplex, which is the default setting. Two justifications for this recommendation are as follows:
![]() If a connected device supports only half-duplex, it is better for a switchport to negotiate down to half-duplex and run properly than to be forced to run full-duplex, which would result in multiple errors.
If a connected device supports only half-duplex, it is better for a switchport to negotiate down to half-duplex and run properly than to be forced to run full-duplex, which would result in multiple errors.
![]() The automatic medium-dependent interface crossover (auto-MDIX) feature can automatically detect whether a port needs a crossover or a straight-through cable to interconnect with an attached device and adjust the port to work regardless of which cable type is connected. You can enable this feature in interface configuration mode with the mdix auto command on some models of Cisco Catalyst switches. However, the auto-MDIX feature requires that the port autonegotiate both speed and duplex.
The automatic medium-dependent interface crossover (auto-MDIX) feature can automatically detect whether a port needs a crossover or a straight-through cable to interconnect with an attached device and adjust the port to work regardless of which cable type is connected. You can enable this feature in interface configuration mode with the mdix auto command on some models of Cisco Catalyst switches. However, the auto-MDIX feature requires that the port autonegotiate both speed and duplex.
In a mismatched duplex configuration, a switchport at one end of a connection is configured for full-duplex, whereas a switchport at the other end of a connection is configured for half-duplex. Among the different errors previously listed in Table 3-2, two of the biggest indicators of a duplex mismatch are a high FCS-Err counter and a high Late-Col counter. Specifically, a high FCS-Err counter is common to find on the full-duplex end of a connection with a mismatched duplex, whereas a high Late-Col counter is common on the half-duplex end of the connection.
To illustrate, examine Examples 3-3 and 3-4, which display output based on the topology depicted in Figure 3-2. Example 3-3 shows the half-duplex end of a connection, and Example 3-4 shows the full-duplex end of a connection. The half-duplex end sends a frame because it thinks it is safe to send based on the CSMA/CD rule. The full-duplex end sends a frame because it is always safe to send and a collision should not occur. When the collision occurs in this example, SW1 will cease to transmit the remainder of the frame (because the port is half-duplex) and will record that a late collision occurred. However, SW2 will continue to send and receive frames. The frames it receives will not be complete because SW1 did not send the entire frame. Therefore, the FCS (mathematical checksum) of the frame does not match, and we have FCS errors on the full-duplex side.

Figure 3-2 Topology with Duplex Mismatch
Example 3-3 Output from the show interfaces gig 1/0/9 counters errors and the show interfaces gig 1/0/9 | include duplex Commands on a Half-Duplex Port
SW1# show interfaces gig 1/0/9 counters errors
Port Align-Err FCS-Err Xmit-Err Rcv-Err UnderSize
Gi1/0/9 0 0 0 0 0
Port Single-Col Multi-Col Late-Col Excess-Col Carri-Sen Runts Giants
Gi1/0/9 5603 0 5373 0 0 0 0
SW1#show interfaces gig 1/0/9 include duplex
Half-duplex, 100Mb/s, link type is auto, media type is 10/100/1000BaseTX
SW1#
Example 3-4 Output from the show interfaces fa 5/47 counters errors and the show interfaces fa 5/47 | include duplex Commands on a Full-Duplex Port
SW2#show interfaces fa 5/47 counters errors
Port Align-Err FCS-Err Xmit-Err Rcv-Err UnderSize OutDiscards
Fa5/47 0 5248 0 5603 27 0
Port Single-Col Multi-Col Late-Col Excess-Col Carri-Sen Runts Giants
Fa5/47 0 0 0 0 0 227 0
Port SQETest-Err Deferred-Tx IntMacTx-Err IntMacRx-Err Symbol-Err
Fa5/47 0 0 0 0 0
SW2#show interfaces fa 5/47 include duplex
Full-duplex, 100Mb/s
SW2#
In your troubleshooting, even if you only have access to one of the switches, if you suspect a duplex mismatch, you could change the duplex settings on the switch over which you do have control. Then, you could clear the interface counters to see whether the errors continue to increment. You could also perform the same activity (for example, performing a file transfer) that the user was performing when he noticed the performance issue. By comparing the current performance to the performance experienced by the user, you might be able to conclude that the problem has been resolved by correcting a mismatched duplex configuration.
TCAM Troubleshooting
As previously mentioned, the two primary components of forwarding hardware are forwarding logic and backplane. A switch’s backplane, however, is rarely the cause of a switch performance issue, because most Cisco Catalyst switches have high-capacity backplanes. However, it is conceivable that in a modular switch chassis, the backplane will not have the throughput to support a fully populated chassis, where each card in the chassis supports the highest combination of port densities and port speeds.
The architecture of some switches allows groups of switchports to be handled by separate hardware. Therefore, you might experience a performance gain by simply moving a cable from one switchport to another. However, to strategically take advantage of this design characteristic, you must be very familiar with the architecture of the switch with which you are working.
A multilayer switch’s forwarding logic can impact switch performance. A switch’s forwarding logic is compiled into a special type of memory called ternary content-addressable memory (TCAM), as illustrated in Figure 3-3. TCAM works with a switch’s Cisco Express Forwarding (CEF)feature in the data plane (hardware) to provide extremely fast forwarding decisions. This is accomplished because information from the control plane relating to routing processes such as unicast routing, multicast routing, and policy-based routing, as well as information related to traffic policies such as security and quality of service (QoS) access control lists (ACLs), is populated into the TCAM tables at the data plane (hardware). However, if a switch’s TCAM is unable to forward traffic (for example, the TCAM table is full and does not have the information needed to forward the traffic), that traffic is sent (punted) to the CPU so that it can be forwarded by the switch’s CPU, which has a limited forwarding capability.
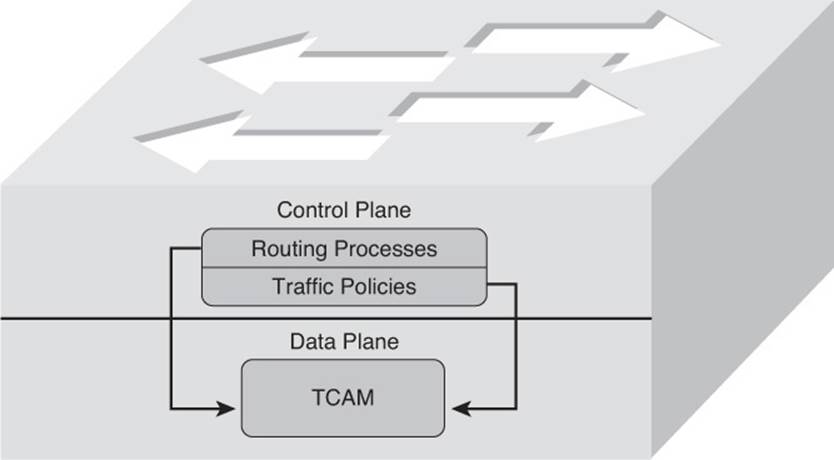
Figure 3-3 Populating the TCAM
The process of the TCAM sending packets to a switch’s CPU is called punting. Consider a few reasons why a packet might be punted from a TCAM to its CPU:
![]() Routing protocols, in addition to other control plane protocols such as Spanning Tree Protocol (STP), that send multicast or broadcast traffic will have that traffic sent to the CPU for processing.
Routing protocols, in addition to other control plane protocols such as Spanning Tree Protocol (STP), that send multicast or broadcast traffic will have that traffic sent to the CPU for processing.
![]() Someone connecting to a switch administratively (for example, establishing a Telnet or Secure Shell [SSH] session with the switch) will have his packets sent to the CPU for processing.
Someone connecting to a switch administratively (for example, establishing a Telnet or Secure Shell [SSH] session with the switch) will have his packets sent to the CPU for processing.
![]() Packets using a feature not supported in hardware (for example, packets traveling over a generic routing encapsulation [GRE] tunnel) are sent to the CPU for processing.
Packets using a feature not supported in hardware (for example, packets traveling over a generic routing encapsulation [GRE] tunnel) are sent to the CPU for processing.
![]() If a switch’s TCAM has reached capacity, additional packets are punted to the CPU. A TCAM might reach capacity if it has too many installed routes or configured access control lists. This is usually the case when you attempt to use a lower-end switch in place of a higher-end switch to save money. This is not generally a good practice.
If a switch’s TCAM has reached capacity, additional packets are punted to the CPU. A TCAM might reach capacity if it has too many installed routes or configured access control lists. This is usually the case when you attempt to use a lower-end switch in place of a higher-end switch to save money. This is not generally a good practice.
From the events listed, the event most likely to cause a switch performance issue is a TCAM filling to capacity. Therefore, when troubleshooting switch performance, you might want to investigate the state of the switch’s TCAM. TCAM verification commands vary among platforms, so make sure to check the documentation for your switch model.
On most switch platforms, TCAMs cannot be upgraded. Therefore, if you conclude that a switch’s TCAM is the source of the performance problems being reported, you could either use a switch with higher-capacity TCAMs or reduce the number of entries in a switch’s TCAM. For example, you could try to optimize your ACLs by being more creative with the entries or leverage route summarization to reduce the number of route entries maintained by a switch’s TCAM. Also, some switches (for example, Cisco Catalyst 2960, 3560, or 3750 series switches) enable you to change the amount of TCAM memory allocated to different switch features. This allows you to “borrow” TCAM memory that was reserved for one feature and use it for another feature, optimizing the resources on the switch. This can be accomplished by changing the Switch Database Management (SDM) template on the switch. Refer to Example 3-5, which displays the TCAM resource utilization on a Catalyst 3750E switch. Notice how a finite amount of resources has been reserved for various services and features on the switch. There is a maximum value for unicast MAC addresses, IPv4 unicast and multicast routes, as well as QoS and security access control entries. It appears from this example that SW2 has maxed out the amount of resources that are reserved for IPv4 unicast indirectly connected routes. Therefore, if a packet needs to be forwarded and the needed information is not in the TCAM, it will be punted to the CPU.
Example 3-5 show platform tcam utilization Command Output on a Cisco Catalyst Switch
SW2#show platform tcam utilization
CAM Utilization for ASIC# 0 Max Used
Masks/Values Masks/values
Unicast mac addresses: 6364/6364 35/35
IPv4 IGMP groups + multicast routes: 1120/1120 1/1
IPv4 unicast directly-connected routes: 6144/6144 9/9
IPv4 unicast indirectly-connected routes: 2048/2048 2048/2048
IPv4 policy based routing aces: 442/442 12/12
IPv4 qos aces: 512/512 21/21
IPv4 security aces: 954/954 42/42
Note: Allocation of TCAM entries per feature uses
a complex algorithm. The above information is meant
to provide an abstract view of the current TCAM utilization
To reallocate more resources to IPv4 routing, you can change the SDM template. Using the show sdm prefer command on SW2, as shown in Example 3-6, indicates that the current SDM template is “desktop default,” which is the default template on a 3750E Catalyst switch. In this case, more resources need to be reserved for IPv4 routing; therefore, the template needs to be changed.
Example 3-6 show sdm prefer Command Output on a Cisco Catalyst Switch
SW2#show sdm prefer
The current template is "desktop default" template.
The selected template optimizes the resources in
the switch to support this level of features for
8 routed interfaces and 1024 VLANs.
number of unicast mac addresses: 6K
number of IPv4 IGMP groups + multicast routes: 1K
number of IPv4 unicast routes: 8K
number of directly-connected IPv4 hosts: 6K
number of indirect IPv4 routes: 2K
number of IPv4 policy based routing aces: 0
number of IPv4/MAC qos aces: 0.5K
number of IPv4/MAC security aces: 0.875k
Using the global configuration command sdm prefer, as shown in Example 3-7, allows you to change the SDM template. In this case, the SDM template is being changed to routing so that more resources will be used for IPv4 unicast routing.
Example 3-7 Changing the SDM Template on a Cisco 3750E Catalyst Switch
SW2#config t
Enter configuration commands, one per line. End with CNTL/Z.
SW2(config)#sdm prefer ?
access Access bias
default Default bias
dual-ipv4-and-ipv6 Support both IPv4 and IPv6
indirect-ipv4-and-ipv6-routing Supports more V4 and V6 Indirect Routes
lanbase-routing Supports both IPv4 and IPv6 Static Routing
routing Unicast bias
vlan VLAN bias
SW2(config)#sdm prefer routing
Changes to the running SDM preferences have been stored, but cannot take effect
until the next reload.
Use 'show sdm prefer' to see what SDM preference is currently active.
SW2(config)#exit
SW2#reload
System configuration has been modified. Save? [yes/no]: yes
Building configuration...
[OK]
Proceed with reload? [confirm]
%SYS-5-RELOAD: Reload requested by console. Reload Reason: Reload command.
After the reload, notice how the SDM template is listed as “desktop routing” in Example 3-8 and that more resources are now dedicated to IPv4 indirect routes. However, also notice that while more resources are allocated to IPv4 unicast routes, fewer resources are allocated to other resources, such as unicast MAC addresses.
Example 3-8 Verifying That the SDM Template Was Changed After Reload
SW2#show sdm prefer
The current template is "desktop routing" template.
The selected template optimizes the resources in
the switch to support this level of features for
8 routed interfaces and 1024 VLANs.
number of unicast mac addresses: 3K
number of IPv4 IGMP groups + multicast routes: 1K
number of IPv4 unicast routes: 11K
number of directly-connected IPv4 hosts: 3K
number of indirect IPv4 routes: 8K
number of IPv4 policy based routing aces: 0.5K
number of IPv4/MAC qos aces: 0.5K
number of IPv4/MAC security aces: 1K
In Example 3-9, the output of show platform tcam utilization shows that the max masks/values are now 8144/8144 for IPv4 unicast indirectly connected routes; before, they were 2048. In addition, the used masks/values are now 3148, and therefore, the TCAM can forward traffic without having to punt the packets to the CPU.
Example 3-9 Verifying the tcam utilization on the 3750E Catalyst Switch
SW2#show platform tcam utilization
CAM Utilization for ASIC# 0 Max Used
Masks/Values Masks/values
Unicast mac addresses: 3292/3292 35/35
IPv4 IGMP groups + multicast routes: 1120/1120 1/1
IPv4 unicast directly-connected routes: 3072/3072 8/8
IPv4 unicast indirectly-connected routes: 8144/8144 3148/3148
IPv4 policy based routing aces: 490/490 13/13
IPv4 qos aces: 474/474 21/21
IPv4 security aces: 964/964 42/42
Note: Allocation of TCAM entries per feature uses
a complex algorithm. The above information is meant
to provide an abstract view of the current TCAM utilization
High CPU Utilization Troubleshooting on a Switch
The load on a switch’s CPU is often low, even under high utilization, thanks to the TCAM. Because the TCAM maintains a switch’s forwarding logic at the data plane, the CPU is rarely tasked to forward traffic. The show processes cpu command can be used on a Cisco Catalyst switch to display CPU utilization levels, as demonstrated in Example 3-10.
Example 3-10 show processes cpu Command Output on a Cisco Catalyst Switch
SW1#show processes cpu
CPU utilization for five seconds: 19%/15%; one minute: 20%; five minutes: 13%
PID Runtime(ms) Invoked uSecs 5Sec 1Min 5Min TTY Process
1 0 4 0 0.00% 0.00% 0.00% 0 Chunk Manager
2 0 610 0 0.00% 0.00% 0.00% 0 Load Meter
3 128 5 25600 0.00% 0.00% 0.00% 0 crypto sw pk pro
4 2100 315 6666 0.00% 0.05% 0.05% 0 Check heaps
...OUTPUT OMITTED...
Notice in the output in Example 3-10 that the switch is reporting a 19 percent CPU load, with 15 percent of the CPU load used for interrupt processing.
Although such load utilization values might not be unusual for a router, these values might be of concern for a switch. Specifically, a typical CPU load percentage dedicated to interrupt processing is no more than 5 percent. A value as high as 10 percent is considered acceptable. However, the output given in Example 3-10 shows a 15 percent utilization, which is considered high for a Catalyst switch. Such a level implies that the switch’s CPU is actively involved in forwarding packets that should normally be handled by the switch’s TCAM. Of course, this value might be normal for your organization based on baseline information, even though according to Cisco it is a cause for concern. If the interrupt percent is greater than 10, take time to look into the reason why.
Periodic spikes in processor utilization are also not a major cause for concern if such spikes can be explained. Consider the following reasons that might cause a switch’s CPU utilization to spike:
![]() The CPU is processing routing updates.
The CPU is processing routing updates.
![]() The administrator is issuing a debug command (or other processor-intensive commands).
The administrator is issuing a debug command (or other processor-intensive commands).
![]() Simple Network Management Protocol (SNMP) is being used to poll network devices.
Simple Network Management Protocol (SNMP) is being used to poll network devices.
If you determine that a switch’s high CPU load is primarily the result of interrupts, examine the switch’s packet-switching patterns and check the TCAM utilization. If the high CPU utilization is primarily the result of processes, take the time to investigate those specific processes.
A high CPU utilization on a switch might be a result of STP. Recall that an STP failure could lead to a broadcast storm, where Layer 2 broadcast frames endlessly circulate through a network. Therefore, when troubleshooting a performance issue, realize that a switch’s high CPU utilization might be a symptom of another issue.
Troubleshooting Router Performance Issues
As you have seen, a Cisco Catalyst switch’s performance can be the source of network problems. Similarly, a router performance issue can impact user data flowing through the network.
As an administrator, you might notice a sluggish response to Telnet sessions or SSH sessions that you attempt to establish with a router. Or, you might experience longer-than-normal ping response times from a router. Such symptoms might indicate a router performance issue. In these examples, the router’s CPU is so busy it does not have time to respond to your Telnet session or the pings you have sent.
This section investigates three potential router issues, each of which might result in poor router performance
![]() Excessive CPU utilization
Excessive CPU utilization
![]() The packet-switching mode of a router
The packet-switching mode of a router
![]() Excessive memory utilization
Excessive memory utilization
Excessive CPU Utilization
A router’s processor (that is, CPU) utilization escalating to a high level but only remaining at that high level for a brief time could represent normal behavior. However, if a router’s CPU utilization continually remains at a high level, network performance issues might result. Aside from latency that users and administrators can experience, a router whose CPU is overtaxed might not send routing protocol messages to neighboring routers in a timely fashion. As a result, routing protocol adjacencies can fail, resulting in some networks becoming unreachable.
Processes That Commonly Cause Excessive CPU Utilization
One reason that the CPU of a router might be overloaded is that the router is running a process that is taking up an unusually high percentage of its CPU resources. Following are four such processes that can result in excessive CPU utilization:
![]() ARP Input process: The ARP Input process is in charge of sending Address Resolution Protocol (ARP) requests. This process can consume an inordinate percentage of CPU resources if the router has to send numerous ARP requests. One configuration that can cause such a high number of ARP requests is having a default route configured that points to an Ethernet interface. For example, perhaps a router had the ip route 0.0.0.0 0.0.0.0 fastethernet 0/1 command entered in global configuration mode so that all packets with no explicit route in the routing table will be forwarded out Fa0/1. At first, this appears harmless; however, such a configuration should be avoided because an ARP Request has to be sent for every destination IP address in every packet that is received by the router and forwarded out Fa0/1. This is because the ip routecommand is stating that all IP addresses (0.0.0.0 0.0.0.0) are reachable through the directly connected interface fastethernet 0/1. Therefore, instead of ARPing for the MAC address of a next-hop IP address, you ARP for the MAC address of the destination IP address in each packet. That will result in an excessive number of ARP requests, which will cause strain on the CPU. In addition, many of the ARP requests will go unanswered and result in dropped packets. The better option is to specify the next-hop IP address because the router will only have to ARP for the MAC of the next-hop IP address when forwarding the packets out Fa0/1.
ARP Input process: The ARP Input process is in charge of sending Address Resolution Protocol (ARP) requests. This process can consume an inordinate percentage of CPU resources if the router has to send numerous ARP requests. One configuration that can cause such a high number of ARP requests is having a default route configured that points to an Ethernet interface. For example, perhaps a router had the ip route 0.0.0.0 0.0.0.0 fastethernet 0/1 command entered in global configuration mode so that all packets with no explicit route in the routing table will be forwarded out Fa0/1. At first, this appears harmless; however, such a configuration should be avoided because an ARP Request has to be sent for every destination IP address in every packet that is received by the router and forwarded out Fa0/1. This is because the ip routecommand is stating that all IP addresses (0.0.0.0 0.0.0.0) are reachable through the directly connected interface fastethernet 0/1. Therefore, instead of ARPing for the MAC address of a next-hop IP address, you ARP for the MAC address of the destination IP address in each packet. That will result in an excessive number of ARP requests, which will cause strain on the CPU. In addition, many of the ARP requests will go unanswered and result in dropped packets. The better option is to specify the next-hop IP address because the router will only have to ARP for the MAC of the next-hop IP address when forwarding the packets out Fa0/1.
![]() Net Background process: An interface has a certain number of buffers available to store packets. These buffers are sometimes referred to as the queue of an interface. If an interface needs to store a packet in a buffer but all interface buffers are in use, the interface can pull from a main pool of buffers that the router maintains. The process that allows an interface to allocate one of these globally available buffers is Net Background. If the throttles, ignored, and overrun parameters are incrementing on an interface, the underlying cause might be the Net Background process consuming too many CPU resources.
Net Background process: An interface has a certain number of buffers available to store packets. These buffers are sometimes referred to as the queue of an interface. If an interface needs to store a packet in a buffer but all interface buffers are in use, the interface can pull from a main pool of buffers that the router maintains. The process that allows an interface to allocate one of these globally available buffers is Net Background. If the throttles, ignored, and overrun parameters are incrementing on an interface, the underlying cause might be the Net Background process consuming too many CPU resources.
![]() IP Background process: The IP Background process handles an interface changing its state. A state change might be an interface going from an Up state to a Down state, or vice versa. Another example of state change is an interface’s IP address changing. Therefore, anything that can cause repeated state changes, such as bad cabling, might result in the IP Background process consuming a high percentage of CPU resources.
IP Background process: The IP Background process handles an interface changing its state. A state change might be an interface going from an Up state to a Down state, or vice versa. Another example of state change is an interface’s IP address changing. Therefore, anything that can cause repeated state changes, such as bad cabling, might result in the IP Background process consuming a high percentage of CPU resources.
![]() TCP Timer process: The TCP Timer process runs for each TCP router connection. Therefore, many connections can result in high CPU utilization by the TCP Timer process, whether they are established or embryonic. An established TCP connection is one that has successfully completed the three-way handshake. An embryonic connection occurs when the TCP three-way handshake is only two-thirds completed. For example, the client sends the SYN packet to the server, and then the server sends a SYN/ACK back. At this point, the server is in the embryonic state (waiting for an ACK from the client to complete the three-way handshake and establish the connection). However, if the client does not send the ACK back, the server will sit in the embryonic state until it times out. This could be due to connectivity issues or malicious intent.
TCP Timer process: The TCP Timer process runs for each TCP router connection. Therefore, many connections can result in high CPU utilization by the TCP Timer process, whether they are established or embryonic. An established TCP connection is one that has successfully completed the three-way handshake. An embryonic connection occurs when the TCP three-way handshake is only two-thirds completed. For example, the client sends the SYN packet to the server, and then the server sends a SYN/ACK back. At this point, the server is in the embryonic state (waiting for an ACK from the client to complete the three-way handshake and establish the connection). However, if the client does not send the ACK back, the server will sit in the embryonic state until it times out. This could be due to connectivity issues or malicious intent.
Cisco IOS Commands Used for Troubleshooting High Processor Utilization
Table 3-3 offers a collection of show commands that can be valuable when troubleshooting high CPU utilization on a router.
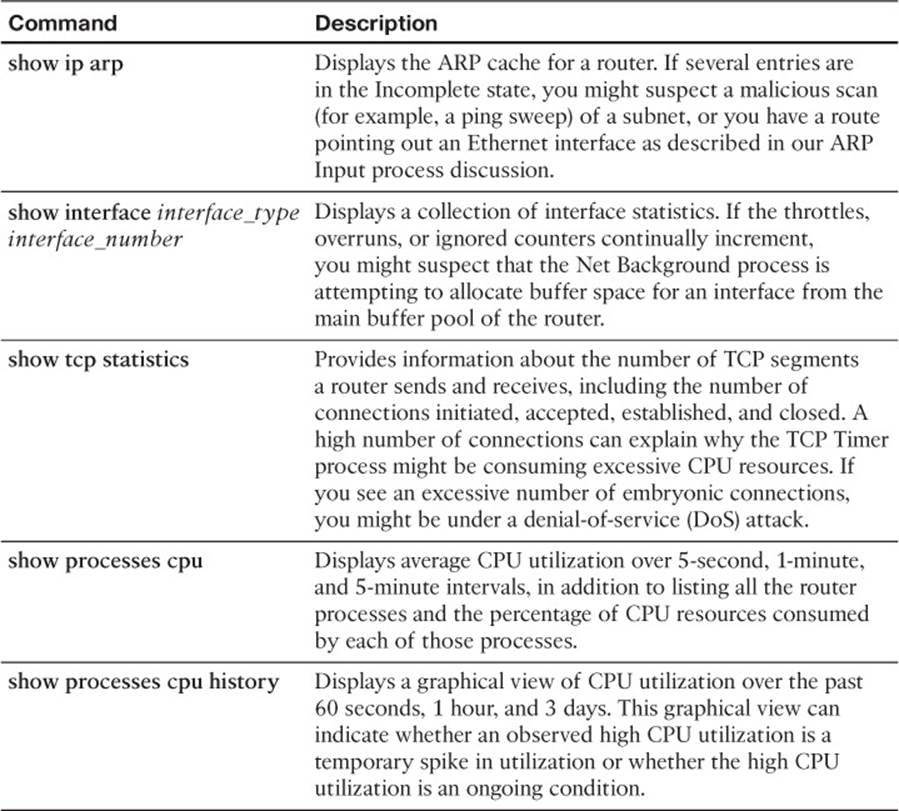
Table 3-3 Commands for Troubleshooting High CPU Utilization
Example 3-11 shows sample output from the show ip arp command. In the output, only a single instance exists of an Incomplete ARP entry. However, a high number of such entries can suggest the scanning of network resources, which might indicate malicious reconnaissance traffic or that you have a route pointing out an Ethernet interface instead of to a next-hop IP address.
Example 3-11 show ip arp Command Output
R2#show ip arp
Protocol Address Age (min) Hardware Addr Type Interface
Internet 10.3.3.2 61 0009.b7fa.d1e0 ARPA Ethernet0/0
Internet 10.3.3.1 - 00d0.06fe.9ea0 ARPA Ethernet0/0
Internet 192.168.1.50 0 Incomplete ARPA
Example 3-12 shows sample output from the show interface interface_type interface_number command. Note the throttles, overrun, and ignored counters. If these counters continue to increment, the Net Background process might be consuming excessive CPU resources while it allocates buffers from the main buffer pool of the router.
Example 3-12 show interface interface_type interface_number Command Output
R2#show interface ethernet 0/0
Ethernet0/0 is up, line protocol is up
Hardware is AmdP2, address is 00d0.06fe.9ea0 (bia 00d0.06fe.9ea0)
Internet address is 10.3.3.1/24
MTU 1500 bytes, BW 10000 Kbit, DLY 1000 usec,
reliability 255/255, txload 1/255, rxload 1/255
Encapsulation ARPA, loopback not set
Keepalive set (10 sec)
ARP type: ARPA, ARP Timeout 04:00:00
Last input 00:00:02, output 00:00:02, output hang never
Last clearing of "show interface" counters never
Input queue: 0/75/0/0 (size/max/drops/flushes); Total output drops: 0
Queueing strategy: fifo
Output queue: 0/40 (size/max)
5 minute input rate 0 bits/sec, 1 packets/sec
5 minute output rate 0 bits/sec, 0 packets/sec
2156 packets input, 164787 bytes, 0 no buffer
Received 861 broadcasts, 0 runts, 0 giants, 0 throttles
0 input errors, 0 CRC, 0 frame, 0 overrun, 0 ignored
0 input packets with dribble condition detected
2155 packets output, 212080 bytes, 0 underruns
0 output errors, 0 collisions, 7 interface resets
0 babbles, 0 late collision, 0 deferred
0 lost carrier, 0 no carrier
0 output buffer failures, 0 output buffers swapped out
Example 3-13 shows sample output from the show tcp statistics command. If the output indicates numerous connections, the TCP Timer process might be consuming excessive CPU resources while simultaneously maintaining all those connections. If you have a high number of initiated connections with a low number of established connections, it indicates that the three-way handshake is not being completed. This might be due to a DoS attack that is attempting to consume all the TCP connection slots.
Example 3-13 show tcp statistics Command Output
R2#show tcp statistics
Rcvd: 689 Total, 0 no port
0 checksum error, 0 bad offset, 0 too short
474 packets (681 bytes) in sequence
0 dup packets (0 bytes)
0 partially dup packets (0 bytes)
0 out-of-order packets (0 bytes)
0 packets (0 bytes) with data after window
0 packets after close
0 window probe packets, 0 window update packets
1 dup ack packets, 0 ack packets with unsend data
479 ack packets (14205 bytes)
Sent: 570 Total, 0 urgent packets
1 control packets (including 0 retransmitted)
562 data packets (14206 bytes)
0 data packets (0 bytes) retransmitted
0 data packets (0 bytes) fastretransmitted
7 ack only packets (7 delayed)
0 window probe packets, 0 window update packets
0 Connections initiated, 1 connections accepted, 1 connections established
0 Connections closed (including 0 dropped, 0 embryonic dropped)
0 Total rxmt timeout, 0 connections dropped in rxmt timeout
0 Keepalive timeout, 0 keepalive probe, 0 Connections dropped in keepalive
Example 3-14 shows sample output from the show processes cpu command. The output in this example indicates a 34 percent CPU utilization in the past 5 seconds, with 13 percent of CPU resources being spent on interrupts. The output also shows the 1-minute CPU utilization average as 36 percent and the 5-minute average as 32 percent. Individual processes running on the router are also shown, along with their CPU utilization levels. Note the ARP Input, Net Background, TCP Timer, and IP Background processes referred to in this section.
Example 3-14 show processes cpu Command Output
R2#show processes cpu
CPU utilization for five seconds: 34%/13%; one minute: 36%; five minutes: 32%
PID Runtime(ms) Invoked uSecs 5Sec 1Min 5Min TTY Process
...OUTPUT OMITTED...
12 4 69 57 0.00% 0.00% 0.00% 0 ARP Input
13 0 1 0 0.00% 0.00% 0.00% 0 HC Counter Timer
14 0 5 0 0.00% 0.00% 0.00% 0 DDR Timers
15 12 2 6000 0.00% 0.00% 0.00% 0 Entity MIB API
16 4 2 2000 0.00% 0.00% 0.00% 0 ATM Idle Timer
17 0 1 0 0.00% 0.00% 0.00% 0 SERIAL A'detect
18 0 3892 0 0.00% 0.00% 0.00% 0 GraphIt
19 0 2 0 0.00% 0.00% 0.00% 0 Dialer event
20 0 1 0 0.00% 0.00% 0.00% 0 Critical Bkgnd
21 132 418 315 0.00% 0.00% 0.00% 0 Net Background
22 0 15 0 0.00% 0.00% 0.00% 0 Logger
...OUTPUT OMITTED...
46 0 521 0 0.00% 0.00% 0.00% 0 SSS Test Client
47 84 711 118 0.00% 0.00% 0.00% 0 TCP Timer
48 4 3 1333 0.00% 0.00% 0.00% 0 TCP Protocols
49 0 1 0 0.00% 0.00% 0.00% 0 Socket Timers
50 0 15 0 0.00% 0.00% 0.00% 0 HTTP CORE
51 12 5 2400 0.00% 0.00% 0.00% 0 PPP IP Route
52 4 5 800 0.00% 0.00% 0.00% 0 PPP IPCP
53 273 157 1738 0.00% 0.00% 0.00% 0 IP Background
54 0 74 0 0.00% 0.00% 0.00% 0 IP RIB Update
...OUTPUT OMITTED...
Example 3-15 shows sample output from the show processes cpu history command. The graphical output produced by this command is useful in determining whether a CPU spike is temporary or whether it is an ongoing condition.
Example 3-15 show processes cpu history Command Output
R2#show processes cpu history
4 11111 4444411111 11111
944444555554444444444777775555588888888887777755555777775555
100
90
80
70
60
50 * *****
40 * *****
30 * *****
20 * ***** ********** *****
10 * ***** *************************************
0....5....1....1....2....2....3....3....4....4....5....5....6
0 5 0 5 0 5 0 5 0 5 0
CPU% per second (last 60 seconds)
611111111112111221131111111111111121111111111111211111111111
376577846281637117756665771573767217674374737664008927775277
100
90
80
70
60 *
50 *
40 * *
30 * *
20 ******* * *** ************ ** *** **** * * *** * ** ****
10 ##########################################################
0....5....1....1....2....2....3....3....4....4....5....5....6
0 5 0 5 0 5 0 5 0 5 0
CPU% per minute (last 60 minutes)
* = maximum CPU% # = average CPU%
56434334644444334443442544453443
46868692519180723579483247519306
100
90
80
70 * *
60 * *
50 *** * * * * ** * * ***
40 *************** ****** *********
30 ********************** *********
20 ********************************
10 ################################
0....5....1....1....2....2....3....3....4....4....5....5....6....6....7..
0 5 0 5 0 5 0 5 0 5 0 5 0
CPU% per hour (last 72 hours)
* = maximum CPU% # = average CPU%
Understanding Packet-Switching Modes (Routers and Multilayer Switches)
In addition to the high CPU utilization issues previously discussed, a router’s packet-switching mode can impact router performance. Before discussing the most common switching modes, realize that the way a router handles packets (or is capable of handling packets) largely depends on the router’s architecture. Therefore, for real-world troubleshooting, consult the documentation for your router to determine how it implements packet switching.
In general, however, Cisco routers and multilayer switches support the following three primary modes of packet switching:
![]() Process switching
Process switching
![]() Fast switching (route caching)
Fast switching (route caching)
![]() Cisco Express Forwarding (topology-based switching)
Cisco Express Forwarding (topology-based switching)
Packet switching involves the router making a decision about how a packet should be forwarded and then forwarding that packet out of the appropriate router interface.
Operation of Process Switching
When a router routes a packet (that is, performs packet switching), the router removes the packet’s Layer 2 header, examines the Layer 3 addressing, and decides how to forward the packet. The Layer 2 header is then rewritten (which involves changing the source and destination MAC addresses and computing a new FCS), and then the packet is forwarded out of the appropriate interface. With process switching, as illustrated in Figure 3-4, the router’s CPU becomes directly involved with packet-switching decisions. As a result, the performance of a router configured for process switching can suffer significantly.
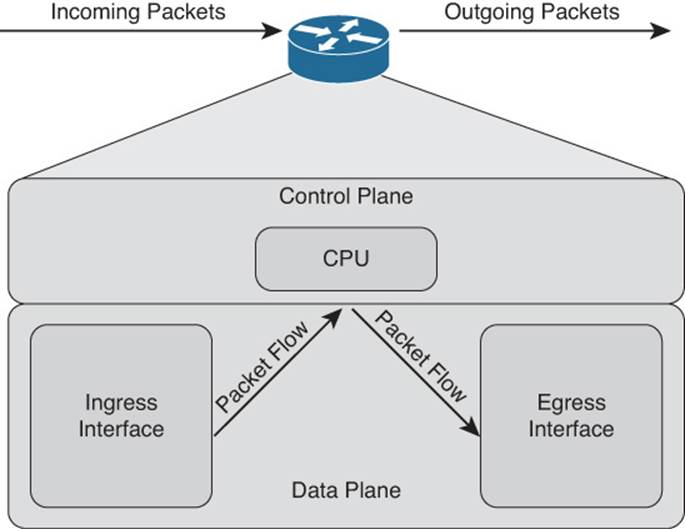
Figure 3-4 Data Flow with Process Switching
An interface can be configured for process switching by disabling fast switching and CEF on that interface. The interface configuration mode command used to disable fast switching and CEF at the same time is no ip route-cache.
Operation of Fast Switching (Route Caching)
Fast switching uses a fast cache maintained in a router’s data plane. The fast cache contains information about how traffic from different data flows should be forwarded. As shown in Figure 3-5, the first packet in a data flow is process-switched by a router’s CPU. After the router determines how to forward the first packet of a data flow, that forwarding information is stored in the fast cache. Subsequent packets in that same data flow are forwarded based on information in the fast cache, as opposed to being process-switched. As a result, fast switching reduces a router’s CPU utilization when compared to process switching.
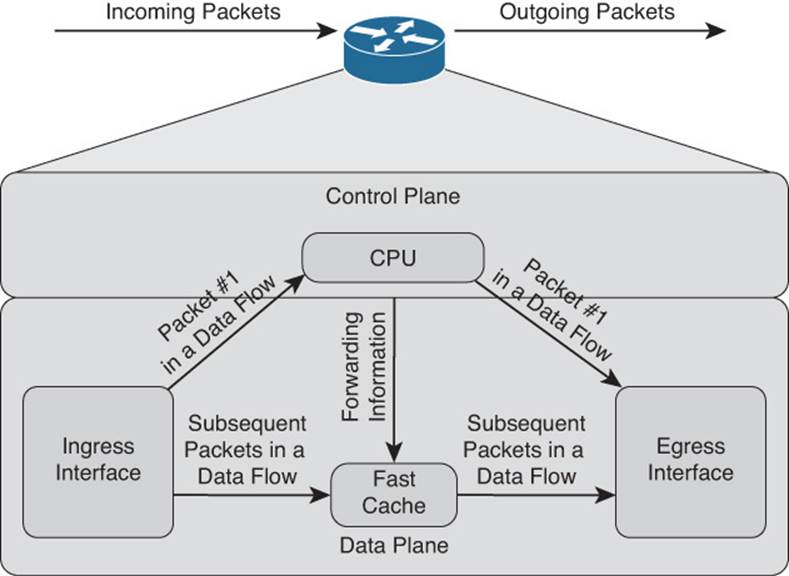
Figure 3-5 Data Flow with Fast Switching
You can enable fast switching by turning off CEF in interface configuration mode with the no ip route-cache cef command.
Operation of Cisco Express Forwarding (Topology-Based Switching)
Cisco Express Forwarding (CEF) maintains two tables in the data plane. Specifically, the Forwarding Information Base (FIB) maintains Layer 3 forwarding information, whereas the Adjacency Table maintains Layer 2 information for next hops listed in the FIB.
Using these tables, populated from a router’s IP routing table and ARP cache, CEF can efficiently make forwarding decisions. Unlike fast switching, CEF does not require the first packet of a data flow to be process-switched. Rather, an entire data flow can be forwarded at the data plane, as shown in Figure 3-6.
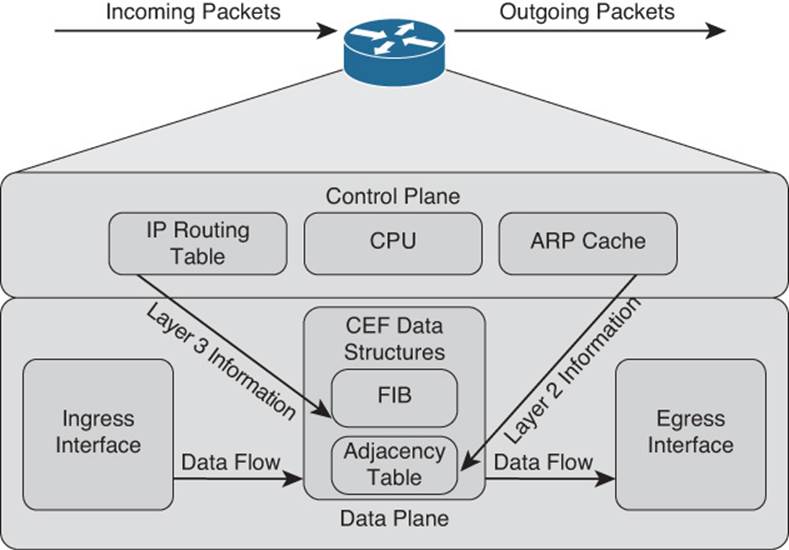
Figure 3-6 Data Flow with Cisco Express Forwarding
On many router platforms, CEF is enabled by default. If it is not, you can globally enable it with the ip cef command. Alternatively, you can enable CEF for a specific interface with the interface configuration mode command ip route-cache cef.
Date Night Example of Process-Switching Modes
Let’s pretend that my wife and I are going out to dinner and we are leaving our two children with a babysitter. If we are “Process Switching” with the babysitter, every time our children ask the babysitter for a cookie, she has to call us to ask for permission to give the children a cookie. If the children ask ten times, she has to call us ten times. If we are “Fast Switching” with the babysitter, the first time she calls us, we say yes and then create a “route cache” for the babysitter that states, “if the kids want more, just give them more without calling us.” Finally, if we are using “CEF” with the babysitter, before we leave for dinner, we take out the cookie jar, place it on the counter, and tell her to have an awesome evening with the kids. As you can see from this example, date night is better when we use CEF.
Troubleshooting Packet-Switching Modes
Table 3-4 provides a selection of commands that you can use when troubleshooting the packet-switching modes of a router.
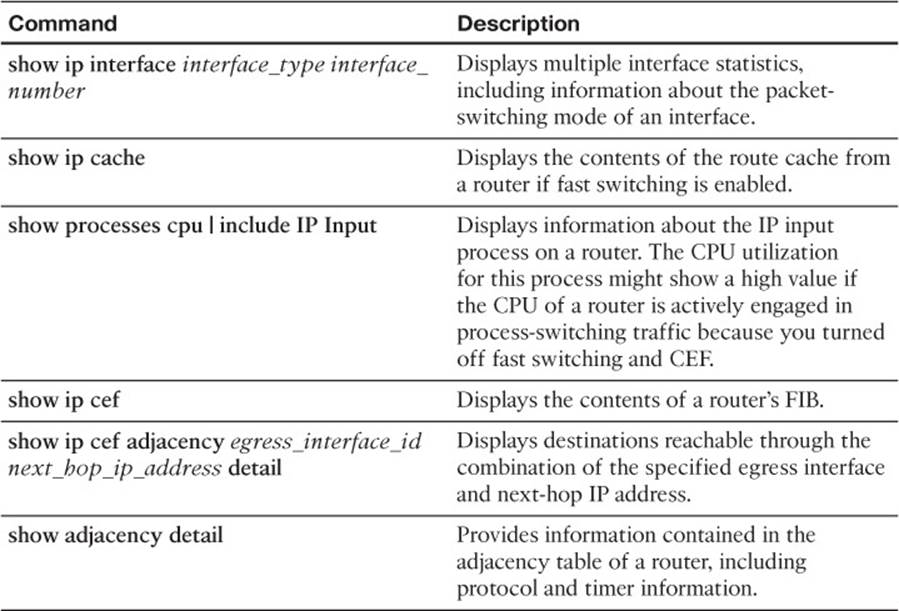
Table 3-4 Commands for Troubleshooting a Router’s Packet-Switching Modes
Example 3-16 shows sample output from the show ip interface interface_type interface_number command. The output indicates that fast switching and CEF switching are enabled on interface Fast Ethernet 0/0. The reference to flow switching being disabled refers to the Cisco IOS NetFlow feature, which you can use to collect traffic statistics.
Example 3-16 show ip interface interface_type interface_number Command Output
R4#show ip interface fastethernet 0/0
FastEthernet0/0 is up, line protocol is up
...OUTPUT OMITTED...
ICMP mask replies are never sent
IP fast switching is enabled
IP fast switching on the same interface is disabled
IP Flow switching is disabled
IP CEF switching is enabled
IP CEF Fast switching turbo vector
IP multicast fast switching is enabled
IP multicast distributed fast switching is disabled
IP route-cache flags are Fast, CEF
...OUTPUT OMITTED...
Example 3-17 shows sample output from the show ip cache command. If fast switching is enabled and CEF is disabled, a router begins to populate its route cache. This command shows the contents of a router’s route cache.
Example 3-17 show ip cache Command Output
R4#show ip cache
IP routing cache 3 entries, 588 bytes
12 adds, 9 invalidates, 0 refcounts
Minimum invalidation interval 2 seconds, maximum interval 5 seconds,
quiet interval 3 seconds, threshold 0 requests
Invalidation rate 0 in last second, 0 in last 3 seconds
Last full cache invalidation occurred 04:13:57 ago
Prefix/Length Age Interface Next Hop
10.8.8.4/32 00:00:07 FastEthernet0/1 10.8.8.4
10.8.8.6/32 00:00:10 FastEthernet0/1 10.8.8.6
192.168.0.0/24 00:00:10 FastEthernet0/0 10.3.3.1
Example 3-18 shows sample output from the show processes cpu | include IP Input command. In the output, the IP input process was using only 0.08 percent of its router’s CPU capacity during the last 5-second interval. However, a high percentage value might indicate that a router was performing process switching, where the CPU was directly involved in packet switching.
Example 3-18 show processes cpu | include IP Input Command Output
R4#show processes cpu | include IP Input
63 3178 7320 434 0.08% 0.06% 0.04% 0 IP Input
Example 3-19 shows sample output from the show ip cef command. The output contains the contents of the FIB for a router. Notice that the prefix is listed, followed by the next hop that will be used to reach the prefix, and then the interface that will be used to reach it. Note that if a next hop of the network prefix is set to receive, that network/IP is local to the router, and any packets destined to that specific IP will be processed by the CPU of the router. Examining the output closely, you will see that the receive entries are subnet IDs, local host IP addresses, and broadcast addresses, ensuring that they are processed by the router and not forwarded. The attached next hop indicates that the network is a directly connected route on the router.
Example 3-19 show ip cef Command Output
R4#show ip cef
Prefix Next Hop Interface
0.0.0.0/0 drop Null0 (default route handler entry)
0.0.0.0/32 receive
10.1.1.0/24 10.3.3.1 FastEthernet0/0
10.1.1.2/32 10.3.3.1 FastEthernet0/0
10.3.3.0/24 attached FastEthernet0/0
10.3.3.0/32 receive
10.3.3.1/32 10.3.3.1 FastEthernet0/0
10.3.3.2/32 receive
10.3.3.255/32 receive
10.4.4.0/24 10.3.3.1 FastEthernet0/0
10.5.5.0/24 10.3.3.1 FastEthernet0/0
10.7.7.0/24 10.3.3.1 FastEthernet0/0
10.7.7.2/32 10.3.3.1 FastEthernet0/0
10.8.8.0/24 attached FastEthernet0/1
10.8.8.0/32 receive
10.8.8.1/32 receive
10.8.8.4/32 10.8.8.4 FastEthernet0/1
10.8.8.5/32 10.8.8.5 FastEthernet0/1
10.8.8.6/32 10.8.8.6 FastEthernet0/1
10.8.8.7/32 10.8.8.7 FastEthernet0/1
10.8.8.255/32 receive
192.168.0.0/24 10.3.3.1 FastEthernet0/0
224.0.0.0/4 drop
224.0.0.0/24 receive
255.255.255.255/32 receive
Example 3-20 shows sample output from the show ip cef adjacency egress_interface_id next_hop_ip_address detail command. This command shows the IP addresses that the router knows how to reach using the specified combination of next-hop IP address and egress interface. In this example, 10.8.8.6 is the IP address of a host and not a router. Therefore, no other IP addresses are known to have a next-hop IP address of 10.8.8.6 with an egress interface of Fast Ethernet 0/1.
Example 3-20 show ip cef adjacency egress-interface-id next-hop-IP-address detail Command Output
R4#show ip cef adjacency fa 0/1 10.8.8.6 detail
IP CEF with switching (Table Version 25), flags=0x0
25 routes, 0 reresolve, 0 unresolved (0 old, 0 new), peak 0
25 leaves, 21 nodes, 25640 bytes, 90 inserts, 65 invalidations
0 load sharing elements, 0 bytes, 0 references
universal per-destination load sharing algorithm, id 24360DB1
5(2) CEF resets, 1 revisions of existing leaves
Resolution Timer: Exponential (currently 1s, peak 1s)
0 in-place/0 aborted modifications
refcounts: 5702 leaf, 5632 node
Table epoch: 0 (25 entries at this epoch)
Adjacency Table has 5 adjacencies
10.8.8.6/32, version 10, epoch 0, cached adjacency 10.8.8.6
0 packets, 0 bytes
via 10.8.8.6, FastEthernet0/1, 0 dependencies
next hop 10.8.8.6, FastEthernet0/1
valid cached adjacency
Example 3-21 shows sample output from the show adjacency detail command. When you see a particular adjacency listed in the FIB, you can issue this command to confirm that the router has information about how to reach that adjacency. In this case, if we need to send a packet to 10.3.3.1, we will send the packet out Fast Ethernet 0/0, which requires a Layer 2 frame with a source and destination MAC address. These MAC addresses are already listed in the adjacency table. The value 00D006FE9EA00009B7FAD1E00800 can be broken into three parts:
![]() 00D006FE9EA0 = Destination MAC address
00D006FE9EA0 = Destination MAC address
![]() 0009B7FAD1E0 = Source MAC address
0009B7FAD1E0 = Source MAC address
![]() 0800 = Well-know Ethertype value for IP
0800 = Well-know Ethertype value for IP
Example 3-21 show adjacency detail Command Output
R4#show adjacency detail
Protocol Interface Address
IP FastEthernet0/0 10.3.3.1(19)
32 packets, 1920 bytes
00D006FE9EA00009B7FAD1E00800
ARP 03:53:01
Epoch: 0
IP FastEthernet0/1 10.8.8.6(5)
4 packets, 264 bytes
0008A3B895C40009B7FAD1E10800
ARP 03:53:35
Epoch: 0
...OUTPUT OMITTED...
Now that you have reviewed the different packet-switching options for a router, you can better analyze how a router is forwarding specific traffic. Following is a list of troubleshooting steps that you can follow if you suspect that network traffic is being impacted by a performance problem on one of the routers along the path from the source to the destination:
Step 1. Use the traceroute command to determine which router along the path is causing excessive delay.
Step 2. After you identify a router that is causing unusually high delay, use the show processes cpu command to see the CPU utilization of that router and identify any processes that might be consuming an unusually high percentage of the CPU.
Step 3. Use the show ip route ip_address command to verify that the router has a route to the destination IP address.
Step 4. Use the show ip cef command to determine whether all the router interfaces are configured to use CEF.
Step 5. Use the show ip cef ip_address 255.255.255.255 command to verify that CEF has an entry in its FIB that can reach the specified IP address. Part of the output from this command will be the next-hop adjacency to which traffic should be forwarded, along with the egress interface used to send traffic to that next hop.
Step 6. Issue the show adjacency interface_type interface_number detail command to verify that CEF has an entry in its adjacency table for the egress interface identified in Step 5.
Step 7. With the show ip arp command, you can then confirm that the router knows the MAC address associated with the next-hop IP address shown in the output from Step 6.
Step 8. You can then connect to the next-hop device and verify that the MAC address identified in Step 7 is indeed correct.
You can repeat these steps on the next-hop device or on another router whose response time displayed in the output from Step 1 is suspect.
Excessive Memory Utilization
Much like a PC, router performance can suffer if it lacks sufficient available memory. For example, perhaps you install a version of Cisco IOS on a router, and that router does not have the minimum amount of memory required to support that specific Cisco IOS image. Even though the router might load the image and function, its performance might be sluggish. Assuming that a router does have the recommended amount of memory for its installed Cisco IOS image, consider the following as potential memory utilization issues.
Memory Leak
When a router starts a process, that process can allocate a block of memory. When the process completes, the process should return its allocated memory to the router’s pool of memory. If not all allocated memory is returned to the router’s main memory pool, a memory leak occurs. Such a condition usually results from a bug in the Cisco IOS version running on the router, requiring an upgrade of the router’s Cisco IOS image.
Example 3-22 shows sample output from the show memory allocating-process totals command. This command can help identify memory leaks. The output shows information about memory availability on a router after the Cisco IOS image of the router has been decompressed and loaded, and the total amount of memory that is being used by the various processes.
Example 3-22 show memory allocating-process totals Command Output
R4#show memory allocating-process totals
Head Total(b) Used(b) Free(b) Lowest(b) Largest(b)
Processor 83D27480 67463064 15347168 52115896 50311080 50127020
I/O 7C21800 4057088 2383016 1674072 1674072 1674044
Allocator PC Summary for: Processor
PC Total Count Name
0x809D7A30 1749360 180 Process Stack
0x80A7F664 918024 10 Init
0x81CEF6A0 882576 4 pak subblock chunk
0x81C04D9C 595344 54 TCL Chunks
0x800902A4 490328 6 MallocLite
...OUTPUT OMITTED...
The Head column in the output refers to the address (in hexadecimal) of the memory allocation chain. The Total column is the total amount of memory available in bytes. The Used column indicates how much has been used, and Free indicates how much is remaining. The Lowest column shows the lowest amount of free memory (in bytes) that has been available since the router last booted. The Largest column indicates the largest block of available memory. Following this summary information, the output shows detailed memory allocation information for each process running on a router. If a process is consuming a larger-than-normal amount of memory, it is likely because of a memory leak. A memory leak occurs when a process does not free the memory that it is finished using. Therefore, the block of memory remains reserved and will be released only when the router is reloaded. Typically, memory leaks result from bugs or poor coding in the Cisco IOS Software. The best solution is to upgrade the Cisco IOS Software to a version that fixes the issue.
Memory-Allocation Failure
A memory-allocation failure (which produces a MALLOCFAIL error message) occurs when a process attempts to allocate a block of memory and fails to do so. One common cause for a MALLOCFAIL error is a security issue. For example, a virus or a worm that has infested the network can result in a MALLOCFAIL error. Alternatively, a MALLOCFAIL error might result from a bug in the router’s version of Cisco IOS. You can use the Cisco Bug Toolkit (available from www.cisco.com/cgi-bin/Support/Bugtool/launch_bugtool.pl) to research any such known issues with the version of Cisco IOS running on a router. Personally, I have witnessed the MALLOCFAIL error message when using an Integrated Services Router (ISR) that was running Network Address Translation (NAT), and another instance when I tried to load the complete Intrusion Prevention System (IPS) Signature Definition File on another ISR when I knew it could not handle it.
Buffer Leak
Similar to a memory leak, in which a process does not return all of its allocated memory to the router upon terminating, a buffer leak occurs when a process does not return a buffer to the router when the process has finished using the buffer. Consider the output of the show interfacescommand shown in Example 3-23.
Example 3-23 Identifying a Wedged Interface
R4#show interfaces
...OUTPUT OMITTED...
Input queue: 76/75/780/0 (size/max/drops/flushes); Total output drops: 0
Queueing strategy: fifo
Output queue: 0/40 (size/max)
...OUTPUT OMITTED...
Notice the numbers 76 and 75 highlighted in the output. These values indicate that an input queue of the interface has a capacity of 75 packets and that the queue currently has 76 packets. These values indicate an oversubscription of the queue space. An interface in this condition is called awedged interface. In such a condition, the router does not forward traffic coming into the wedged interface.
The show buffers command can also help to diagnose a buffer leak. To illustrate, consider the output of the show buffers command shown in Example 3-24.
Example 3-24 show buffers Command Output
R4#show buffers
Buffer elements:
1118 in free list (500 max allowed)
570 hits, 0 misses, 1119 created
Public buffer pools:
Small buffers, 104 bytes (total 71, permanent 50, peak 71 @ 00:21:43):
53 in free list (20 min, 150 max allowed)
317 hits, 7 misses, 0 trims, 21 created
0 failures (0 no memory)
Middle buffers, 600 bytes (total 49, permanent 25, peak 49 @ 00:21:43):
5 in free list (10 min, 150 max allowed)
122 hits, 8 misses, 0 trims, 24 created
...OUTPUT OMITTED...
This output indicates that the router has 49 middle buffers, but only 5 of those 49 buffers are available. Such a result might indicate a process allocating buffers but failing to deallocate them. Like a memory leak, a buffer leak might require updating the Cisco IOS image of a router.
Excessive BGP Memory Use
If a router is running Border Gateway Protocol (BGP), be aware that BGP runs multiple processes and can consume significant amounts of router memory. The show processes memory | include BGP command, as shown in Example 3-25, can show you how much memory the various BGP processes of a router are consuming. If BGP is consuming a large percentage of your router memory, you might consider filtering out unneeded BGP routes, upgrading the memory on that router, or running BGP on a different platform that has more memory.
Example 3-25 show processes memory | include BGP Command Output
R1#show processes memory | include BGP|^ PID
PID TTY Allocated Freed Holding Getbufs Retbufs Process
184 0 0 0 7096 0 0 BGP Task
198 0 0 0 10096 0 0 BGP Scheduler
229 0 38808 0 11520 0 0 BGP Router
231 0 0 0 10096 0 0 BGP I/O
262 0 0 0 10096 0 0 BGP Scanner
284 0 0 0 7096 0 0 BGP Event
Depending on the router platform, your router might have multiple line cards with different amounts of memory available on each line card. The show diag command can help you isolate a specific line card that is running low on memory, perhaps because that line card is running BGP.
Exam Preparation Tasks
As mentioned in the section “How to Use This Book” in the Introduction, you have several choices for exam preparation: the exercises here; Chapter 22, “Final Preparation;” and the exam simulation questions on the CD-ROM.
Review All Key Topics
Review the most important topics in this chapter, noted with the Key Topic icon in the outer margin of the page. Table 3-5 lists a reference of these key topics and the page numbers on which each is found.
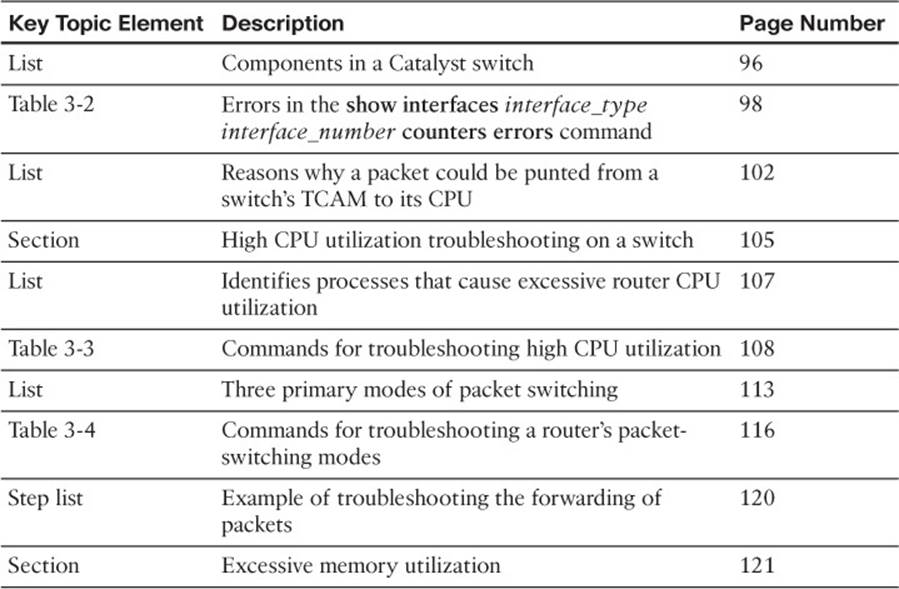
Table 3-5 Key Topics for Chapter 3
Define Key Terms
Define the following key terms from this chapter and check your answers in the glossary:
backplane
control plane
forwarding logic
ingress port
egress port
half-duplex
full-duplex
TCAM
ARP Input process
Net Background process
IP Background process
TCP Timer process
process switching
fast switching
CEF
memory leak
memory-allocation failure
buffer leak
Complete Tables and Lists from Memory
Print a copy of Appendix C, “Memory Tables,” (found on the disc), or at least the section for this chapter, and complete the tables and lists from memory. Appendix D, “Memory Tables Answer Key,” also on the disc, includes completed tables and lists to check your work.
Command Reference to Check Your Memory
This section includes the most important EXEC commands covered in this chapter. It might not be necessary to memorize the complete syntax of every command, but you should be able to remember the basic keywords that are needed.
To test your memory of the commands, cover the right side of Table 3-6 with a piece of paper, read the description on the left side, and then see how much of the command you can remember.
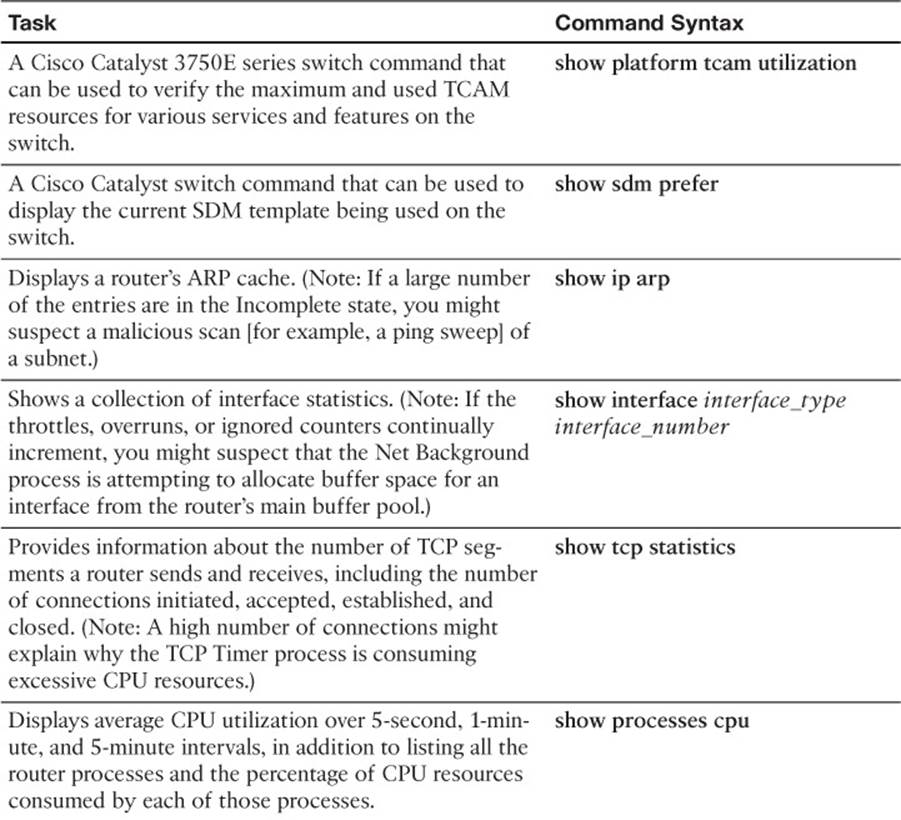
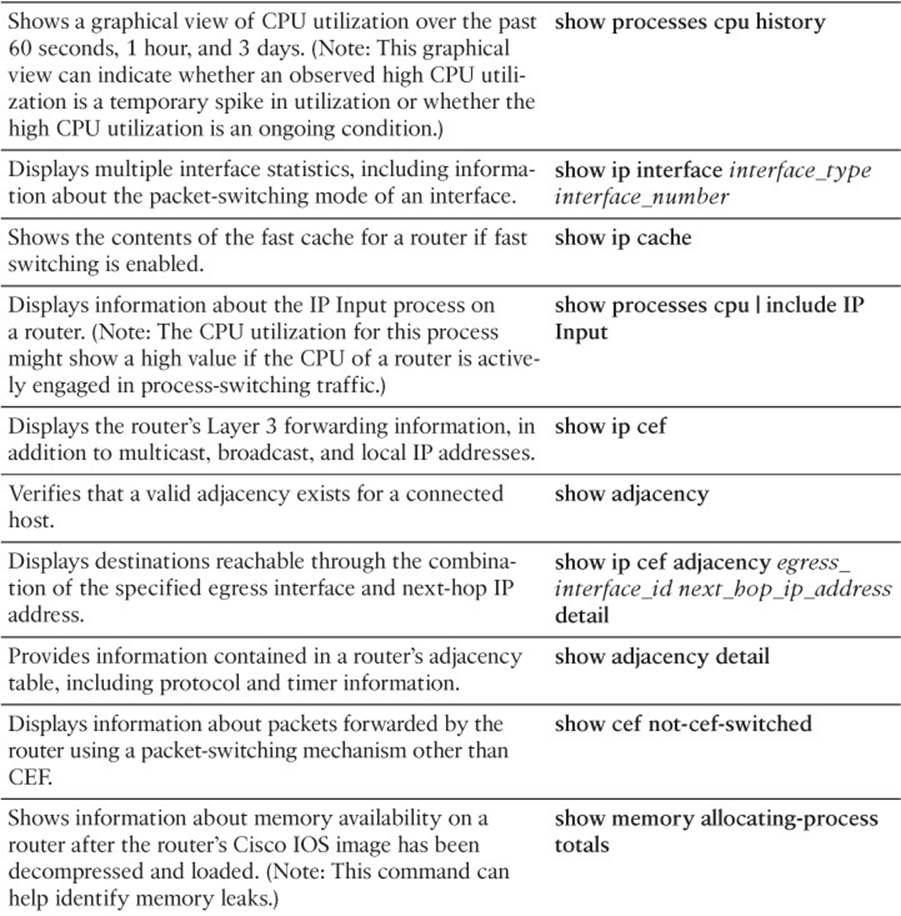
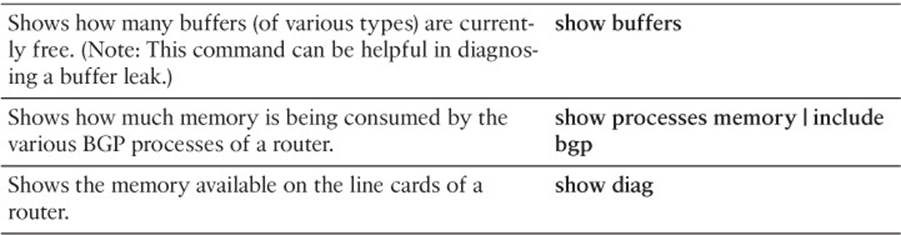
Table 3-6 EXEC Commands
The 300-135 TSHOOT exam focuses on practical, hands-on skills that are used by a networking professional. Therefore, you should be able to identify the commands needed to verify router and switch configurations.
All materials on the site are licensed Creative Commons Attribution-Sharealike 3.0 Unported CC BY-SA 3.0 & GNU Free Documentation License (GFDL)
If you are the copyright holder of any material contained on our site and intend to remove it, please contact our site administrator for approval.
© 2016-2026 All site design rights belong to S.Y.A.