Professional Microsoft SQL Server 2014 Integration Services (Wrox Programmer to Programmer), 1st Edition (2014)
Chapter 10. Advanced Data Cleansing in SSIS
WHAT’S IN THIS CHAPTER?
· Using the Derived Column Transformation for advanced data cleansing
· Applying the Fuzzy Lookup and Fuzzy Grouping transformations and understanding how they work
· Introducing Data Quality Services
· Introducing Master Data Services
WROX.COM CODE DOWNLOADS FOR THIS CHAPTER
You can find the wrox.com code downloads for this chapter at http://www.wrox.com/go/prossis2014 on the Download Code tab.
In this chapter, you will learn the ins and outs of data cleansing in SSIS, from the basics to the advanced. In a broad sense, one of SSIS’s main purposes is to cleanse data — that is, transform data from a source to a destination and perform operations on it along the way. In that sense, someone could correctly say that every transformation in SSIS is about data cleansing. For example, consider the following transformations:
· The Data Conversion adjusts data types.
· The Sort removes duplicate data.
· The Merge Join correlates data from two sources.
· The Derived Column applies expression logic to data.
· The Data Mining predicts values and exceptions.
· The Script applies .NET logic to data.
· The Term Extraction and Term Lookup perform text mining.
In a stricter sense, data cleansing is about identifying incomplete, incorrect, or irrelevant data and then updating, modifying, or removing the “dirty” data. From this perspective, SSIS has four primary data cleansing transformations, which are reviewed in this chapter:
· Derived Column Transformation: This transformation can perform advanced expression-based data cleansing. If you have just basic data cleansing needs, like blanks or nulls or simple text parsing, this is the right place to start. The next section will walk through some examples.
· Fuzzy Lookup Transformation: Capable of joining to external data based on data similarity, the Fuzzy Lookup Transformation is a core data cleansing tool in SSIS. This transformation is perfect if you have dirty data input that you want to associate to data in a table in your database based on similar values. Later in the chapter, you’ll take a look at the details of the Fuzzy Lookup Transformation and what happens behind the scenes.
· Fuzzy Grouping Transformation: The main purpose is de-duplication of similar data. The Fuzzy Grouping Transformation is ideal if you have data from a single source and you know you have duplicates that you need to find.
· DQS Cleansing: The Data Quality Services Cleansing Transformation leverages the DQS engine to perform predefined data quality rules and mapping. If you have any advanced cleansing where you would like to apply rules and manage cleansing logic, the DQS Transformation using the DQS engine is the right choice for you.
In addition to these data cleansing transformations, SSIS also has a Data Profiling Task that can help you identify any issues within your dirty data as you plan its necessary data cleansing. See Chapter 3 for an overview of the Data Profiling Task and Chapter 12 for a more detailed review of its functionality.
This chapter will also explore Master Data Services as a way of standardizing reference data. MDS give users the familiar interface of Excel to manage and correct data to truly have one version of the truth.
ADVANCED DERIVED COLUMN USE
If you’ve used the data flow in SSIS for any amount of data transformation logic, you will no doubt have used the Derived Column Transformation. It has many basic uses, from basic replacing of NULLs or blanks to text parsing and manipulation.
Using SSIS expressions, the Derived Column Transformation can be used for more advanced data cleansing operations than a simple single expression, such as the following:
· Advanced text code logic to identify and parse text values
· Checking for data ranges and returning a specified value
· Mathematical operations with advanced logic
· Date comparison and operations
Chapter 5 reviews the expression language in thorough detail. Figure 10-1 highlights the Derived Column Transformation expression toolbox within the Derived Column Transformation Editor.
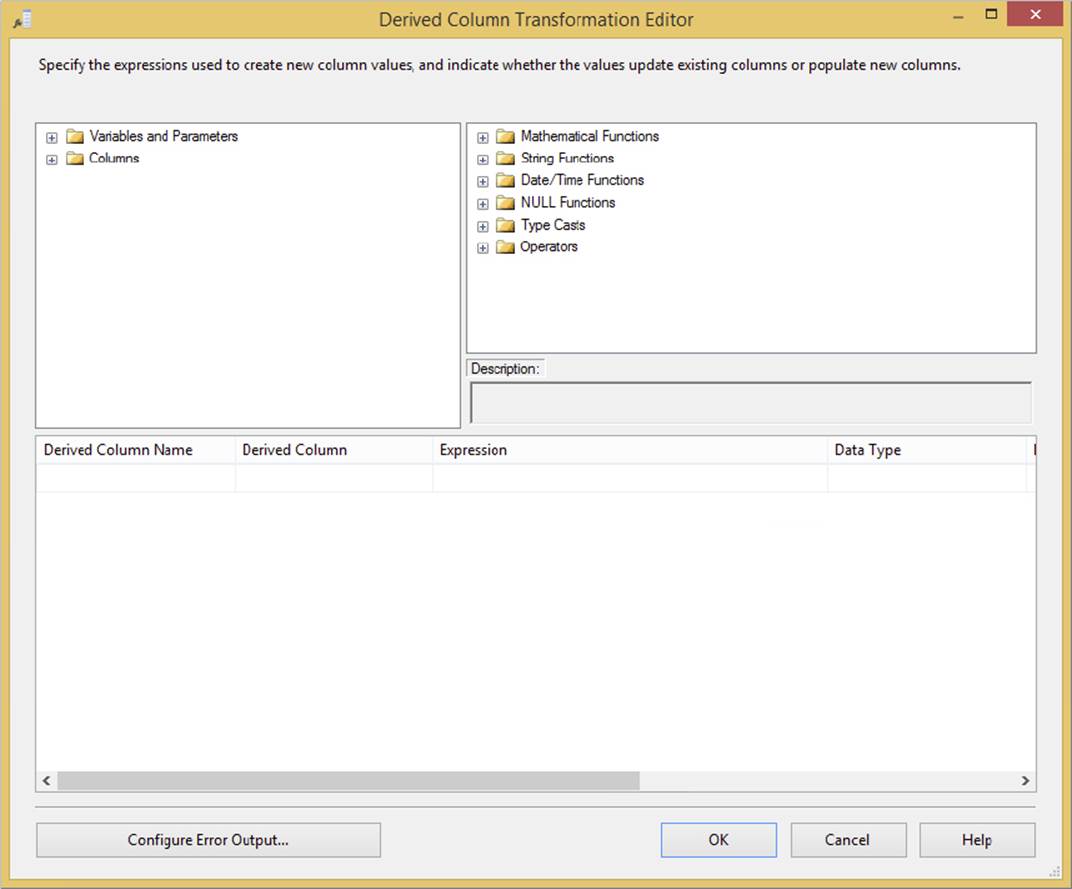
FIGURE 10-1
One challenge with the Derived Column Transformation is parsing more complicated text strings and effectively using expressions without duplicating expression logic. This next section walks you through an example of pulling out information from values.
Text Parsing Example
To see an example of text mining, consider the example source data from the following list. It contains oceanographic buoy locations off the coast of the United States. Some of them are near cities, while others are in locations farther off the coast. In addition to the location, the text values also contain some codes and switches irrelevant to what you need to parse.
1. 6N26 /V S. HATTERAS, NC
2. 3D13 /A EDISTO, SC
3. 3D14 /A GRAYS REEF
4. 6N46 /A CANAVERAL, FL
5. 6N47 /A CANAVERAL EAST, FL
6. 3D56 /A ST. AUGUSTINE, FL
7. 3D55 /A FRYING PAN SHOALS
8. 3D36 /D BILOXI, MS
9. 3D35 /D LANEILLE, TX
10.3D44 /D EILEEN, TX
Can you use the Derived Column Transformation to pull out the locations embedded within the text? For locations that are near cities, can you also identify the appropriate state code? More important, can you do this efficiently and clearly?
Most ETL developers would try to do this in a single Derived Column step with one expression. They would end up with something like this:
SUBSTRING((ISNULL(Location) ? "Unknown" :
TRIM(Location)),FINDSTRING((ISNULL(Location) ? "Unknown" : TRIM(Location)),"/",1)
+ 3,(FINDSTRING((ISNULL(Location) ? "Unknown" : TRIM(Location)),",",1) == 0 ?
(LEN((ISNULL(Location) ? "Unknown" : TRIM(Location))) -
FINDSTRING((ISNULL(Location) ? "Unknown" : TRIM(Location)),"/",1) + 4) :
(FINDSTRING((ISNULL(Location) ? "Unknown" : TRIM(Location)),",",1) -
FINDSTRING((ISNULL(Location) ? "Unknown" : TRIM(Location)),"/",1) - 3)))
To be sure, this code will work. It identifies text values, where the location begins, and when a location has a state code appended to it. However, the clarity of the code leaves much to be desired.
One thing you can notice in the preceding code is the redundancy of some expressions. For example, it is replacing a NULL value in the Location column with "Unknown". In addition, several FINDSTRING functions are used to locate the "/" in the code.
A better approach is to break the code into multiple steps. Figure 10-2 illustrates a Data Flow that contains two Derived Column Transformations.
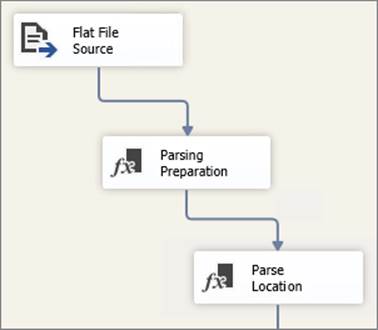
FIGURE 10-2
The first Derived Column Transformation performs a few preparation steps in the data that is then used in the second transformation. Figure 10-3 highlights the expressions used in the first “Parsing Preparation” transformation.
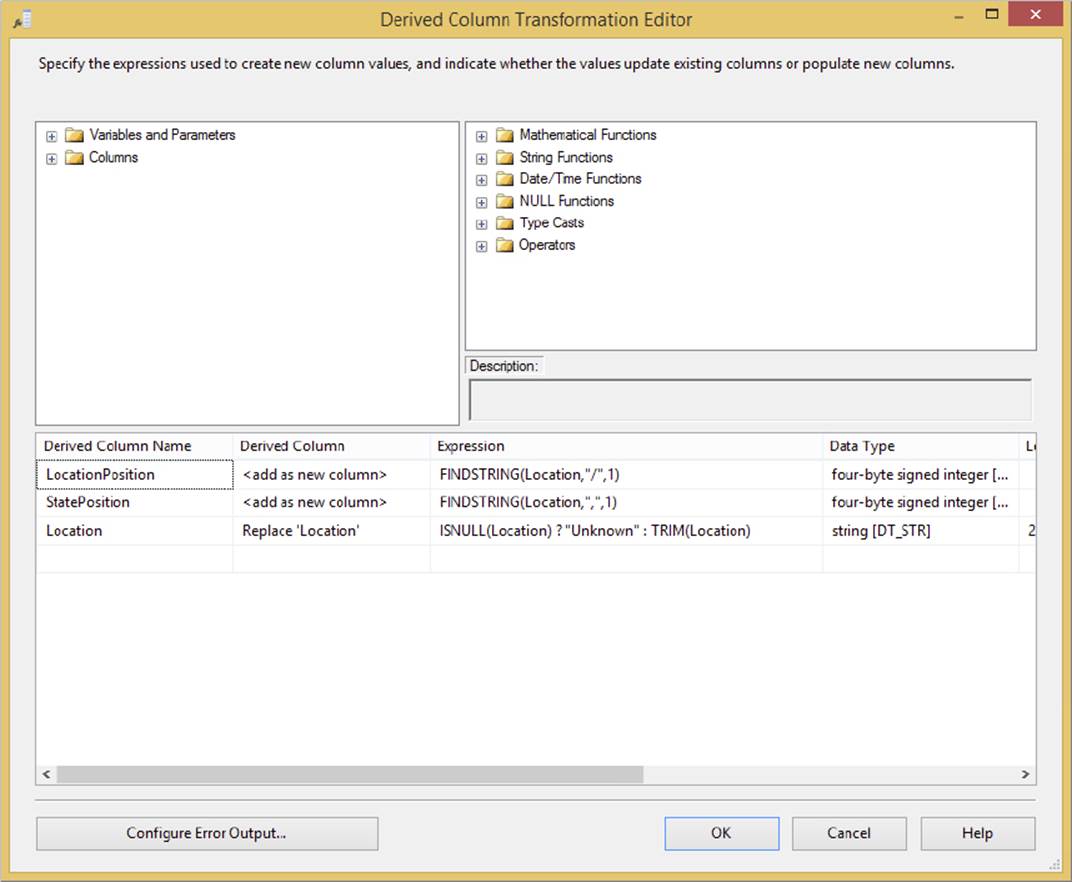
FIGURE 10-3
This transformation performs the three common expressions needed to handle the string logic that pulls out the location information from the data:
· LocationPosition: This new column simply identifies where the "/" is in the code, since that is immediately before the location is named.
· StatePosition: This expression looks for the existence of a comma (,), which would indicate that the location is a city with an accompanying state as part of the location description.
· Location: This column is replaced with "Unknown" if the Location value is missing.
With these preparation steps, the expression logic needed to perform the parsing of the text becomes a lot cleaner. The following code is part of the second Derived Column Transformation, which parses out the name of the location:
SUBSTRING(Location,LocationPosition + 3,(StatePosition == 0 ?
(LEN(Location) - LocationPosition + 4) :
(StatePosition - LocationPosition - 3)))
Now the expression is more readable and easier to follow. Note that to employ this approach, you need to break your Data Flow into two Derived Column Transformations because in order for expression logic to reference a Data Flow column, it must be available in the input of the transformation.
ADVANCED FUZZY LOOKUP AND FUZZY GROUPING
The two fuzzy transformations within SSIS, Fuzzy Lookup and Fuzzy Grouping, deal with associating data through data similarity, rather than exact data matching. The “fuzzy” part of the transformation name refers to data coupling based on selected data mapping using defined similarity and confidence measurements. Here is a brief description of each:
· Fuzzy Lookup: The Fuzzy Lookup Transformation takes input data from a Data Flow and matches it to a specified table within SQL Server joined across data similarity column matching. The Fuzzy Lookup is like the Lookup Transformation, except that the column mapping can be adjusted to evaluate data likeness and the output can be tuned to return one or more potential results.
· Fuzzy Grouping: This transformation takes a single input from the Data Flow and performs a comparison with itself to try to identify potential duplicates in the data. The grouping doesn’t evaluate all the columns in the source input; it only searches for duplicates across the columns you select based on the similarity settings that you define.
This section begins with the Fuzzy Lookup Transformation by reviewing its general functionality. It then digs a little deeper to reveal how it works under the covers. The Fuzzy Grouping Transformation works very similarly to the Fuzzy Lookup Transformation.
Fuzzy Lookup
The very basic purpose of the Fuzzy Lookup is to match input data to a lookup table whose columns you are matching across that do not necessarily match exactly. The Fuzzy Lookup Transformation is therefore very similar to the Lookup Transformation, except you are not joining with identical values; you are joining with similar values. Figure 10-4 shows the (regular) Lookup Transformation, whereby several columns are mapped to a lookup table and a key column is returned.
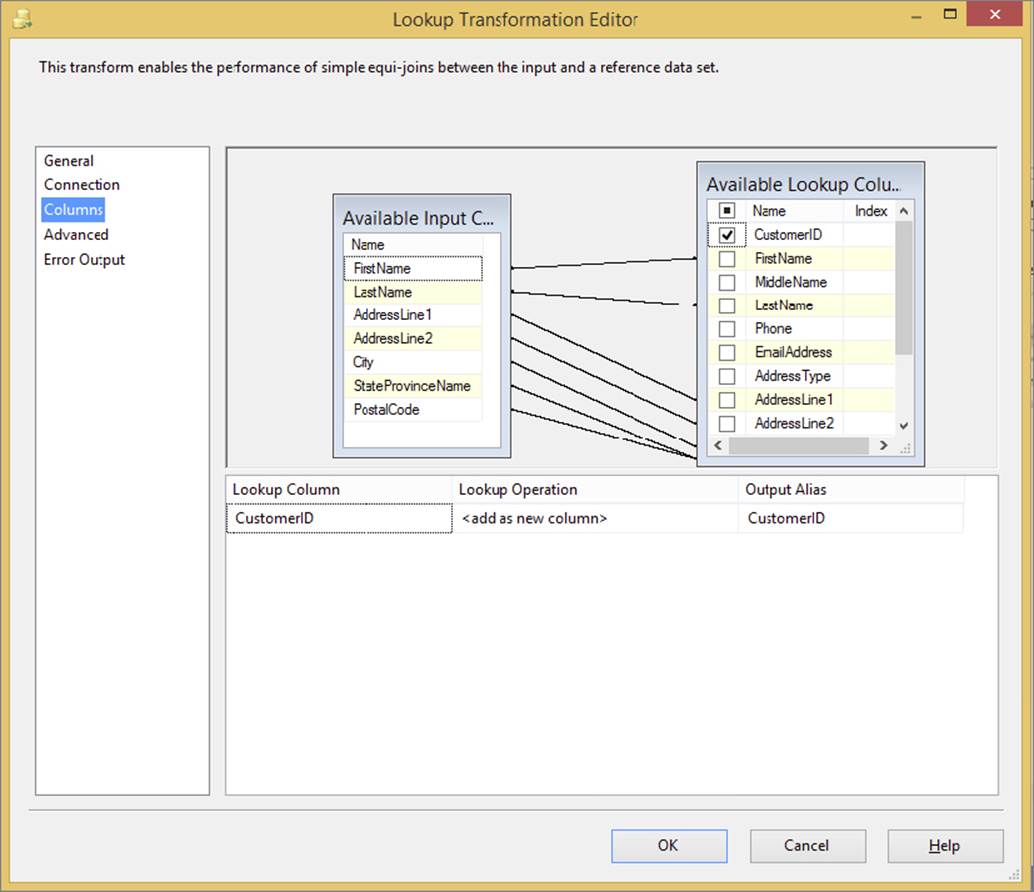
FIGURE 10-4
The input data in Figure 10-4 is from Excel, a common source of dirty data due to issues with data conversion, missing data, or typographical errors. The simple Data Flow in Figure 10-5 shows that the Lookup has the error output configured to redirect missing rows; as you can see, seven rows do not match to the Lookup table when the Data Flow is executed.
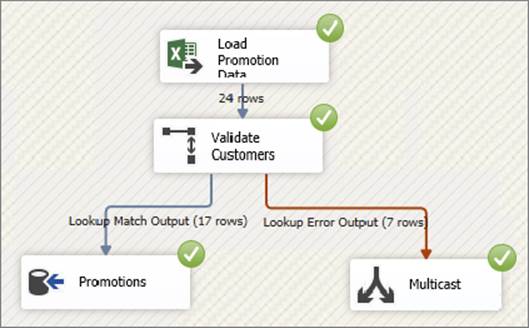
FIGURE 10-5
To find the missing record matches for the seven rows, you can use the Fuzzy Lookup Transformation. The best way to use the Fuzzy Lookup is when you have a set of data rows that you have already tried matching with a Lookup, but there were no matches. The Fuzzy Lookup does not use cached data and requires SQL Server to help during the processing, so it is more efficient to take advantage of a cached Lookup to handle the large majority of records before using the Fuzzy Lookup.
Figure 10-6 shows the Fuzzy Lookup Transformation Editor. The first tab, Reference Table, requires you to select the reference table that the Fuzzy Lookup needs to match, just like the Lookup Transformation. Later in this section, you will see the advanced settings.
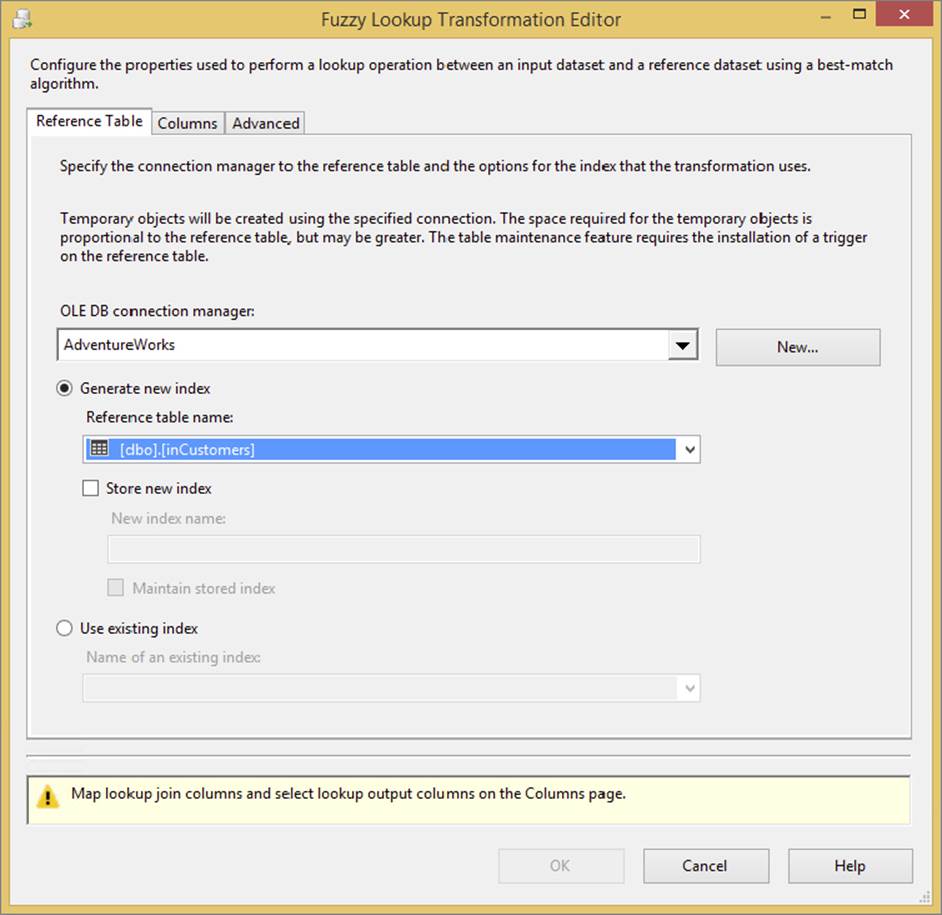
FIGURE 10-6
On the Columns tab, you need to join the matching columns from the input to the Lookup reference table. Because the purpose is to find matches, you can then determine which columns in the lookup reference table need to be added to the Data Flow. The Fuzzy Lookup example in Figure 10-7 is identical to the Lookup mapping in Figure 10-4, where the primary key column, CustomerID, is returned to the Data Flow.
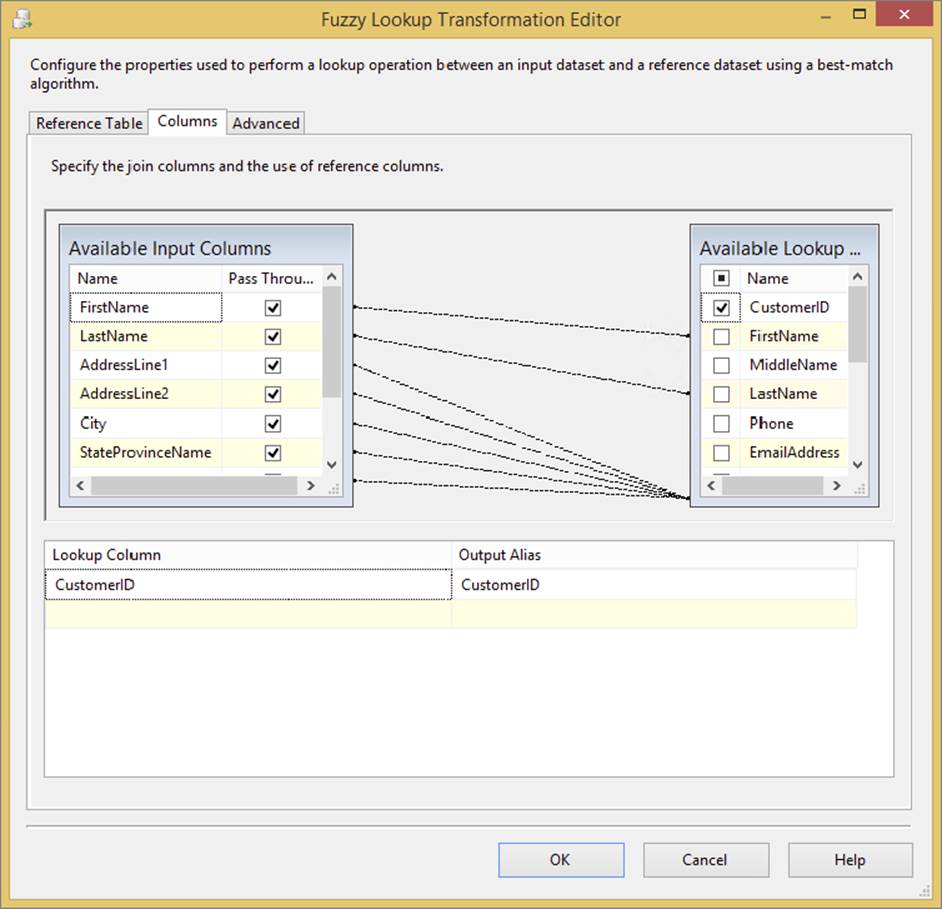
FIGURE 10-7
The Fuzzy Lookup Transformation has a few advanced features (see Figure 10-8) to help you determine what should be considered a match:
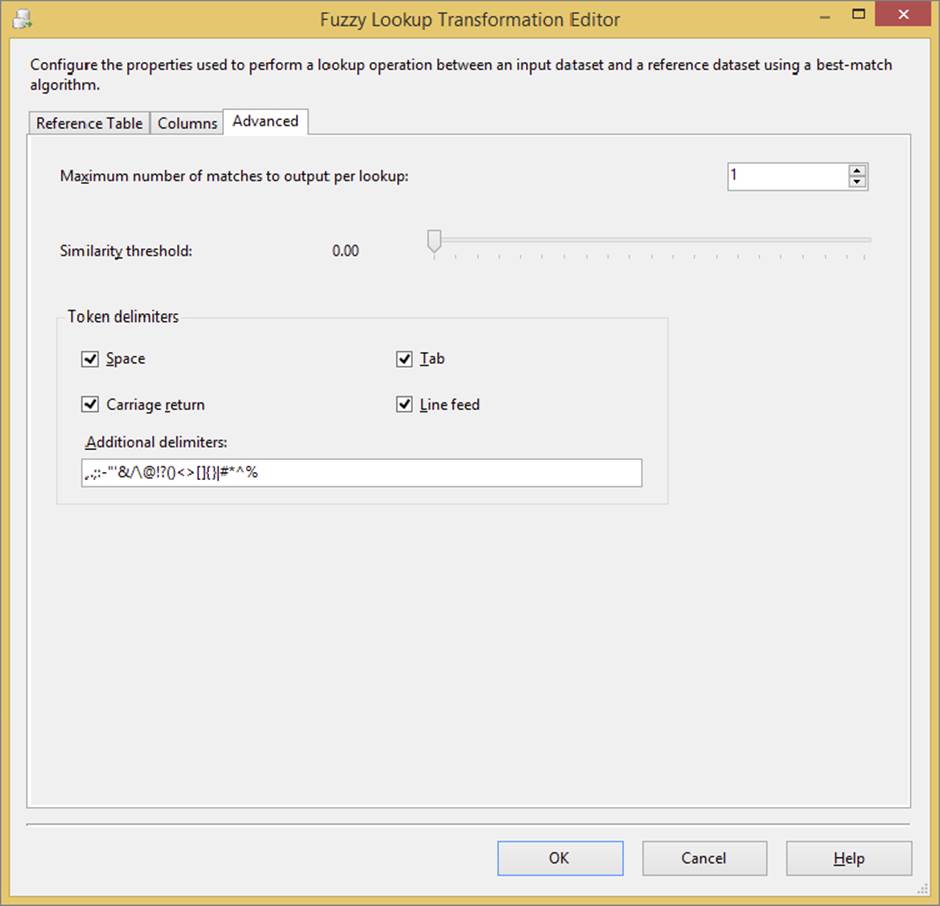
FIGURE 10-8
· For every input row, the “Maximum number of matches to output per lookup” option will limit the potential matches to the number that is set. The Fuzzy Lookup will always select the top matches ordered by similarity, highest to lowest.
· The “Similarity threshold” option defines whether you want to limit the matches to only values above a defined likeness (or similarity). If you set this to 0, you will always get the same number of lookup rows per input row as defined in the “Maximum number of matches to output per lookup” setting.
· Because the Fuzzy Lookup is matching on text, some custom features enable the Lookup to determine when to identify a separation in characters (like more than one word). These are the token delimiters.
In the example we are building, once the Fuzzy Lookup is configured a Union All is added to the Data Flow and the output of the Lookup and the Fuzzy Lookup are both connected to the Union All. The output of the Union All is then connected to the destination.
Figure 10-9 shows the completed Data Flow with the execution results. The seven rows that didn’t match the Lookup Transformation have been successfully matched with the Fuzzy Lookup, and the data has been brought back together with the Union All.
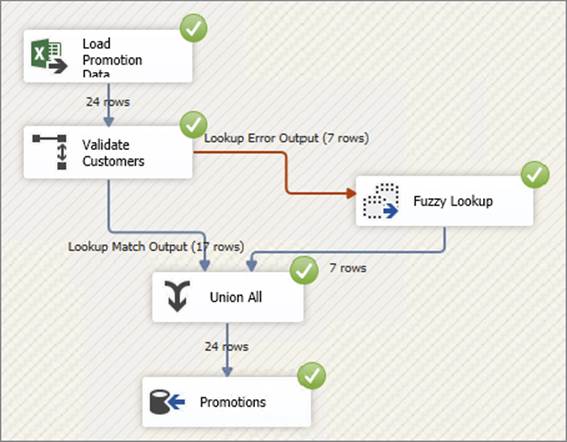
FIGURE 10-9
In order to better understand how the Fuzzy Lookup is matching the data, you can add a Data Viewer to the output path in the Fuzzy Lookup. As Figure 10-10 demonstrates, right-click on the path and select Enable Data Viewer.
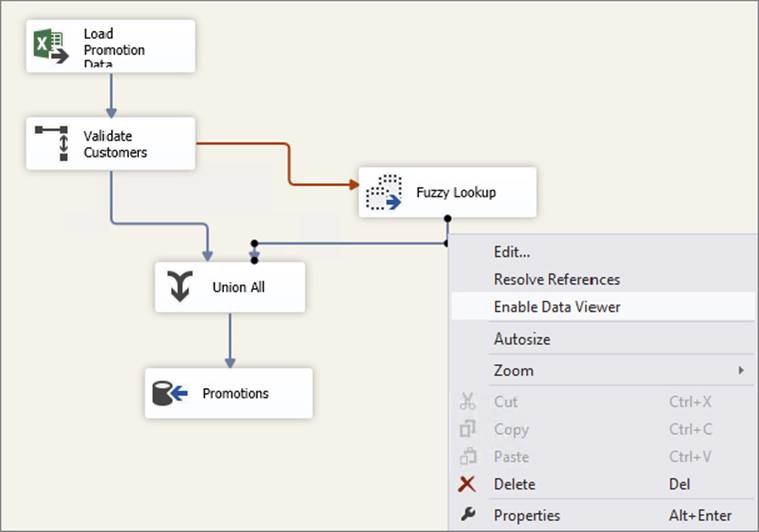
FIGURE 10-10
The Fuzzy Lookup has added more than just the reference table’s lookup column, as shown in the Data Viewer output in Figure 10-11:
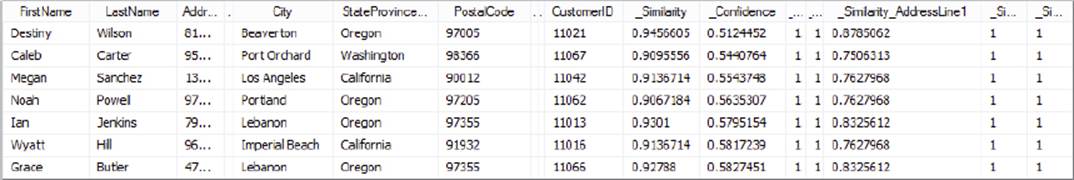
FIGURE 10-11
· _Similarity: This is the overall similarity of the source input row to the match row that the Fuzzy Lookup found.
· _Confidence: This is not about the current row but how many other rows are close in similarity. If other rows are identified as close in similarity, the confidence drops, because the Fuzzy Lookup is less confident about whether the match found is the right match.
· _Similarity_[Column Name]: For every column used in the match (refer to Figure 10-7), the Fuzzy Lookup includes the individual similarity of the input column to the match row in the reference table. These columns begin with “_Similarity_” and have the original column name as a suffix.
As you can see in the Data View output from Figure 10-11, the similarity of the matching rows varies between 91 and 96 percent. The columns on the right-hand side of Figure 10-11 indicate the degree of similarity between the matching columns. Notice that many of them have a value of 1, which indicates a perfect match. A value less than 1 indicates the percentage of similarity between the input and reference join.
Note that the confidence is in the 50 percent range. This is because most of the sample data is from matching cities and states, which increases the similarity of other rows and therefore reduces the confidence.
One final feature of the Fuzzy Lookup Transformation is the capability to define similarity thresholds for each column in the match. Referring back to Figure 10-7, if you double-click on one of the relationship lines, it will open the Create Relationships dialog, shown in Figure 10-12.
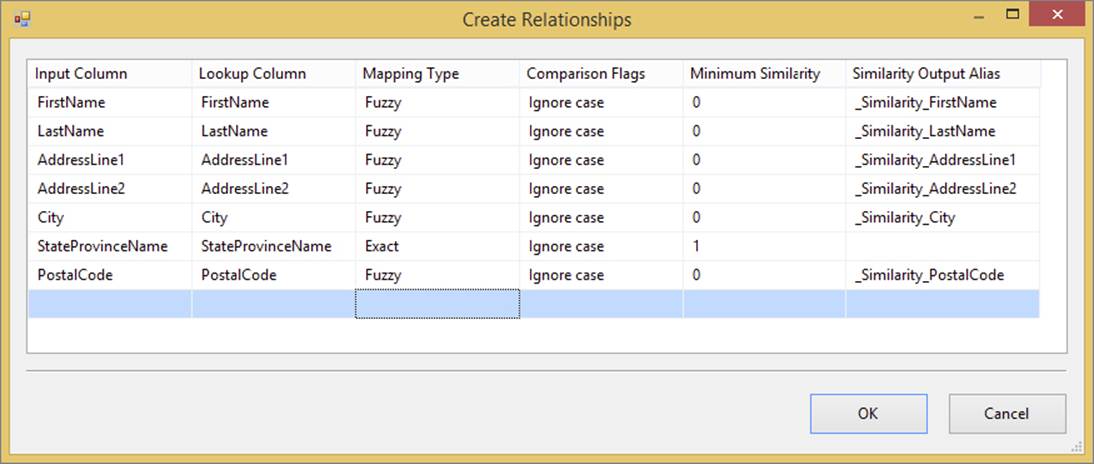
FIGURE 10-12
In this example, the StateProvinceName has been set to an Exact Match type, which is a minimum similarity of 1. Therefore, the Fuzzy Lookup will identify a potential match between rows only when the StateProvinceName is identical for both the input row and the reference table.
The easiest way to understand how the Fuzzy Lookup Transformation works (behind the scenes) is to open the Fuzzy Lookup Transformation Editor, edit the reference table, and then check the “Store new index” checkbox, as Figure 10-13 shows.
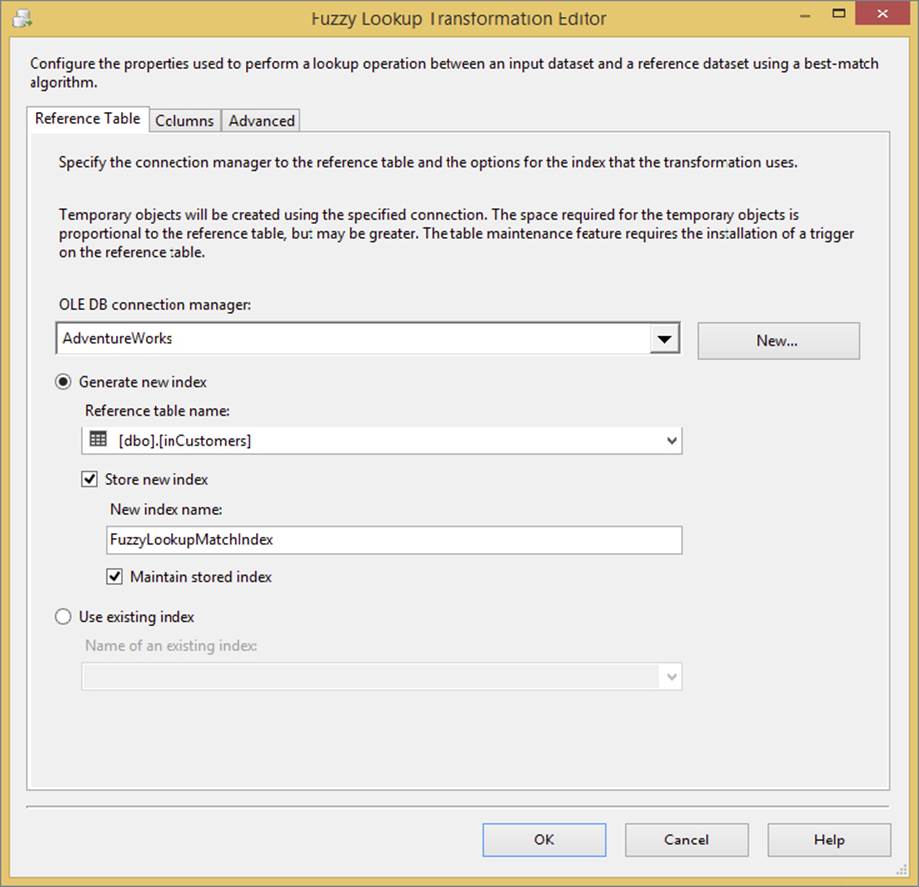
FIGURE 10-13
The Fuzzy Lookup requires a connection to a SQL Server database using the OLE DB provider because the transformation uses SQL Server to compute the similarity. To see how this works, begin by using SSMS to connect to the server and database where the lookup table is located. Expand the Tables folder, as shown in Figure 10-14.
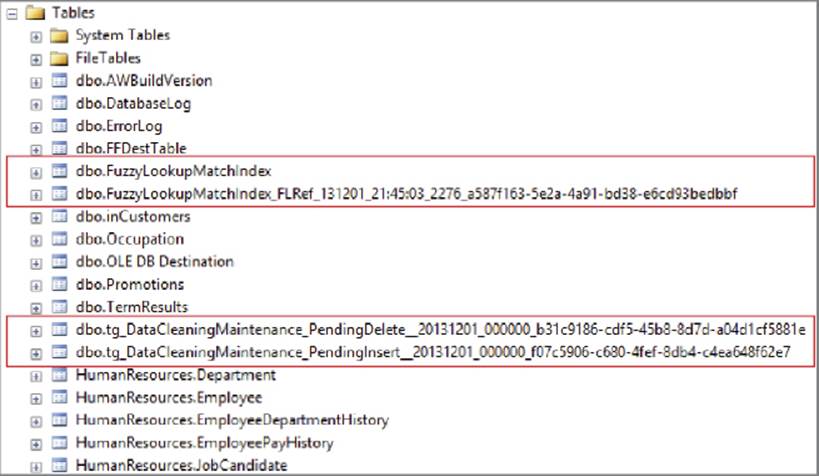
FIGURE 10-14
The Fuzzy Lookup has created a few tables. The FuzzyLookupMatchIndex tables contain the data in the reference table, tokenized for the Fuzzy Lookup operation. In addition, if you checked the “Maintain stored index” checkbox (refer to Figure 10-13), you will also get a couple of additional tables that contain data for inserts and deletes from the reference table. Not shown are the indexes on the reference table, which keep the data updated.
Figure 10-15 shows sample data from the FuzzyLookupMatchIndex table. The Token column contains partial data from the values for each row in the reference table. The ColumnNumber is the ordinal of the column from the input data set (basically, which column is being referenced in each row). The values in the Rids column look quite strange. This is because SSMS cannot display the binary data in text. However, this column contains the Row Identifiers (RIDs) for every row in the reference table that contains the same token. If you trace the Fuzzy Lookup during package execution, you will find that the input row is also tokenized and matched to the data in the Match Index table, which is how the engine determines the similarity.
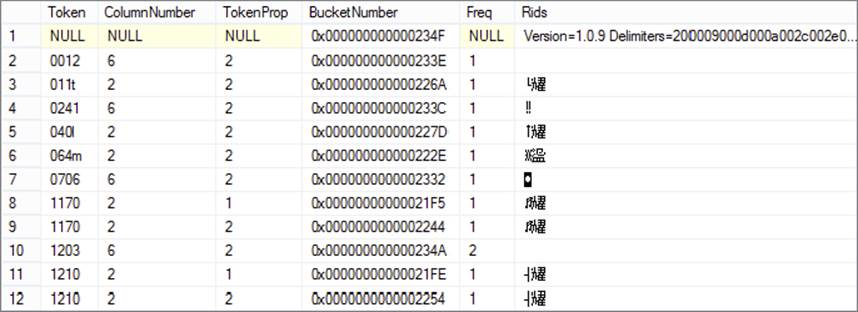
FIGURE 10-15
As you may have guessed from looking at how the Fuzzy Lookup Transformation works, it can consume a lot of server resources. This is why you may want to handle the exact matches first using a standard Lookup Transformation.
Fuzzy Grouping
The Fuzzy Grouping Transformation is similar to the Fuzzy Lookup in that it uses the same approach to find matches and it requires SQL Server. Rather than reference an external table, however, the Fuzzy Grouping matches the input data to itself in order to find duplicates. This process is commonly referred to as de-duplication.
Figure 10-16 shows an example Data Flow that performs several common transformations. Data is imported from Excel and transformed in a few steps. Right before the destination, a Fuzzy Grouping is added to the Data Flow.
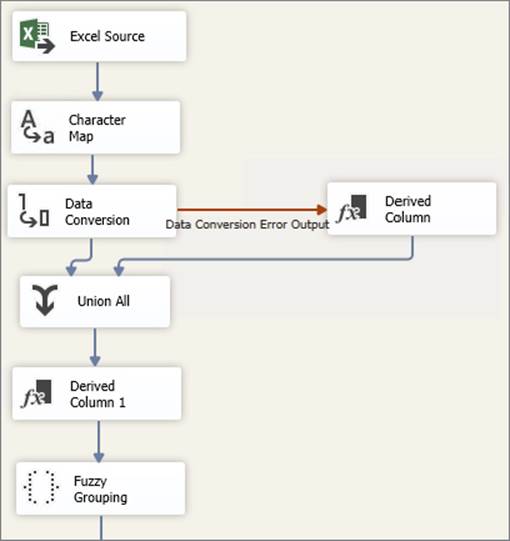
FIGURE 10-16
When you edit the Fuzzy Grouping, you will find some similar settings to the Fuzzy Lookup. Note that on the Connection Manager tab, shown in Figure 10-17, the only property is the connection to SQL Server. This is because there is no reference table that the Fuzzy Grouping needs to join. It just needs the connection where it can store its temporary data.
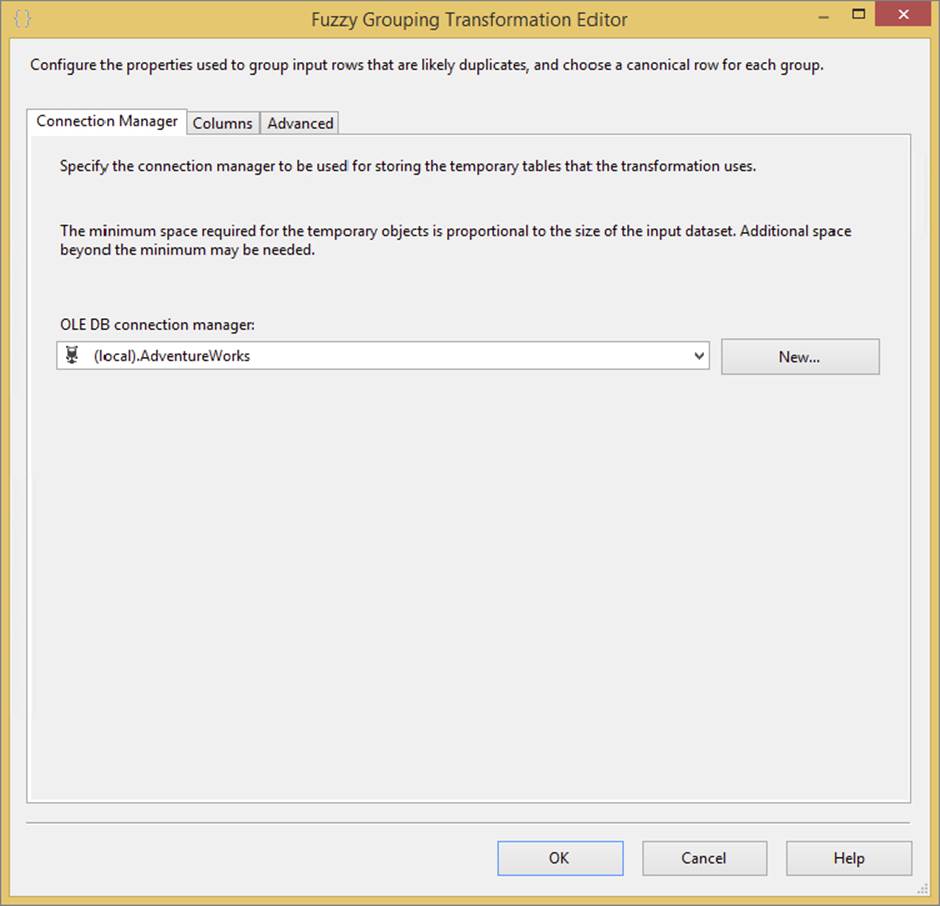
FIGURE 10-17
Each column in the input has two settings that you can set. The first is the checkbox (Figure 10-18 shows a few columns selected). This determines whether the Fuzzy Grouping will use this column to identify duplicates. The Pass Through column enables columns to appear downstream even when they are not used in the identification of duplicates.
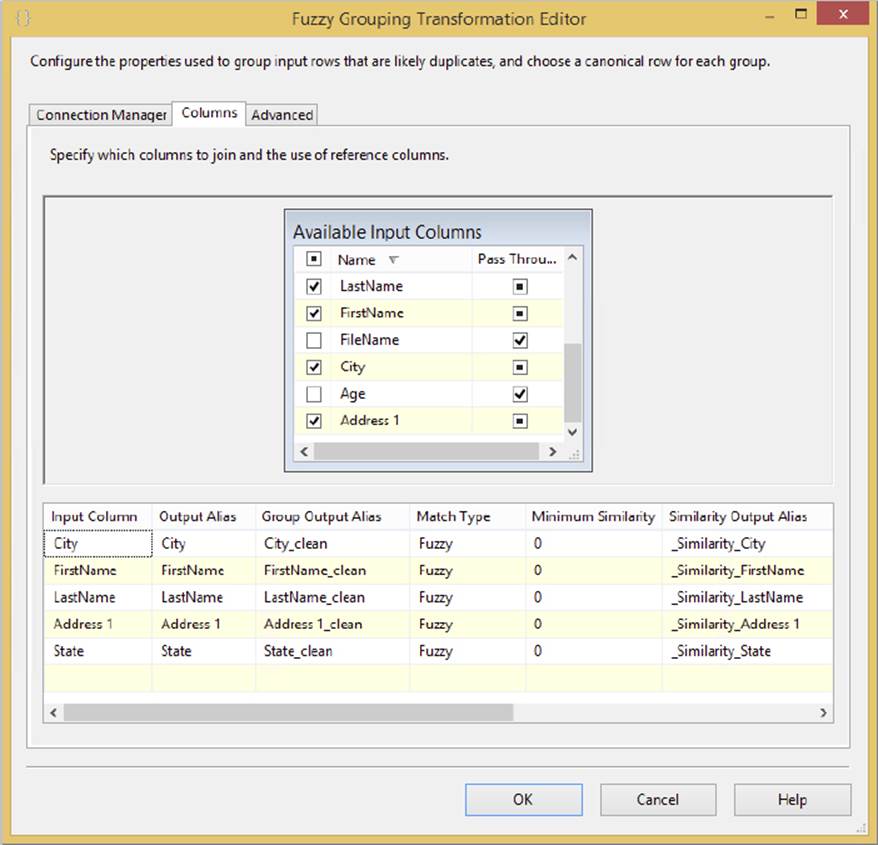
FIGURE 10-18
Another thing that Figure 10-18 highlights is that the Fuzzy Grouping Transformation provides the same capability as the Fuzzy Lookup to set a minimum similarity on a column-by-column basis.
On the Advanced tab, shown in Figure 10-19, you can fine-tune the Fuzzy Grouping to specify the overall Similarity threshold. If a potential matching row does not meet this threshold, it is not considered in the de-duplication. You can also set the output columns.
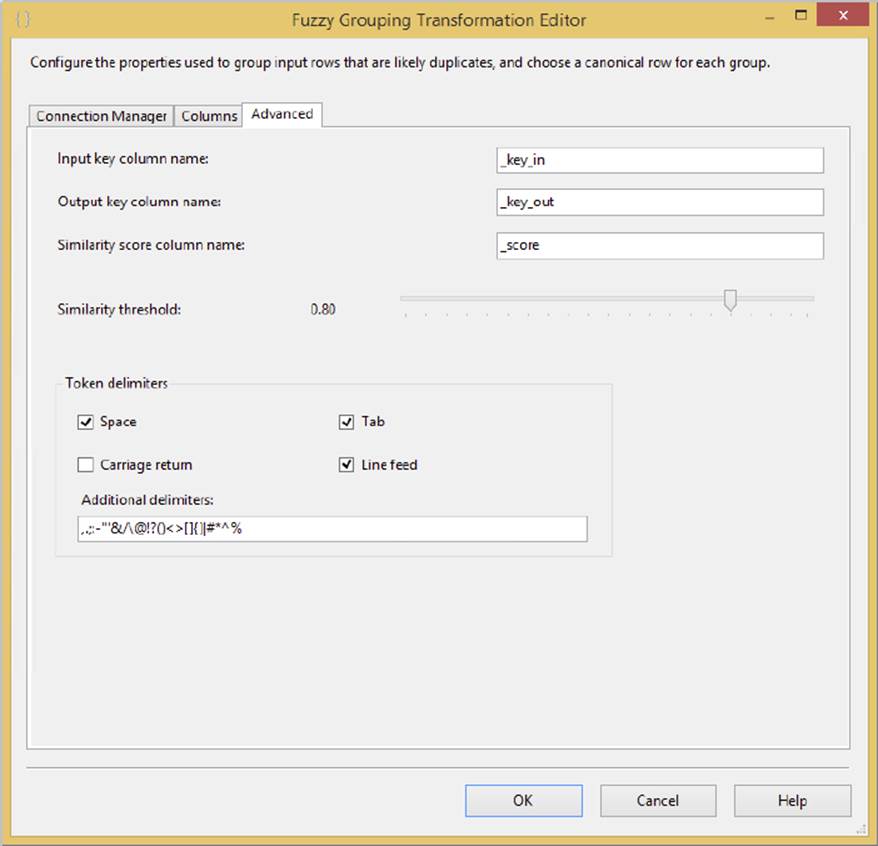
FIGURE 10-19
Just as in the Fuzzy Lookup, you can see the output by adding a Data Viewer to the output path from the Fuzzy Grouping. Figure 10-20 illustrates how the Fuzzy Grouping works. A _key_in column and a _key_out column are added to the Data Flow. When the Fuzzy Grouping identifies a potential match, it moves the row next to the potential match row. The first row key is shared in the _key_out column. The _key_in identifies where the rows originated.
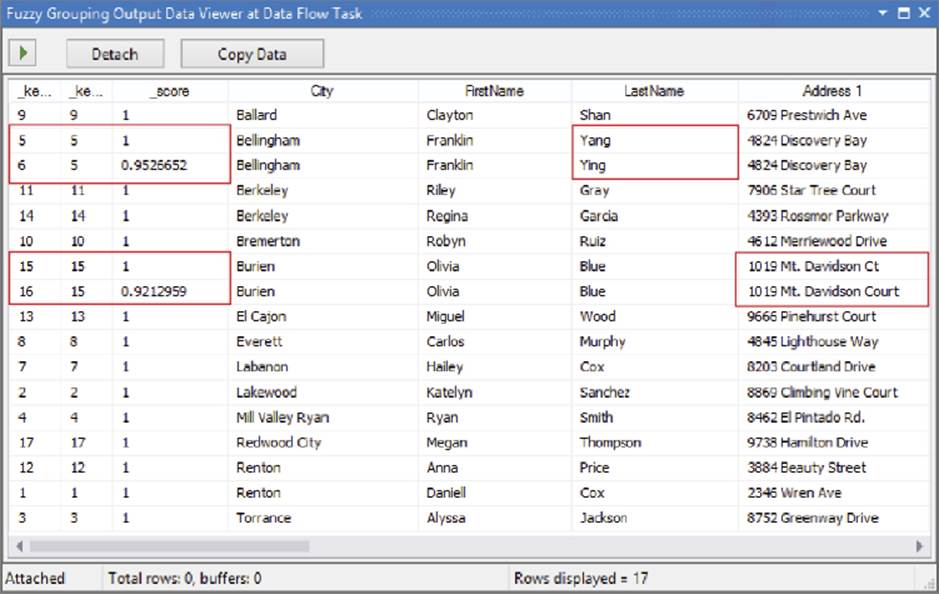
FIGURE 10-20
As the example in Figure 10-20 shows, there are a couple of matches. LastName was misspelled in _key_in value of 6, but because the similarity _score is 95 percent, the engine determined it was a match (it was above the similarity threshold of 80 percent defined inFigure 10-19). In another couple of rows highlighted, the street address is slightly different.
The key to the Fuzzy Grouping is the _score column. If you wanted to just go with the Fuzzy Grouping results and de-duplicate your source, you would add a Conditional Split Transformation to the Data Flow and allow only rows through the Condition Split whose _score == 1 (the double equals is the expression language Boolean logic match check). Alternately, you could define custom expression logic to choose an alternate row.
As the preceding two sections have demonstrated, both the Fuzzy Lookup and the Fuzzy Grouping provide very powerful data cleansing features that can be used in a variety of data scenarios.
DQS CLEANSING
Introduced in SQL Server 2012 was a component called Data Quality Services (DQS). This is not a feature of Integration Services, but it is very much connected to the data cleansing processes within SSIS. In fact, there is a data transformation called the DQS Cleansing Task. This task connects to DQS, enabling you to connect incoming Data Flow data and perform data cleansing operations.
Because this book focuses on SSIS, a full DQS tutorial is not included; however, this section provides a brief overview of DQS and highlights a few data quality examples. To gain more understanding, you can also watch the DQS one day course by the Microsoft DQS Team at http://technet.microsoft.com/en-us/sqlserver/hh780961.aspx.
Data Quality Services
The workflow to use DQS within SSIS requires a few preparatory steps. These need to be performed within the DQS client tool connected to a DQS service. The DQS client is available in the SQL Server 2014 Programs folder (from the Start button). There is a 32-bit version and a 64-bit version. In order to use Data Quality Services, you must have installed it during the SQL Server setup and run the configuration executable, called DQSInstaller.exe. The full setup instructions can be found on MSDN,http://msdn.microsoft.com/en-us/library/gg492277(v=SQL.120).aspx.
Once you pull up the client and connect to the server, you will be in the DQS main screen, shown in Figure 10-21.
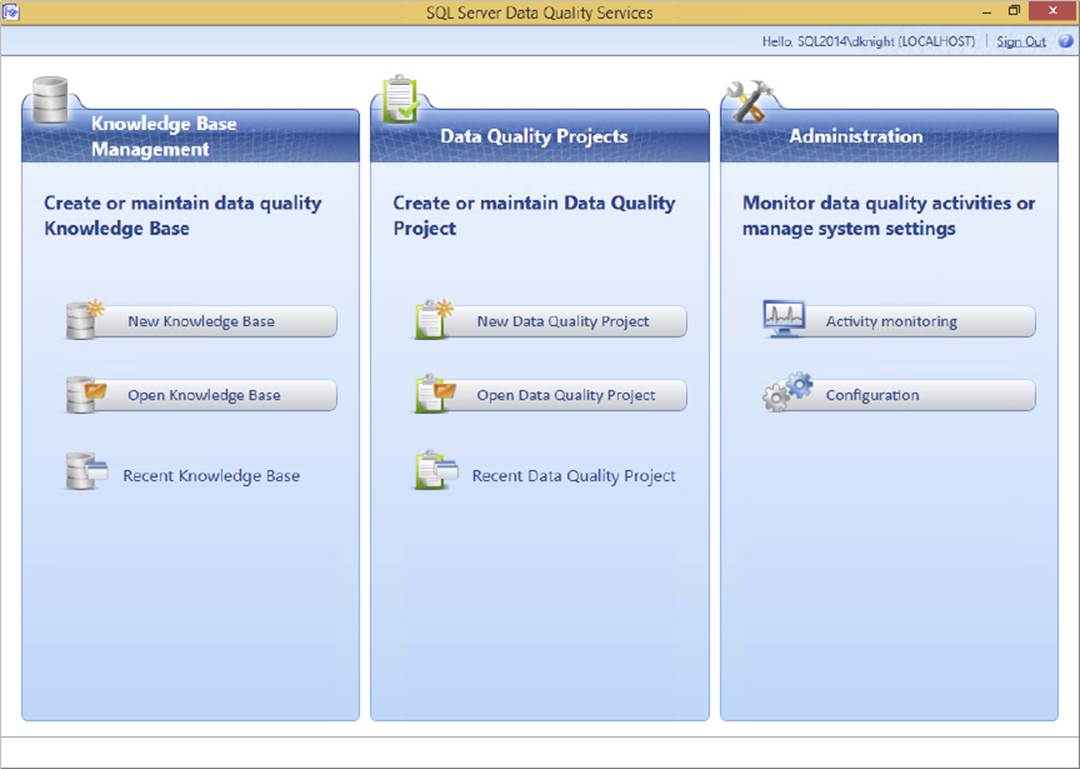
FIGURE 10-21
You can perform three primary tasks with DQS:
· Knowledge Base Management is how you define the data cleansing rules and policies.
· Data Quality Projects are for applying the data quality definitions (from the knowledge base) against real data. We will not be considering projects in this chapter; instead, you will see how to use the SSIS DQS Cleansing Task to apply the definitions.
· Administration is about configuring and monitoring the server and external connections.
To begin the process of cleansing data with DQS, you need to perform two primary steps within the Knowledge Base Management pane:
1. Create a DQS Knowledge Base (DQS KB). A DQS KB is a grouping of related data quality definitions and rules (called domains) that are defined up front. These definitions and rules are applied against data with various outcomes (such as corrections, exceptions, etc.). For example, a DQS KB could be a set of domains that relate to address cleansing, or a grouping of valid purchase order code rules and code relationships within your company.
2. Define DQS domains and composite domains. A DQS domain is a targeted definition of cleansing and validation properties for a given data point. For example, a domain could be “Country” and contain the logic on how to process values that relate to countries around the world. The value mapping and rules define what names are valid and how abbreviations map to which countries.
When you select the Open knowledge base option, you are presented with a list of KBs that you have worked with. The built-in KB included with DQS, DQS Data, contains several predefined domains and rules, and connections to external data. Figure 10-22 shows the right-click context menu, which enables you to open the KB and see the definition details.
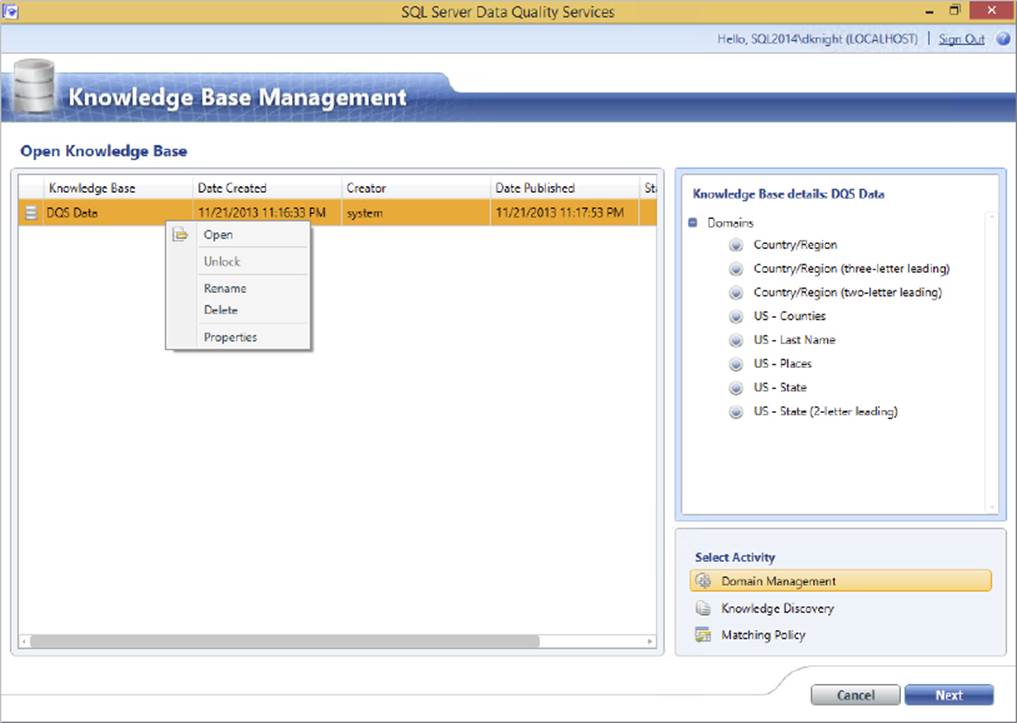
FIGURE 10-22
Knowledge bases are about domains, which are the building blocks of DQS. A domain defines what the DQS engine should do with data it receives: Is it valid? Does it need to be corrected? Should it look at external services to cleanse the data? For example, Figure 10-23 highlights the Domain Values tab of the State domain. It shows how values are cleansed and which values should be grouped. In this example, it lists state abbreviations and names and the Correct To value.
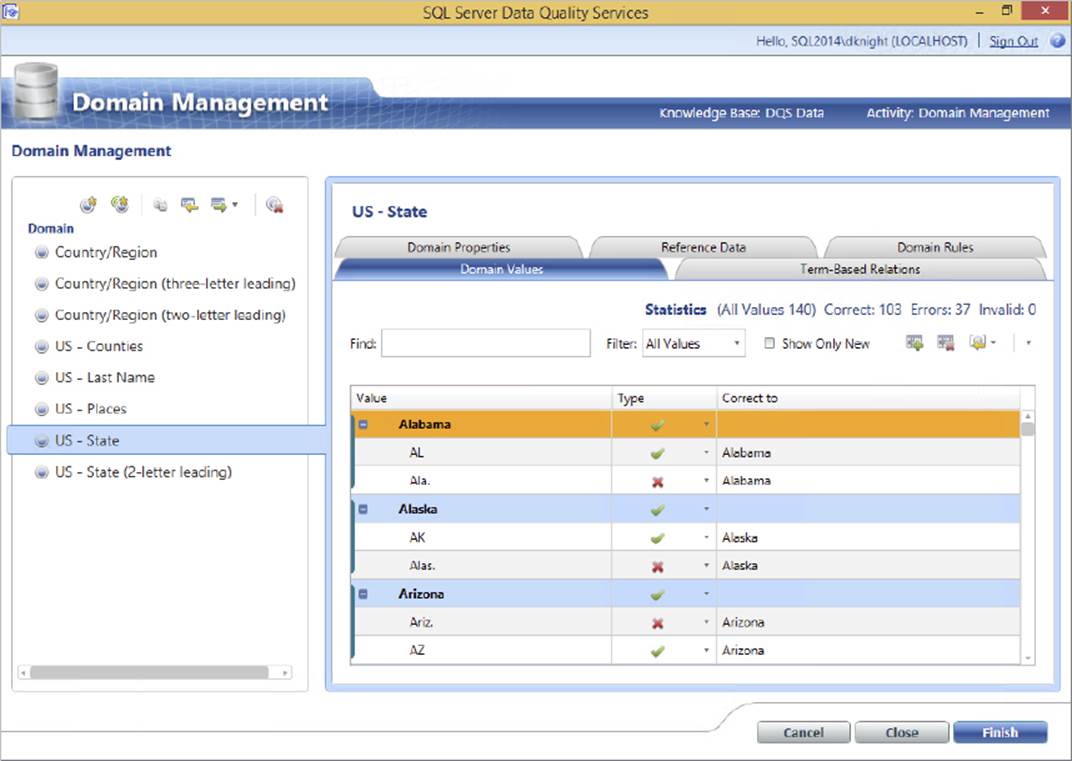
FIGURE 10-23
In the next example, a composite domain is selected. A composite domain is just what it sounds like: a group of domains. In this case, the domains involve companies, based on the business name, city, country, and state. Figure 10-24 shows the partial configuration of a composite domain. In this case, there is an external web service reference called “D&B - D&B Company Cleanse & Match” through which data will be processed. There are many sources you could connect to, such as Melissa Data for address cleansing (www.melissadata.com) or a host of data sources from the Windows Azure Data Marketplace (https://datamarket.azure.com). There are a variety of premium data sources available here. Some can be free on a trial basis, while others have a paid subscription–based fee.
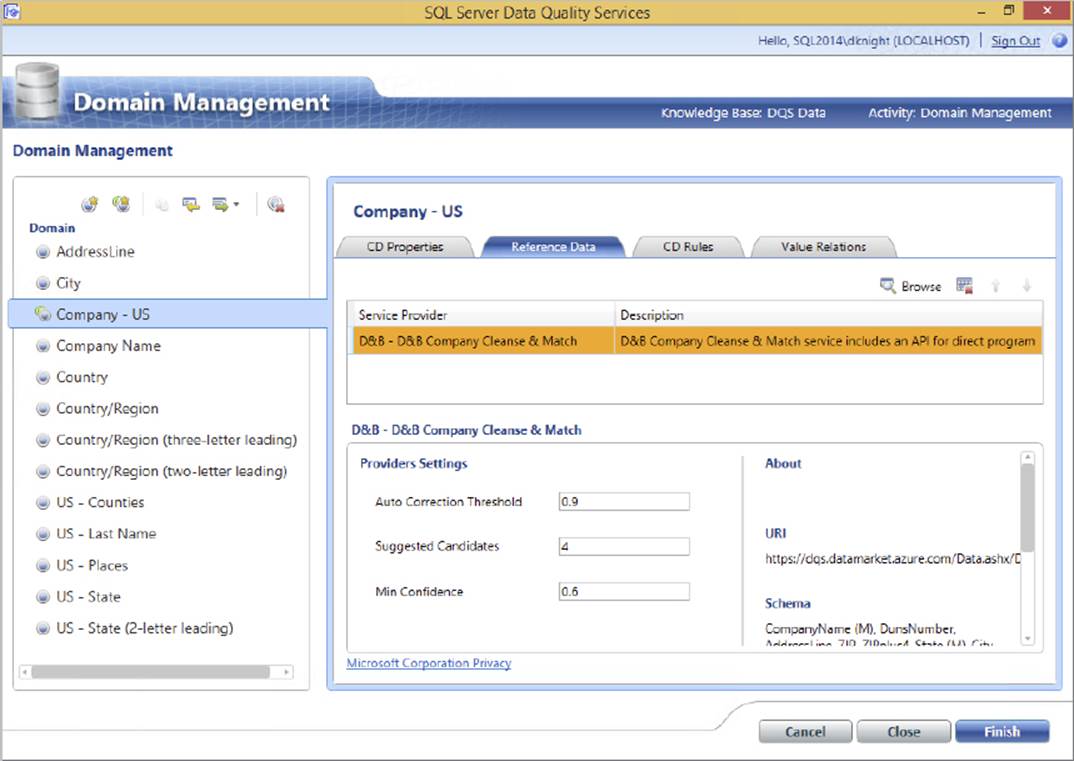
FIGURE 10-24
Domains can also contain rules that validate the data as it is processed through DQS. In the example in Figure 10-25, the Zip (Address Check) field is validated so that the length is equal to 6. You can also see some of the other options in the list. Multiple rules can be applied with logical AND or OR conditions. If a data element fails the rules, it is marked as bad data during the processing.
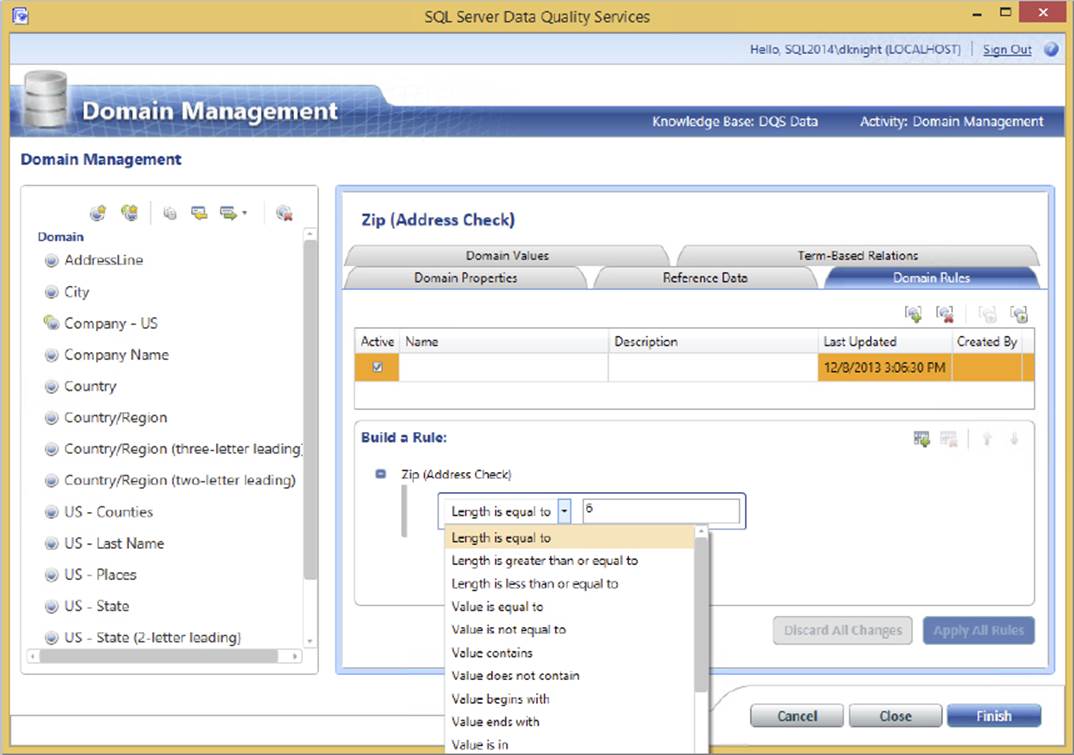
FIGURE 10-25
Other common rules include range rules to check that numeric data values fall within a given range and value lists to make sure that the data coming in meets specific requirements.
As shown in these few examples, DQS can serve as a powerful data quality engine for your organization. In addition to the common data validation and cleansing operations, you can apply a host of custom rules, matching criteria, and external links.
The next step, after your knowledge base is defined, is to process your data through SSIS.
DQS Cleansing Transformation
SSIS can connect to DQS using the DQS Cleansing Transformation. This is one of two ways that data can be applied against the knowledge bases within DQS. (A data quality project is the primary way to process data if you are not using SSIS for ETL. This is found in the DQS client tool, but it’s not described in this book, which focuses on SSIS.)
In order to use the DQS Cleansing Transformation, you will first connect to a source within your Data Flow that contains the data you plan to associate with the knowledge base.
The next step is to connect the source (or other transformation) to a DQS Cleansing Transformation and edit the task.
Figure 10-26 shows the Connection Manager tab of the DQS Cleansing Transformation. You need to connect to the DQS server and choose the knowledge base that you will be using for your source input data within SSIS.
FIGURE 10-26
In this example, the source data contains states/provinces and countries, so you will use the built-in DQS Data KB to connect the states and countries. To see the list of domains, choose DQS Data from the Data Quality Knowledge Base dropdown, as shown in Figure 10-27.
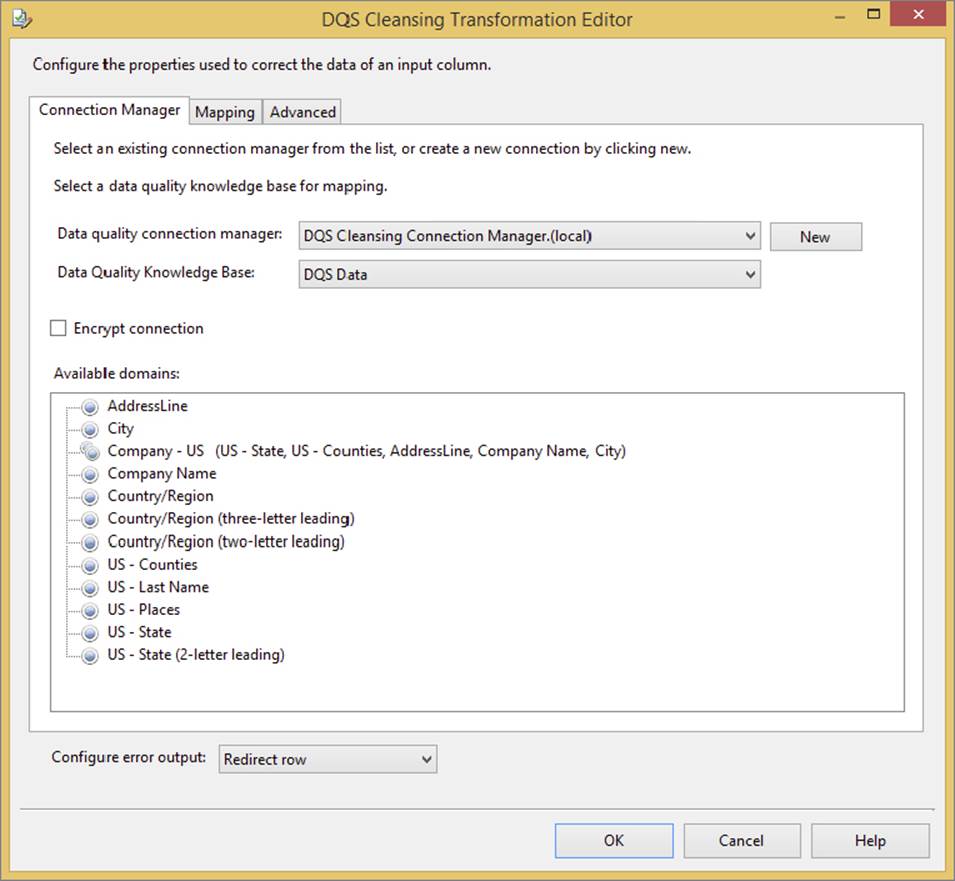
FIGURE 10-27
The Mapping tab contains the list of input columns that can be used against the KB domains. In Figure 10-28, both the StateProvinceCode and the CountryRegionName columns are selected in the input column list and matched to the US - State (2-letter leading) and Country/Region domains in the Domain dropdown.
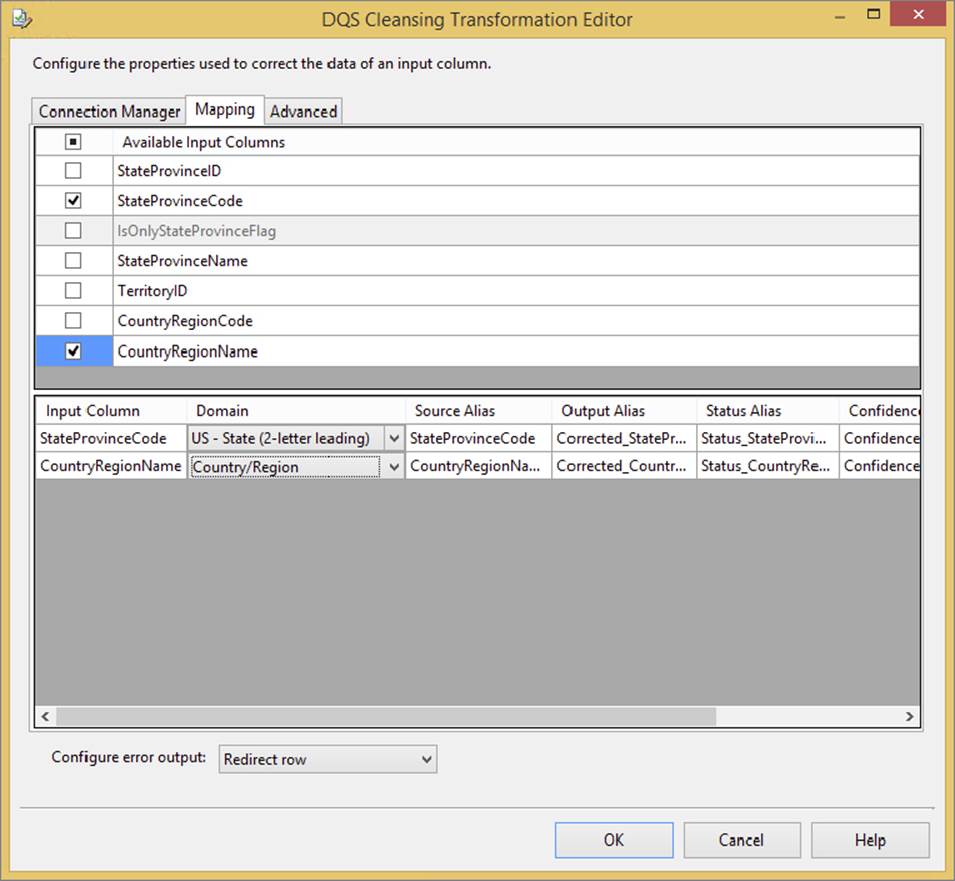
FIGURE 10-28
You are also able to redirect the errors to the error output for the rows that do not meet the domain criteria and rules, using the Configure Error Output dropdown at the bottom of the DQS editor.
Figure 10-29 shows the simple Data Flow with a couple of Multicast Transformations so that the data can be viewed (for demo purposes).
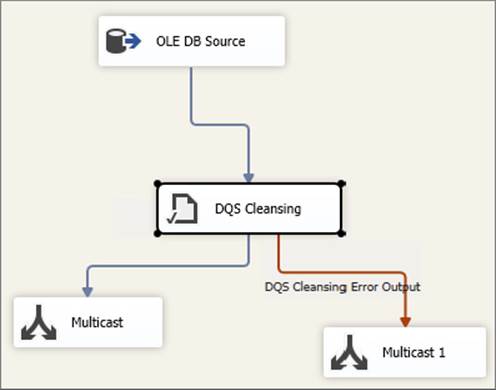
FIGURE 10-29
In addition to mapping the inputs to the DQS domain, the DQS Cleansing Transformation also provides additional data in the output of the transformation. Figure 10-30 shows a Data Viewer with the output rows and columns resulting from the DQS cleansing process.
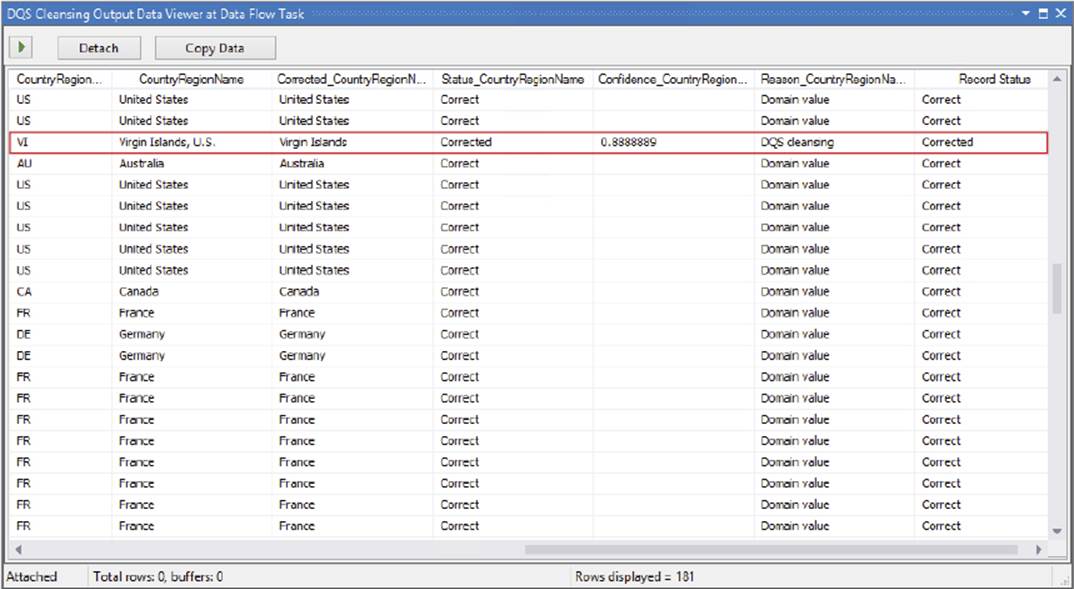
FIGURE 10-30
In this example, note the highlighted row indicating where the country was corrected and standardized to the DQS domain definition. Besides the original and corrected value returned, you can also see a reason code, as well as a confidence level on the correction. These are similar to the Fuzzy Component outputs shown earlier, except you have much more control and flexibility in terms of how you define your data cleansing process within DQS and apply it in SSIS.
An alternate way to see the data flowing through the DQS transformation is to use a Data Tap. This is for when your package is deployed to an SSIS server catalog. Chapter 22 covers how to use a Data Tap in SSIS.
MASTER DATA MANAGEMENT
Master data management (MDM) is the process an organization goes through to discover and define data with the ultimate goal of compiling a master list of data.
Gartner, the well-known technology research and advisory company, defines Master data management as “a technology-enabled discipline in which business and IT work together to ensure the uniformity, accuracy, stewardship, semantic consistency and accountability of the enterprise’s official shared master data assets” (http://www.gartner.com/it-glossary/master-data-management-mdm).
Along with choosing an MDM technology, any project will include an evaluation phase by the business to check and validate records. A successful MDM solution is reliable, centralized data that can be analyzed, resulting in better and more accurate business decisions.
Having a tool that can handle the management of a consistent data source can ease many common headaches that occur during data warehouse projects. For example, say your company recently acquired a former competitor. As the data integration expert your first task is to merge the newly acquired customer data into your data warehouse. As expected, your former competitor had many of the same customers you have listed in their transactional database. You clearly need a master customer list, which stores the most accurate data about customers from your database and also the most accurate data from the newly acquired data set. This is a very typical scenario where having an MDM solution can retain the data integrity of your data warehouse. Without such a solution the customer table in the data warehouse will start to have less accurate information and even duplicates of data.
Master Data Services
Master Data Services (MDS) was originally released in SQL Server 2008 R2 as Microsoft SQL Server’s solution for master data management. Master Data Services includes the following components and tools to help configure, manage, and administrate each feature:
· Master Data Services Configuration Manager is the tool you use to create and configure the database and web applications that are required for MDS.
· Master Data Manager is the web application that users can access to update data and also where administrative tasks may be performed.
· MDSModelDeploy.exe is the deployment tool used to create packages of your model objects that can be sent to other environments.
· Master Data Services web service is an access point that .NET developers can use to create custom solutions for MDS.
· Master Data Services Add-in for Excel is used to manage data and create new entities and attributes.
Again, because this book focuses on SSIS, a full MDS tutorial is not included; however, this section provides a brief overview of MDS. To gain more understanding, you can also watch the MDS one day course by the Microsoft MDS Team athttp://msdn.microsoft.com/en-us/sqlserver/ff943581.aspx.
To get started you must first run the Master Data Service Configuration Manger with the executable MDSConfigTool.exe. This requires the creation of a configuration database that stores the system settings that are enabled. Once the database is created, you can configure the web application called the Master Data Manager. You can find the full setup instructions on MSDN, http://technet.microsoft.com/en-us/library/ee633884(SQL.120).aspx.
The majority of the work in Master Data Services post-configuration is done by an information worker. They will use both the Master Data Manager web application and the Master Data Services Add-in for Excel. The Excel Add-in is a free download that is available here, http://go.microsoft.com/fwlink/?LinkId=219530.
The Master Data Manager allows the administrator to create new models and derived hierarchy, while the information worker uses the web interface to work with the model and hierarchy relationships. For example, if your company’s data steward found that an entire subcategory of products were placed under the wrong category, then the data steward could use the Master Data Manger to quickly and easily correct that problem. Figure 10-31 shows the interface that the data steward would use to drag and drop hierarchy corrections.
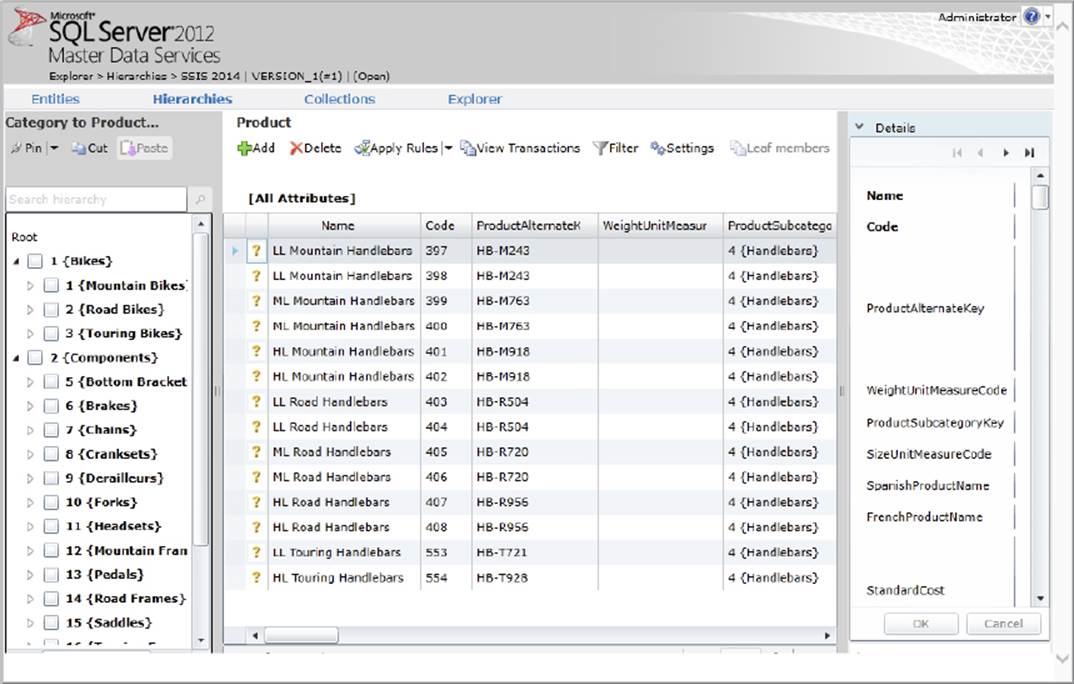
FIGURE 10-31
After installing the Master Data Services Add-in for Excel (Figure 10-32), the information worker has MDS in the environment they’re most comfortable in. Using Excel a user can connect to the MDS server, shown in Figure 10-33, and then import appropriate data sets into MDS. To do this the user simply selects a table of data in Excel and then clicks Create Entity using the Excel Master Data Ribbon (Figure 10-34).
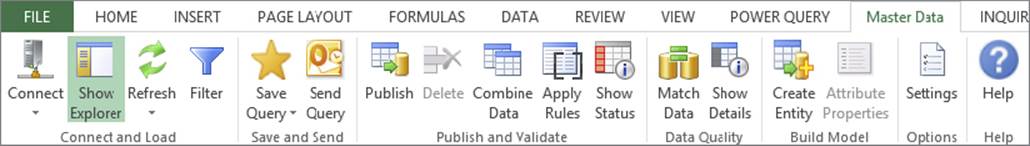
FIGURE 10-32
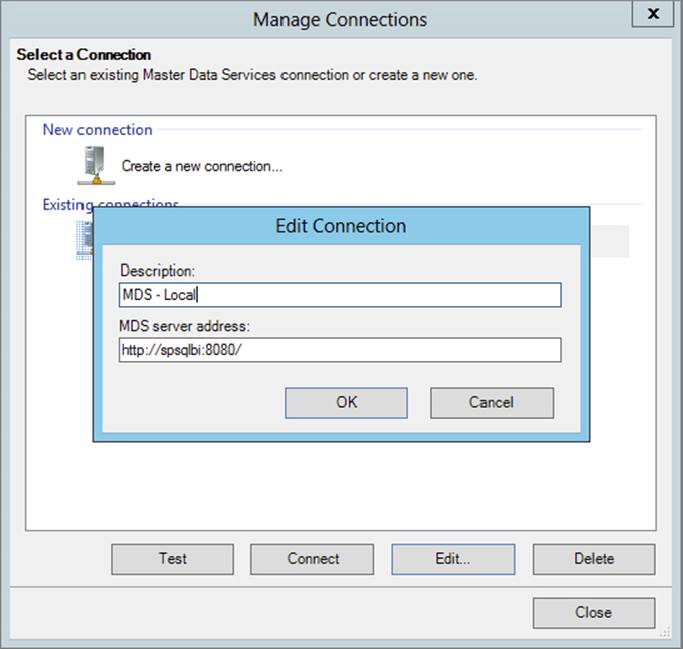
FIGURE 10-33
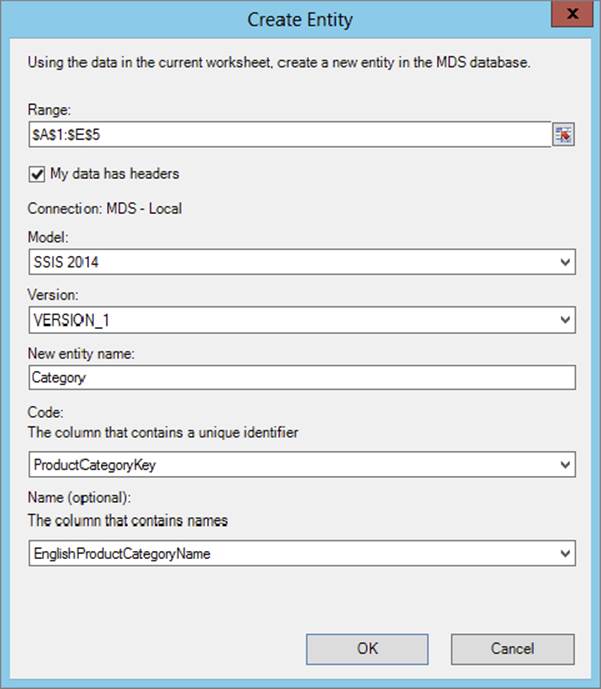
FIGURE 10-34
Any changes that are made through MDS remain in the MDS database. However, when you’re ready to push these changes back to the destination database you can create a simple MDS view through the Master Data Manger to sync the tables using a T-SQL update statement. You would likely schedule these updates to occur once a day or even more frequently depending on your needs.
Because the heavy lifting with MDS is done by the information worker, there is no direct integration with SSIS. Tables that are updated from MDS views are used with traditional components like the Lookup Transformation to ensure incoming new data fits appropriately into the organization’s master list.
SUMMARY
In this chapter, you looked at various data cleansing features within SSIS — in particular, the Derived Column, the Fuzzy Grouping and Fuzzy Lookup, and the DQS Cleansing Transformation. These can be categorized by basic data cleansing, dirty data matching, and advanced data rules. The Derived Column, as the basic feature, will allow you to do the most common data cleansing tasks — blanks and text parsing. When you go to the next level, you can use the Fuzzy Lookup and Fuzzy Grouping to find values that should match or should be the same, but because of bad data in the source, do not match. When your requirements necessitate advanced rules and domain-based cleansing, the DQS tool with SQL Server provides a thorough platform to handle data quality needs. Outside of SSIS you also explored tools like Master Data Services and Data Quality clients, which make the information worker now part of the data quality solution.
The bottom line: No two data cleansing solutions are exactly the same, but SSIS gives you the flexibility to customize your solution to whatever ETL needs you have.
All materials on the site are licensed Creative Commons Attribution-Sharealike 3.0 Unported CC BY-SA 3.0 & GNU Free Documentation License (GFDL)
If you are the copyright holder of any material contained on our site and intend to remove it, please contact our site administrator for approval.
© 2016-2026 All site design rights belong to S.Y.A.