Total Information Risk Management (2014)
PART 2 Total Information Risk Management Process
CHAPTER 7 TIRM Process Stage B
Information Risk Assessment
Abstract
This chapter is a step-by-step guide for implementing the information risk assessment stage of the TIRM process. It demonstrates how to quantify the business impact of poor data and information quality.
Keywords
Information Risk Assessment; Information Risk Identification; Information Risk Analysis; Information Risk Evaluation; Quantifying the Impact of Poor Data and Information
What you will learn in this chapter
![]() How to identify information risks
How to identify information risks
![]() How to analyze and quantify information risks
How to analyze and quantify information risks
![]() How to evaluate and rank information risks
How to evaluate and rank information risks
Introduction
Motivation and goals for stage B
In many management seminars and lectures, it is taught that you can’t manage what you can’t measure. Information risk assessment measures information risk and is therefore at the heart of the TIRM process.
The goal of this stage is to conduct a thorough identification, analysis, and evaluation of information risks; this is crucial if you are to effectively manage information risks.
Information risk identification is important; you have to understand how and where information risks occur. This identification process addresses the following questions:
![]() Which information is critical for my business processes?
Which information is critical for my business processes?
![]() Which information quality problems affect my organizational performance?
Which information quality problems affect my organizational performance?
Information risk analysis is important in gaining an understanding of the likelihood and impact of these information risks. The analysis deals with the questions:
![]() What is the likelihood of each consequence of an information quality problem?
What is the likelihood of each consequence of an information quality problem?
![]() How much does it affect my organizational performance?
How much does it affect my organizational performance?
Finally, information risk evaluation interprets the results into something that is truly meaningful. It focuses on answering the questions:
![]() So, what does it mean for my organization?
So, what does it mean for my organization?
![]() How damaging are the identified information risks for my organization?
How damaging are the identified information risks for my organization?
![]() Do I need to take action?
Do I need to take action?
Overview of stage B
The goal of this stage is to identify, assess, and evaluate information risks in the scope previously agreed on in step A1; this is undertaken by following the nine steps shown in Figure 7.1. Steps B1 to B4 identify information risks by analyzing the tasks executed in business processes, the data and information assets needed for those tasks, and the information quality problems during task execution. Then, the identified information risks are analyzed in steps B5 to B8 to gauge the probability of occurrence of consequences and the impact on business objectives. In step B9, information risks are evaluated against the identified risk criteria from step A4 to judge how significant they are for the organization and to compare different information risks with each other. This helps set the priorities for information risk treatment.
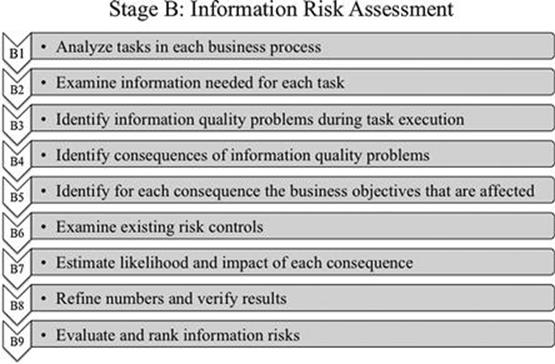
FIGURE 7.1 Nine steps to assessing information risk.
Output of this stage
The final output of this stage is a list of evaluated information risks. To measure information risks, it is essential to establish an understanding of:
![]() Analyzed tasks of selected business processes
Analyzed tasks of selected business processes
![]() Information needed for those tasks
Information needed for those tasks
![]() Information quality problems when executing tasks
Information quality problems when executing tasks
![]() The consequences of the information quality problems
The consequences of the information quality problems
![]() The impact of these consequences on business objectives
The impact of these consequences on business objectives
Information risks should be quantified, where possible, and verified by additional subject-matter experts. Eventually, information risks have to be evaluated regarding the information risk criteria set in stage A and a ranking of information risks has to be created that sets the priorities for information risk treatment.
Organizing stage B
For steps B1 to B7, a workshop has to be organized for each business process that was selected in step A1 with one or more business process representatives (who were also chosen in step A1) and the TIRM process facilitator. The business process representatives bring an in-depth understanding of the business process that is examined, whereas the TIRM process facilitator brings the procedural knowledge on how to identify and analyze information risks. For step B8, a workshop with additional subject-matter experts should be organized for each business process in the scope. Finally, an information risk evaluation workshop is required for step B9 with the TIRM process manager, process sponsor, and process facilitators. Additionally, selected important stakeholders should also participate because they will need to be involved in making the decisions as to which information risks should be treated and in which priority.
![]() IMPORTANT
IMPORTANT
Steps B1 to B7 of the TIRM process, which identify and analyze information risks, have to be conducted separately for each business process.
Step B1: Analyze tasks in each business process
In this step (Figure 7.2), the tasks in each business process in the scope set in A1 are analyzed in preparation for the identification of information quality problems and risks in the business process, following the three activities shown in Figure 7.3.
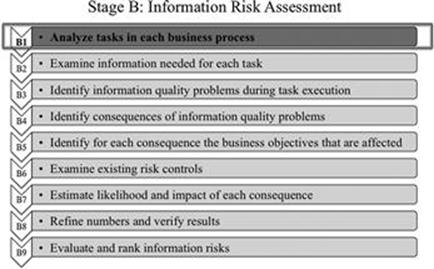
FIGURE 7.2 Step B1 in context.
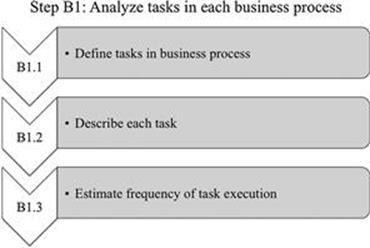
FIGURE 7.3 Activities in step B1.
B1.1 Define tasks in business process
First, it is necessary to identify tasks, which are the key activities in a given business process. In a business process that deals with production planning, tasks can be, for example, drawing up a sales forecast; estimating the required output; determining the required methods, machines, manpower, and materials; and planning the production layout. In a business process that deals with machine maintenance, tasks can be, for example, the development of a maintenance strategy, the creation of maintenance schedules, the execution of the scheduled maintenance, and the requirement to undertake unplanned repairs.
Some tasks are executed automatically or by a single person, whereas other tasks can involve many people from different parts within or outside the organization. Sometimes tasks do not need to be executed by human beings; they can be performed by automated systems that require information input. A key activity in a business process can be monitoring a system that has been designed to intervene if something goes wrong.
It depends on the preferences of the organization at to which level of granularity tasks should be defined. There is no right or wrong here. A higher granularity has the advantage that the information risk model could be less complex at the end. A lower granularity makes it easier for the business process representatives to understand what is being examined. It is recommended that tasks are preferably defined at a high level of granularity to decrease the level of complexity in the analysis, but the tasks should be specific enough to be meaningful to relevant subject-matter experts.
To give an example, a sales forecast might be divisible into monthly and yearly sales forecasts. If these two tasks require completely different data and information assets, or are executed by different departments, or are actually totally different activities, it would make sense to divide the sales forecast task into two separate tasks for monthly and yearly.
![]() IMPORTANT
IMPORTANT
The preferences of the organization will dictate the level of granularity on which tasks should be defined.
![]() EXAMPLE: TIRM PROCESS APPLIED AT A CALL CENTER
EXAMPLE: TIRM PROCESS APPLIED AT A CALL CENTER
In the call center, one of the business processes in the scope is the customer inquiry response process, which consists of three tasks: identify customer, resolve problem, and collect customer feedback.
B1.2 Describe each task
Each task should be described in detail—there are four reasons why this should be done:
1. Executives and managers from other organizational functions who do not know the specifics of a business process should be able to read and understand the results from the information risk assessment.
2. It makes the tasks easily identifiable for other subject-matter experts. Everyone should clearly understand which task is being referred to, independent of the title of the task, which can be ambiguous.
3. It makes the communication with the process facilitator easier and avoids confusion.
4. And finally, even for the subject-matter expert, it is better to be very clear as to what the task is about before delving deeper into the analysis of information requirements.
So, how can we describe a task? It can be done simply by asking questions that start with what, why, who, where, and when, for example:
![]() What is done (and in what sequence)?
What is done (and in what sequence)?
![]() Why is it done (what is the goal of the task)?
Why is it done (what is the goal of the task)?
![]() Who executes/is responsible for/participates in the task?
Who executes/is responsible for/participates in the task?
![]() Where is the task executed?
Where is the task executed?
![]() When is the task executed?
When is the task executed?
![]() EXAMPLE: TIRM PROCESS APPLIED AT A CALL CENTER
EXAMPLE: TIRM PROCESS APPLIED AT A CALL CENTER
This is an example of a description for the task identify customer:
![]() What is done (and in what sequence)? When a customer telephones the call center, the customer needs to be identified. The customer is asked for his or her name and address.
What is done (and in what sequence)? When a customer telephones the call center, the customer needs to be identified. The customer is asked for his or her name and address.
![]() Why is it done (what is the goal of the task)? The query needs to be linked to a customer record, so that the system can provide the appropriate support that enables the query to be resolved and other call center agents know what took place when the customer made contact.
Why is it done (what is the goal of the task)? The query needs to be linked to a customer record, so that the system can provide the appropriate support that enables the query to be resolved and other call center agents know what took place when the customer made contact.
![]() Who executes/is responsible for/participates in the task? The call center agent is responsible for the task. The participants are the customer and the call center agent.
Who executes/is responsible for/participates in the task? The call center agent is responsible for the task. The participants are the customer and the call center agent.
![]() Where is the task executed? The task is executed in the call center, on the telephone with the customer and by using the CRM system visible on the computer screen to identify the customer.
Where is the task executed? The task is executed in the call center, on the telephone with the customer and by using the CRM system visible on the computer screen to identify the customer.
![]() When is the task executed? Every time a customer calls with an inquiry.
When is the task executed? Every time a customer calls with an inquiry.
B1.3 Estimate frequency of task execution
To enable the quantification of information risk, the absolute frequency of task execution for each task should be estimated in a defined timeframe (e.g., per day, per month, per year, etc.); this estimation uses as its basis, the business process representatives’ previous experiences.
![]() EXAMPLE: TIRM PROCESS APPLIED AT A CALL CENTER
EXAMPLE: TIRM PROCESS APPLIED AT A CALL CENTER
Each of these tasks always has to be executed when there is a customer inquiry (Figure 7.4). There are, on average, 430,000 customer inquiries per year, therefore, this is also the yearly frequency of task execution for all three tasks.
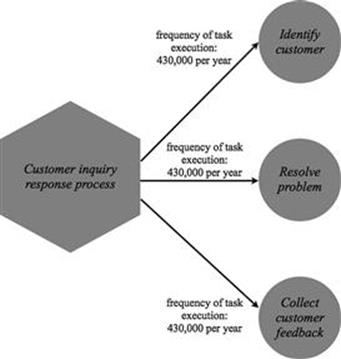
FIGURE 7.4 Example of tasks executed as part of a business process.
Step B2: Examine information needed for each task
In this step (Figure 7.5), for each task, data and information assets that are needed for the task are identified, described, and existing data and information assets are entered into a registry of data and information assets (Figure 7.6). Moreover, the likelihood that a data and information asset is needed for a task has to be estimated.
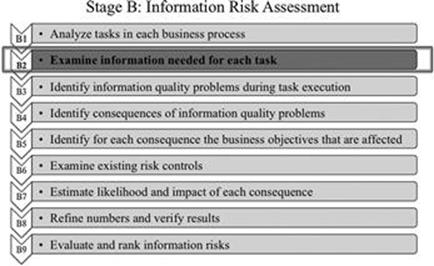
FIGURE 7.5 Step B2 in context.
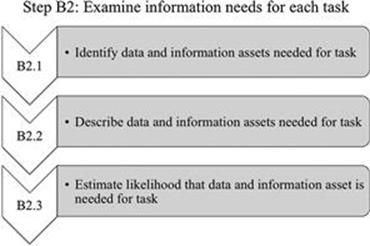
FIGURE 7.6 Activities in step B2.
B2.1 Identify data and information assets needed for task
This activity requires you to identify data and information assets that are required, or provide value for each task of a business process in the scope.
A data and information asset can be provided by a computer system—for example, CRM, ERP, or business intelligence (BI). The asset can also be stored and accessed as a file or document on the computer, such as a text document, presentation, or spreadsheet. Moreover, a data and information asset can be a physical document, such as, a hardcopy of a book, a form, a letter, a magazine, etc. Many data and information assets are typically accessed as a web page. Information assets are also shared via mail and email or through personal communication, face to face, and via telephone. Information can also be obtained through observation. When a machine is broken, often a first step for an engineer is to take a look at it. If the production is not efficient, undertaking a tour of the production hall and carefully observing the production processes can sometimes generate information about what is wrong.
Should only data and information assets be considered if they are actually used for tasks? If so, this would miss out on some important information quality issues. Often, data and information assets are not used for a task, because of their poor quality or because they are not available when needed, although they would be of significant value for the success of the task. Imagine this situation: You are interested in buying a new TV and you have already selected a particular model that you wish to purchase. Knowing the prices in each store would certainly be highly useful information in this situation. There are websites where you can compare prices without much effort. But, what could happen if you knew that the information on price-comparison websites is actually inaccurate? You might use this information with the risk that you might end up paying a higher price. Or you could go to the websites of each retailer separately, which would take some time to find the model and price. If you had previous poor experiences with the accuracy of the price-comparison information, you could also decide not to use this information at all. Instead, you might check the price in a number of selected stores that you know and then make the purchasing decision. Yet, not using data and information assets although they are needed can create risks, as having information of poor quality would frequently lead to a better decision or performance of the task. It is, therefore, important to remember that data and information assets do not have to actually be used to be considered.
![]() IMPORTANT
IMPORTANT
Data and information assets that would be of great value for a task are sometimes not available in an organization. They have to be included in the analysis since there might be a business case for an investment to make these data and information assets available.
Depending on the task, there can be hundreds or even thousands of different data and information assets that could potentially be useful for a task. But which data and information assets should really be included in the information risk analysis? In general, data and information assets should be only included when they are considered significant for the task by the business process representatives, which means that the use, or not use, of the information significantly influences the success of the task execution. The threshold to consider a data and information asset significant enough to be included depends on the amount of time you have available for the information risk assessment phase, as well as the opinions of the business process representatives. It is advisable to focus on the data and information assets most important for a task. Some data and information assets might not be considered at all as they are out of the process scope.
![]() ACTION TIP
ACTION TIP
Try to think outside the box when you decide which information should be included in the analysis. Talking to business users and brainstorming with them can help.
![]() ACTION TIP
ACTION TIP
Focus on the data and information assets that are the most important for the business process.
![]() EXAMPLE: TIRM PROCESS APPLIED AT A CALL CENTER
EXAMPLE: TIRM PROCESS APPLIED AT A CALL CENTER
For each task, the business process representatives for the customer inquiry response process are asked to identify exactly which data and information assets are needed to execute the task. For customer identification purposes, customer relationship information is needed, which comes from the CRM system and the ITS, and is automatically shown on the screen by the CTI. For resolving a customer problem, information about previous solutions is needed, which is accessed using the ITS; this connects the customer issue automatically with suggestions from the KBS. If the information is insufficient, advanced expertise is required from a subject-matter expert who needs to be identified using the KBS and contacted by the call center agent. Finally, for analyzing customer feedback, customer relationship information is also needed together with the data on customer feedback that is collected by the Computer Telephony Integration System (CTIS).
B2.2 Describe data and information assets needed for task
Each data and information asset should be described, in particular:
![]() Does the data and information asset exist in the organization?
Does the data and information asset exist in the organization?
![]() What is the type of data and information asset?
What is the type of data and information asset?
![]() Why is it important for the task?
Why is it important for the task?
![]() How can the information be accessed during task execution?
How can the information be accessed during task execution?
Moreover, if the data and information asset already exists in the organization, it should be included in a register of data and information assets, and if it is already in the register, the register should be updated. Therefore, this step creates a database with the data and information assets that you have identified. This can be done with a spreadsheet or with more sophisticated tools if required. It should capture the following items for each existing data and information asset:
![]() Create a unique ID: Each data and information asset should have a unique value that functions as an identifier. This makes sure which data and information asset is exactly meant and gives the relevant context to it.
Create a unique ID: Each data and information asset should have a unique value that functions as an identifier. This makes sure which data and information asset is exactly meant and gives the relevant context to it.
![]() Data and information asset title: The title of the data and information asset should be a short textual description. If you are referring to a data and information asset that is describing the preferences of your hundred most important customers, a catchy title could be, for example, “Top 100 customer preferences.”
Data and information asset title: The title of the data and information asset should be a short textual description. If you are referring to a data and information asset that is describing the preferences of your hundred most important customers, a catchy title could be, for example, “Top 100 customer preferences.”
![]() Description of the content of the data and information asset: A textual description that gives details about the content of the data and information asset is also required. It should describe, semantically, what the data and information asset is about, abstracted from its physical representation. For instance, a number field that is labeled “year” in a database is actually the physical representation of the year in which the product was introduced into the product catalog.
Description of the content of the data and information asset: A textual description that gives details about the content of the data and information asset is also required. It should describe, semantically, what the data and information asset is about, abstracted from its physical representation. For instance, a number field that is labeled “year” in a database is actually the physical representation of the year in which the product was introduced into the product catalog.
![]() Description of how the data and information asset is captured and processed: Describe how the data and information asset is created. In the case of data, there are applications that capture, process, or use the data (if information is saved as data).
Description of how the data and information asset is captured and processed: Describe how the data and information asset is created. In the case of data, there are applications that capture, process, or use the data (if information is saved as data).
![]() Description of the storage of the data and information asset: It is necessary to describe the format and place in which the data and information asset is stored. If the data and information asset is saved as data, a reference to the appropriate data fields and tables within the database is required. Documents require either a physical location (in case of hardcopy documents) or an electronic location (in case of electronic files).
Description of the storage of the data and information asset: It is necessary to describe the format and place in which the data and information asset is stored. If the data and information asset is saved as data, a reference to the appropriate data fields and tables within the database is required. Documents require either a physical location (in case of hardcopy documents) or an electronic location (in case of electronic files).
![]() Description of the way in which the data and information asset is accessed: It is necessary to describe the different options available to access the data and information asset. This can be, for example, using a particular desktop or Internet software application to extract data directly from the database or a data warehouse. Information can also be accessed by communicating with other people via email, telephone, or face to face, or by accessing hardcopy documents.
Description of the way in which the data and information asset is accessed: It is necessary to describe the different options available to access the data and information asset. This can be, for example, using a particular desktop or Internet software application to extract data directly from the database or a data warehouse. Information can also be accessed by communicating with other people via email, telephone, or face to face, or by accessing hardcopy documents.
![]() Description of how the data and information asset is maintained and deleted: This describes how information is kept up to date, modified, and deleted when required, and who is responsible for taking care of these activities.
Description of how the data and information asset is maintained and deleted: This describes how information is kept up to date, modified, and deleted when required, and who is responsible for taking care of these activities.
![]() People and business divisions that use this data and information asset: This describes who uses the information and for which purpose. This field is built up incrementally. It is updated each time a task in the scope of the TIRM process requires this data and information asset.
People and business divisions that use this data and information asset: This describes who uses the information and for which purpose. This field is built up incrementally. It is updated each time a task in the scope of the TIRM process requires this data and information asset.
![]() Business processes that use this data and information asset: This aims to describe which business processes the data and information asset is used in. This field is built up incrementally. It is updated each time a new business process in the scope of the TIRM process requires this data and information asset.
Business processes that use this data and information asset: This aims to describe which business processes the data and information asset is used in. This field is built up incrementally. It is updated each time a new business process in the scope of the TIRM process requires this data and information asset.
![]() Degree of importance of data and information asset for this particular task: This is used to rate how important the information is for the organization on a five-step scale from very low, low, medium, high, to very high. To complete the grade of importance it is necessary to also give a textual reasoning for the rating.
Degree of importance of data and information asset for this particular task: This is used to rate how important the information is for the organization on a five-step scale from very low, low, medium, high, to very high. To complete the grade of importance it is necessary to also give a textual reasoning for the rating.
![]() Degree of volatility: This aims to store a rate of the degree of volatility of the data and information asset on a five-step scale from very low, low, medium, high, to very high, which is the speed at which the information is changing. Give a textual reasoning for the rating.
Degree of volatility: This aims to store a rate of the degree of volatility of the data and information asset on a five-step scale from very low, low, medium, high, to very high, which is the speed at which the information is changing. Give a textual reasoning for the rating.
![]() Identification of alternative data and information assets: This is used to document if there are any other data and information assets that can be used as substitutes for the main one.
Identification of alternative data and information assets: This is used to document if there are any other data and information assets that can be used as substitutes for the main one.
![]() List of complementary data and information assets: This is used to document if there are other complementary data and information assets that have to be used.
List of complementary data and information assets: This is used to document if there are other complementary data and information assets that have to be used.
![]() EXAMPLE: TIRM PROCESS APPLIED AT A CALL CENTER
EXAMPLE: TIRM PROCESS APPLIED AT A CALL CENTER
The TIRM process facilitator together with the business process representatives describes each data and information asset. An example is as follows:
![]() Create a unique ID: DIA.B.1.
Create a unique ID: DIA.B.1.
![]() Data and information asset title: “Customer relationship information.”
Data and information asset title: “Customer relationship information.”
![]() Description of the content of the data and information asset: This contains details about the customer, such as name, address, and date of birth, as well as details about the interaction history with the customer, including past issues raised by the customer and how they were resolved.
Description of the content of the data and information asset: This contains details about the customer, such as name, address, and date of birth, as well as details about the interaction history with the customer, including past issues raised by the customer and how they were resolved.
![]() Description of how data and information asset is captured, processed, stored, maintained, and deleted: See Chapter 6, substeps A5.1 and A5.2. Data is stored in the customer master and customer interaction databases. Data in the customer master database is initially obtained from the client company and then updated by the call center agents. Customer data has to be deleted when a client company decides to stop using the services of the call center. Data in the customer interaction database is automatically recorded during interactions with end customers. Issues raised by customers are entered by the call center agents into the system. The data comes from the ITS and the CTI system.
Description of how data and information asset is captured, processed, stored, maintained, and deleted: See Chapter 6, substeps A5.1 and A5.2. Data is stored in the customer master and customer interaction databases. Data in the customer master database is initially obtained from the client company and then updated by the call center agents. Customer data has to be deleted when a client company decides to stop using the services of the call center. Data in the customer interaction database is automatically recorded during interactions with end customers. Issues raised by customers are entered by the call center agents into the system. The data comes from the ITS and the CTI system.
![]() Description of the way in which the data and information asset is accessed: It is accessed using the CTIS, which integrates the ITS and CRM system into the user interface.
Description of the way in which the data and information asset is accessed: It is accessed using the CTIS, which integrates the ITS and CRM system into the user interface.
![]() People and business divisions that use this data and information asset: Call center agents use this information.
People and business divisions that use this data and information asset: Call center agents use this information.
![]() Business processes that use this data and information asset: The customer inquiry response process uses customer relationship information.
Business processes that use this data and information asset: The customer inquiry response process uses customer relationship information.
![]() Degree of importance of data and information asset for this task: This is very high since the customer cannot be identified without this information.
Degree of importance of data and information asset for this task: This is very high since the customer cannot be identified without this information.
![]() Degree of volatility: This is medium since the customer master data does not change often, whereas issues reported by the customer are more volatile.
Degree of volatility: This is medium since the customer master data does not change often, whereas issues reported by the customer are more volatile.
![]() Identification of alternative data and information assets: There are no real alternative options that can be used instead.
Identification of alternative data and information assets: There are no real alternative options that can be used instead.
![]() List of complementary data and information assets: Data from the customer master and customer interaction databases are complementary, therefore, it is summarized as one data and information asset.
List of complementary data and information assets: Data from the customer master and customer interaction databases are complementary, therefore, it is summarized as one data and information asset.
B2.3 Estimate likelihood that data and information asset is needed for task
To be able to calculate the total risk at a later stage, the likelihood that the data and information asset is needed for the task has to be estimated. If a data and information asset is not needed, the probability is zero per definition. The numbers can be given in the same form as in step B1 of an exact value, a range, or as a three-parameters estimate.
![]() EXAMPLE: TIRM PROCESS APPLIED AT A CALL CENTER
EXAMPLE: TIRM PROCESS APPLIED AT A CALL CENTER
Figure 7.7 shows the four data and information assets that are needed in the customer inquiry response process and the likelihood that they are needed for the tasks. The data and information asset customer relationship information is needed with a likelihood of 90% when the identify customer task is executed. The customer relationship information is always required, while the data and information asset of previous solutions is needed 50% of the time for the resolve problem task. The data and information asset of advanced expertise hotline is also needed for the resolve problem task, but only in 5% of cases. Finally, customer feedback information is always used (100%) for the analyze customer feedback task, while customer relationship information is needed only in 45% of cases when this task is executed.
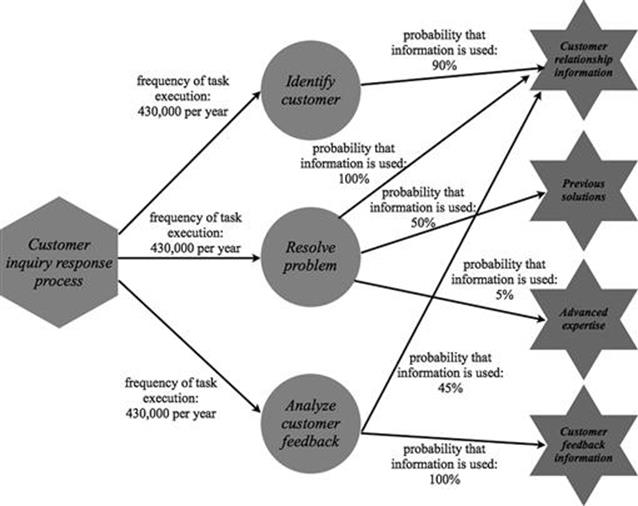
FIGURE 7.7 Example of data and information assets used for tasks.
Step B3: Identify information quality problems during task execution
In this step (Figure 7.8), the quality of data and information assets needed for the task is evaluated. Additionally, potential information quality problems are identified and described and their likelihood of appearance is estimated (Figure 7.9).
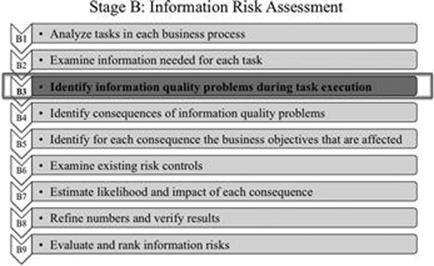
FIGURE 7.8 Step B3 in context.
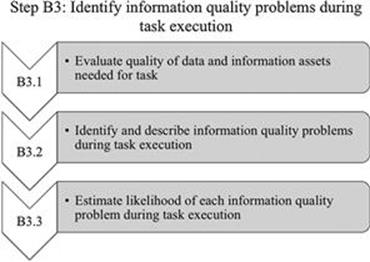
FIGURE 7.9 Activities in step B3.
B3.1 Evaluate quality of data and information assets needed for task
In the first step, each data and information asset that is required for a task should be evaluated from an information user’s perspective by the business process representatives. Information quality is evaluated along the chosen dimensions in A1.3 to get a general impression of the information users’ perceptions (Table 7.1). A five-level scale—very low, low, medium, high, or very high—can be used that indicates how fit for use a data and information asset is.
Table 7.1
Standard Set of Information Quality Dimensions for TIRM
|
Information Quality Dimension |
Description |
|
Accuracy |
Is the data and information asset correct? Does it correspond to the real value that it represents? |
|
Completeness |
Is the data and information asset complete? Does it contain all the information it should contain? |
|
Consistency |
Is the information stored in a consistent format? |
|
Up to date |
Has information changed since the last time it has been updated in a way that it is incorrect now? |
|
Interpretability |
Is the content of the data and information asset easily interpretable by the users? Is it represented in a way that is easy to understand? |
|
Accessibility |
Can I access the data and information asset in a timely manner? |
|
Availability |
Is the information that I need available in my organization? |
|
Security |
Can somebody else access the information who should not be able to access it? How likely is it that the information gets lost? |
So what does this rating mean? It illustrates the perceptions of the business process representatives of the fitness for use of each data and information asset. The dimensions help to capture the different aspects of quality as required by the corresponding users. There is, of course, the possibility of adding more information quality dimensions during this step, if it emerges that there are aspects of information quality that are not covered by the selected information quality dimensions.
The evaluation should take into account the known information management and information quality issues that were identified in substep A5.3 by interviewing information managers and using data quality software tools. Software tools that are intended to measure data and information quality usually measure some characteristics of the data stored in databases (see Chapter 12), which can be symptoms of poor data and information quality. The examples in the following box demonstrate that some data defects can lead to varying levels of quality of the data and information asset depending on the task for which it is used. So, only by asking the information users can you really find out if a data and information asset is of high enough quality for a task.
![]() ATTENTION
ATTENTION
If half of the values of data fields are null, which means they are empty, this will probably have an effect on the fitness for use of that information for the many tasks that use this data and information asset. Similarly, if, for example, customer addresses are incorrect in the database, it will also affect the many tasks that use this information. However, some other tasks might not be affected at all. In the case of goods being sent to customers, spelling errors in the address, if not significant, do still lead to the goods being delivered to the right address. Yet, if an address has changed (i.e., is not up to date), it will prevent the goods from being delivered to the right address.
But, there might be instances where it is the other way around. Imagine you are running a sales campaign. The addresses of your customers might be an indication of where your future customers are concentrated, which enables you to send out your salespeople to the most promising geographical areas. An out-of-date address is still valid for this purpose, because it tells you where customers lived when they bought the product. Addresses with spelling errors, especially in the post code, might lead to an inaccurate analysis, which will compromise the task even more.
It should be emphasized that all this does not reduce the value of data profiling software and other data quality software tools. Knowing the data defects can often help identify information quality problems and prompt business process representatives to identify problems that they might not have been consciously aware of.
Having a good understanding of what high quality of a data and information asset in the light of each task means is something that can be very valuable for an organization. It tells the information managers how they should interpret the results of data quality software tools in the future and sets the requirements for data management. It also tells them which data defects they should put a special focus on in the future.
![]() EXAMPLE: TIRM PROCESS APPLIED AT A CALL CENTER
EXAMPLE: TIRM PROCESS APPLIED AT A CALL CENTER
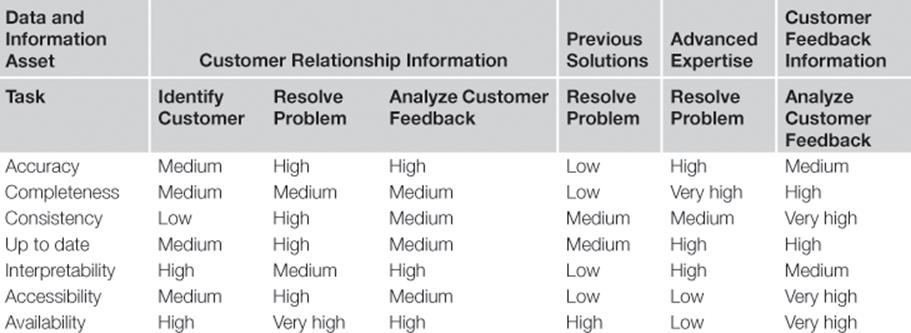
For each task, business process representatives and information users evaluate the quality of each data and information asset; this takes into account general information management and information quality issues identified in substep A5.3. The results are shown in Table 7.2. For example, the data profiling results revealed that data about previous solutions in the KBS is often incomplete, and contains many invalid or incorrect values. This is now confirmed by the users of the information. As noted before, the quality of the same data and information asset might be high enough for one task, but low for another task. Each rating that is below high is described in more detail, for instance, medium accuracy of customer relationship information means that the name and contact details are often misspelled or incorrect, which has also been identified as a general information management issue in substep A5.3.
Table 7.2
Information Quality Assessment from a User’s Perspective
B3.2 Identify and describe information quality problems during task execution
After having obtained an initial impression of the quality level of the data and information asset from the business process representatives, information quality problems are identified. An information quality problem arises when a data and information asset is not fit for the specific purpose of a task and this potentially influences the outcome of the task. Again, this is something that requires the judgment of the business process representatives who should have a good understanding of when a task can be significantly affected by poor information quality. If the level of information quality for a given set of dimensions was rated medium or lower, the business process representatives are asked to point out any resulting information quality problems. But, even if information quality is high or very high, the business process representatives should be asked if they are sure that there are no information quality problems resulting from poor information quality in some specific cases.
Each information quality problem should be described in more detail to make sure that other users can refer to the right information quality problem. Such a description should contain the defect that makes the data and information asset not fit for use (e.g., material codes used in production are inconsistent), but also how the task is potentially affected by this defect (e.g., the task of finding the materials that have the highest consumption rates in the production can lead to an incorrect analysis when it is based on inconsistent material codes). It should be explained under what circumstances the information quality problem can appear. Each information quality problem should be given a short title and be clearly linked to a particular data and information asset and specific task.
![]() EXAMPLE: TIRM PROCESS APPLIED AT A CALL CENTER
EXAMPLE: TIRM PROCESS APPLIED AT A CALL CENTER
The TIRM process facilitator helps the business process representatives and information users identify a number of information quality problems that appear during the execution of each of the tasks.
An example is presented for the resolve problem task. The data and information asset of previous solutions is stored information about how previous customer inquiries have been resolved. However, it is sometimes hard to find the right record in the database, as there are hundreds of thousands of records of previous solutions. Searching for the right record requires a problem description of the current customer inquiry using a few keywords that are matched against words in the title of the problem description of previous customer inquiries. If, however, keywords are used that are not contained in the title (e.g., when synonyms are used), the record will not be found—this is an information quality problem called finding the solution is difficult.
Another information quality problem with the data and information asset of previous solutions is that even once the right record is found in the database, it is often incomplete, called solution description incomplete.
The data and information asset of advanced expertise, which is only sometimes required for the resolve problem task, suffers from the information quality problem that experts are not available, which means that a subject-matter expert who has the advanced knowledge on the customer issue is not directly available when needed.
B3.3 Estimate likelihood of each information quality problem during task execution
Moreover, the likelihood that an information quality problem appears when information is used has to be estimated by the business process representatives. This can be done in the same way as in steps B1 and B2. For example, in 5% of cases, when the material codes are used for finding the materials that have the highest consumption rates in the production, the information is not fit for use for the task.
![]() EXAMPLE: TIRM PROCESS APPLIED AT A CALL CENTER
EXAMPLE: TIRM PROCESS APPLIED AT A CALL CENTER
The information quality problems have been identified and now the business process representatives and information users estimate the likelihood of each problem.
Figure 7.10 shows, once again, the example of information quality problems appearing during execution of the resolve problem task.
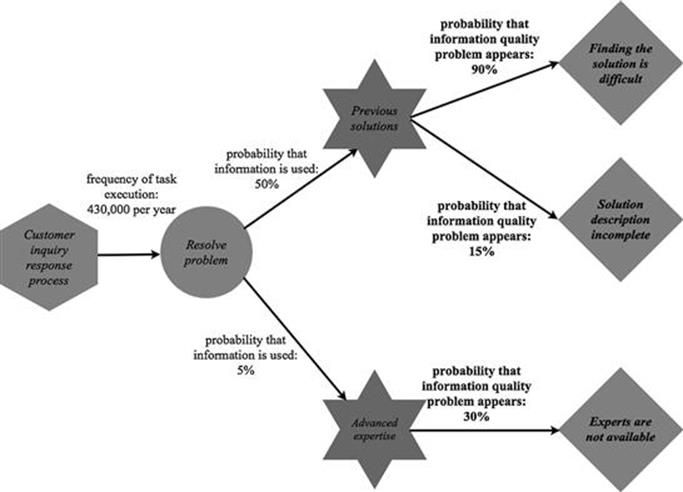
FIGURE 7.10 Example of information quality problems appearing during task execution.
The information quality problem finding the solution is difficult appears in 90% of cases when the information is needed for resolving a problem as part of the customer inquiry response process.
In 15% of cases when the data and information asset previous solutions is used for the resolve problem task, the information quality problem solution description incomplete appears.
Finally, the information quality problem experts are not available means that the required information is not instantaneously available in 30% of cases and, therefore, a delay occurs until an expert becomes available.
Step B4: Identify consequences of information quality problems
In this step (Figure 7.11), the business process representatives identify and describe the direct and intermediate consequences of each information quality problem (Figure 7.12).
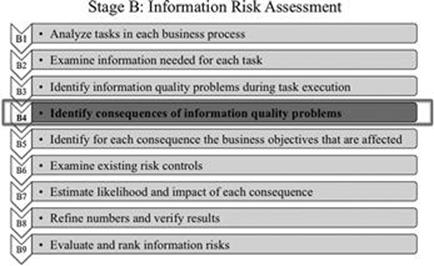
FIGURE 7.11 Step B4 in context.
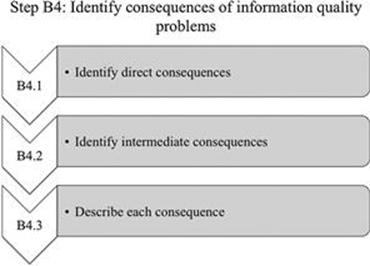
FIGURE 7.12 Activities in step B4.
B4.1 Identify direct consequences
First, the business process representatives identify the direct consequences of each information quality problem.
The direct consequences should be directly related to the task in the business process in which an information quality problem appears. A direct consequence is usually that the task is delayed, it needs more resources for execution, or it is executed poorly, leading to an inferior task outcome. For example, when inconsistent material codes are used for finding the materials that have the highest consumption rates in the production, a direct consequence that can follow is that wrong materials are identified as the main cost drivers. There can be several direct consequences following from an information quality problem. For instance, inconsistent material codes could also lead to more time and resources being spent when executing the task of analyzing the key materials cost drivers, because different material codes that represent the same material need to be unified before the actual task is executed.
B4.2 Identify intermediate consequences
Second, the business process representatives identify the intermediate consequences of each information quality problem.
A direct consequence can lead to several further consequences, which can lead, in theory, to a neverending chain of consequences. All consequences that do not result directly from an information quality problem, but are consequences of another earlier consequence, are called intermediate consequences. Other than the direct consequences, the intermediate consequences can appear in other activities, outside the business process or even beyond the boundaries of the organization. This could be, for instance, the inaccurate analysis of the amount of materials needed, which could lead not only to wrong purchasing decisions, but also to suppliers potentially optimizing their production by using misguiding information. This could lead to price increases and it might ruin a relationship with a supplier and adversely affect future dealings.
B4.3 Describe each consequence
Each consequence should be given a textual description. The circumstances under which the consequence appears should be written down (when does it happen) and the consequence itself needs to be clearly described (what happens). The consequences should be visualized graphically to show how they are interlinked with the information quality problems and with each other, as shown in the example in Figure 7.13.
![]() EXAMPLE: TIRM PROCESS APPLIED AT A CALL CENTER
EXAMPLE: TIRM PROCESS APPLIED AT A CALL CENTER
The information quality problem finding the solution is difficult can lead to two different direct consequences. The first direct consequence is that it takes longer to find a solution if the information quality problem appears during the task. This consequence causes a further intermediate consequence of the response to the customer is delayed. It can also sometimes lead to the consequence of the wrong solution is given to the customer, because, after searching for a while, the service employee settles on a response that does not exactly fit the problem. The second direct consequence is that the solution cannot be found. This can lead to the intermediate consequence that the customer inquiry cannot be resolved.
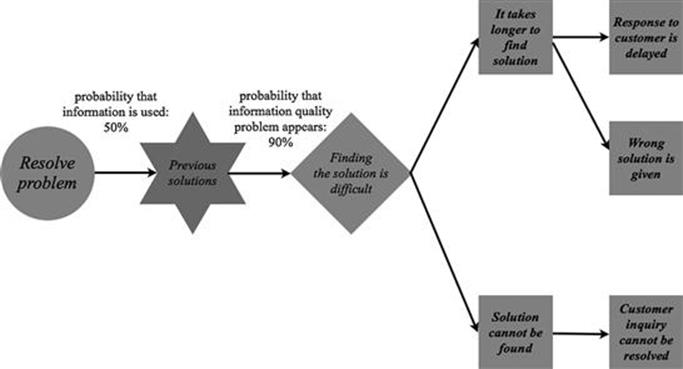
FIGURE 7.13 Example of consequences of information quality problems.
Step B5: Identify for each consequence the business objectives that are affected
Business objectives represent what your organization aims to achieve, no matter whether these are financial or nonfinancial goals (Figure 7.14). Therefore, understanding which of the business objectives are impacted by which consequence will help you to evaluate the overall impact of an information risk on your organization’s goal to achieve its business objectives (Figure 7.15).
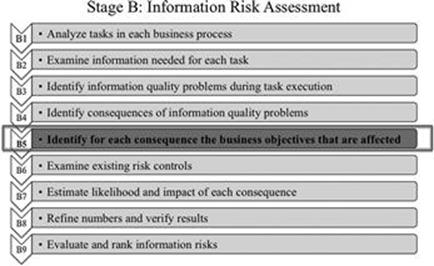
FIGURE 7.14 Step B5 in context.
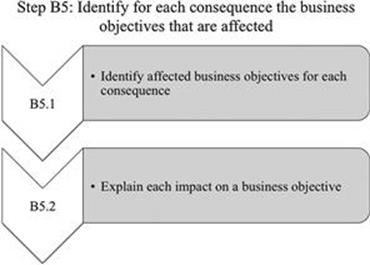
FIGURE 7.15 Activities in step B5.
B5.1 Identify affected business objectives for each consequence
For each consequence, you need to ascertain whether the consequence has a direct impact on one or more business objectives that were identified in substep A4.1.
Each consequence, independent of whether it is a direct or an intermediate consequence, can have an impact on one or more business objectives. So, the procedure is to go through each consequence one by one together with the business process representatives and discuss if the consequence could have an impact on one of the identified business objectives. A description as to how the consequence impacts the business objective is required—for example, the consequence of an ordered product cannot be delivered to the customer will surely impact on the business objective to achieve high customer satisfaction, as the customer cannot receive the product as expected.
But what happens if a consequence only has an impact sometimes, such as if customers are only dissatisfied when the delivery delay is greater than a week? This can be dealt with by adding a further consequence—for example, if an ordered product cannot be delivered to the customer, the consequence of the customer is dissatisfied as delivery delay is greater than a week can sometimes follow. Only the consequence of the customer is dissatisfied as delivery delay is greater than a week has an impact on the business objective to achieve high customer satisfaction.
B5.2 Explain each impact on a business objective
Explaining why and how each consequence has an impact on the business objective has to be documented. For instance, the consequence of the customer is dissatisfied as delivery delay is greater than a week has an impact on the business objective to achieve high customer satisfaction, because previous experience has shown that the average customer does not care too much about a delivery delay of less than one week, but usually gets angry and disappointed if the delivery delay is longer than one week.
![]() EXAMPLE: TIRM PROCESS APPLIED AT A CALL CENTER
EXAMPLE: TIRM PROCESS APPLIED AT A CALL CENTER
Together, the business process representatives and the TIRM process facilitator identify the impact of each of the direct and intermediate consequences of the discovered information quality problem on the business objectives that were defined in substep A4.1.
Figure 7.16 shows the previous example related to the resolve problem task extended to show the impact of consequences on business objectives. The direct consequence that it takes longer to find a solution has an impact on the business objective of operational efficiency, as employees’ time is wasted unnecessarily. The direct consequence of a solution cannot be found has no direct impact on a business objective. All three of the intermediate consequences of the response to the customer is delayed, the wrong solution is given, and the customer inquiry cannot be resolved have an impact on the business objective of customer satisfaction, as the customer is unhappy about the problem not being resolved in a timely fashion, resolved incorrectly, or not resolved at all.
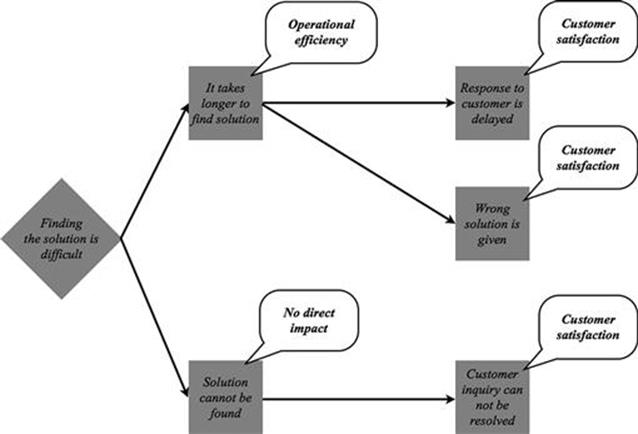
FIGURE 7.16 Example of consequences of impact of consequences on business objectives.
Step B6: Examine existing risk controls
This step (Figure 7.17) examines if there are existing risk controls in place to prevent information quality problems and/or their consequences from occurring. An example of a risk control can be an engineer who reads the opinions of other engineers published on the Internet before he or she uses an asset manual provided by a new supplier, because the asset manual can be unreliable.
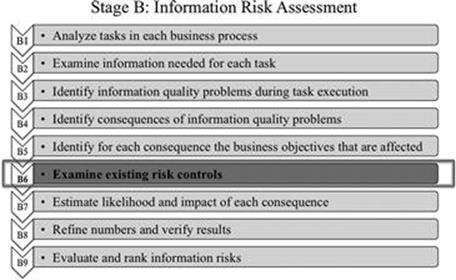
FIGURE 7.17 Step B6 in context.
This is important for step B7, when the likelihood and impact of each consequence are estimated, because you should take into account which risk controls are already in place. Moreover, it is also important for the selection of information risk treatment options in step C2, because choosing new options requires you to know which risk controls have already been implemented and how effective they are.
Also, note that if an existing risk control uses significant resources, the risk control can be checked for effectiveness and cost efficiency by modeling it as a consequence of an information quality problem (e.g., when time is wasted to improve the information). In some cases, risk controls can then be extended or replaced by a new risk control as part of the risk treatment in stage C.
![]() EXAMPLE: TIRM PROCESS APPLIED AT A CALL CENTER
EXAMPLE: TIRM PROCESS APPLIED AT A CALL CENTER
For each business process and task, the existing risk controls for consequences of information quality problems are identified by the business process representatives together with the TIRM facilitator. An example is shown in Figure 7.18. A risk control for the direct consequences of it takes longer to find a solution and a solution cannot be found is that another colleague is asked to help find the solution in the KBS. This means that a second call center agent cannot make telephone calls during this time period. Furthermore, another risk control is that the problem is delegated to a subject-matter expert, because a solution cannot be found that uses the limited capacity of subject-matter experts, whose hourly rate is much higher than that of a call center agent.
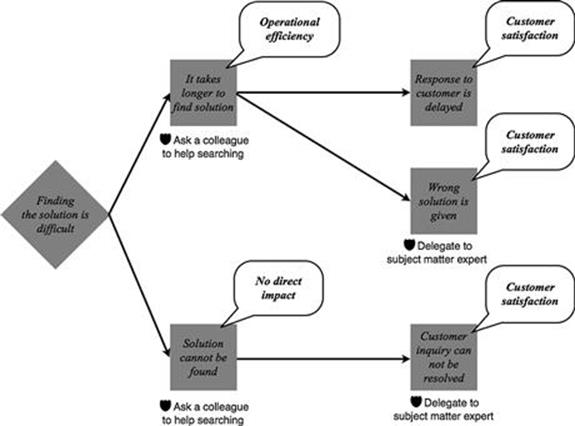
FIGURE 7.18 Example of risk controls.
Step B7: Estimate likelihood and impact of each consequence
In this step (Figure 7.19), for each consequence, a likelihood of occurrence and its corresponding impact are determined by giving due regard to the current risk controls that are in place; these determinations are based on previous experiences, existing data, and expert judgments (Figure 7.20).
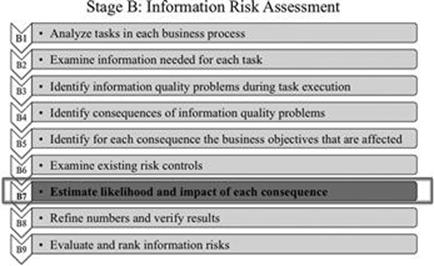
FIGURE 7.19 Step B7 in context.
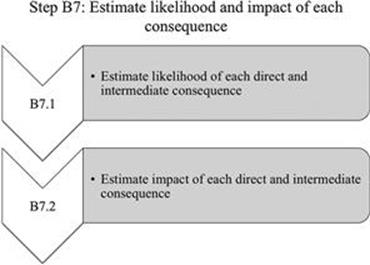
FIGURE 7.20 Activities in step B7.
B7.1 Estimate likelihood of each direct and intermediate consequence
First, the likelihood for each consequence has to be estimated. For a direct consequence, this is the likelihood that, when the information quality problem occurs, the direct consequence follows. For an intermediate consequence, this is the probability that a direct or other intermediate consequence leads to the intermediate consequence.
![]() EXAMPLE: TIRM PROCESS APPLIED AT A CALL CENTER
EXAMPLE: TIRM PROCESS APPLIED AT A CALL CENTER
As in the previous steps, the TIRM process facilitator together with the business process representatives estimate the figures. The example of the resolve problem task is continued (Figure 7.21).
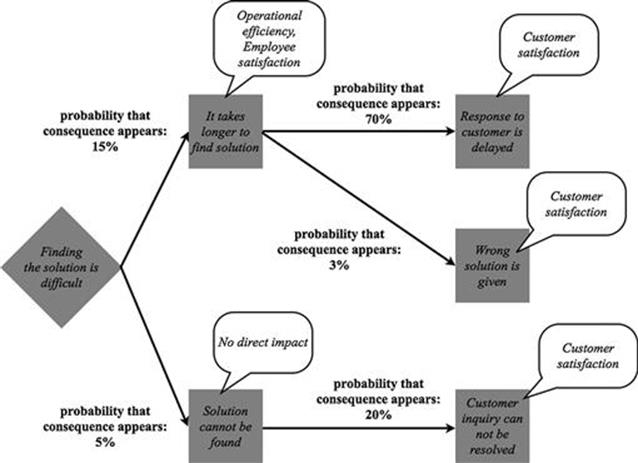
FIGURE 7.21 Example of adding the probability to each consequence.
There is a likelihood of 15% that the information quality problem of finding the solution is difficult leads to the direct consequence that it takes longer to find a solution. The direct consequence of a solution cannot be found follows from this information quality problem with a likelihood of 5%.
Afterwards, the likelihoods of the intermediate consequences have to be estimated. In the example shown, the direct consequence that it takes longer to find a solution leads to the intermediate consequence of a response to the customer is delayed with a likelihood of 70% and to the intermediate consequence that a wrong solution is given with a likelihood of 3%. Furthermore, the direct consequence that a solution cannot be found leads to the intermediate consequence of a customer inquiry cannot be resolved with a likelihood of 20%.
B7.2 Estimate impact of each direct and intermediate consequence
Eventually, when a consequence has an impact on one or more business objectives, the impact has to be estimated in the measurement unit specified for the business objective. If a consequence does not have an impact, for example, on the business objective of health and safety, the value for the impact on this business objective would be zero. Moreover, if the consequence does not have any impact on any of the business objectives, all values in the vector would be zero per the definition.
![]() EXAMPLE: TIRM PROCESS APPLIED AT A CALL CENTER
EXAMPLE: TIRM PROCESS APPLIED AT A CALL CENTER
Figure 7.22 shows the extended example; here, the figures for the impact on business objectives have been added for each of the consequences. The direct consequence that it takes longer to find a solution causes a loss of $20 each time, because the employee’s time is wasted trying to find the right solution in the database. The direct consequence that a solution cannot be found has no direct impact on any business objectives. Moreover, the intermediate consequence of a response to the customer is delayed has an impact of 0.1, the intermediate consequence of the wrong solution is given has an impact of 0.9, and the intermediate consequence that a customer inquiry cannot be resolved has an impact of 0.5 on the business objective of customer satisfaction. This is because a delay of the solution is not as bad than if a customer inquiry cannot be resolved, but it is even worse if an incorrect solution is given to the customer in our example.
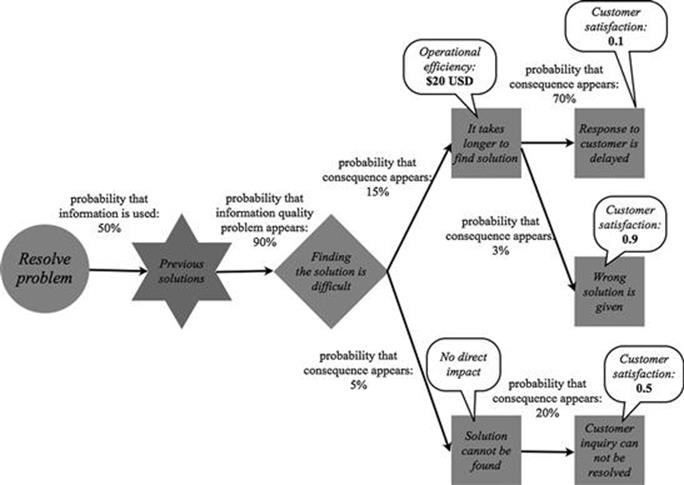
FIGURE 7.22 Example of adding the impact to each consequence.
Step B8: Refine numbers and verify results
For each business process, further subject-matter experts should be chosen to refine the numbers and verify the results from the information risk analysis to reduce any bias in the input (Figure 7.23).
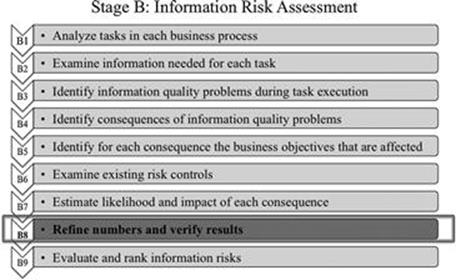
FIGURE 7.23 Step B8 in context.
If possible, historical data should be used to improve the reliability of the data input. Sometimes, it is advisable to collect further data where feasible or execute enhanced data analysis to improve the numerical input.
![]() EXAMPLE: TIRM PROCESS APPLIED AT A CALL CENTER
EXAMPLE: TIRM PROCESS APPLIED AT A CALL CENTER
For step B8, the TIRM process facilitator identifies further subject-matter experts for each of the three business processes in the scope of the TIRM process within the call center, who get a chance to refine the outputs of steps B1 to B7. Some of the numbers are adjusted and some of the consequences are modeled in a slightly refined way. The changes are discussed with the business process representatives who originally provided the inputs.
The previous example is used once again to illustrate how this is done. The tools symbol shows where numbers have been refined in the resolve problem task. The likelihood that the information quality problem of finding the solution is difficult occurs has been estimated too highly at the outset (90%) and is now reduced to 60% after having consulted with a number of call center agents. Moreover, the likelihood that when a solution cannot be found the customer inquiry cannot be resolved is much higher than originally anticipated at 50% rather than 20%. Also, it was discovered that the consequences of a solution cannot be found and the wrong solution is given both impact the business objective of operational efficiency, as they create follow-up costs for operations of $150 and $40 USD per instance. See Figure 7.24.
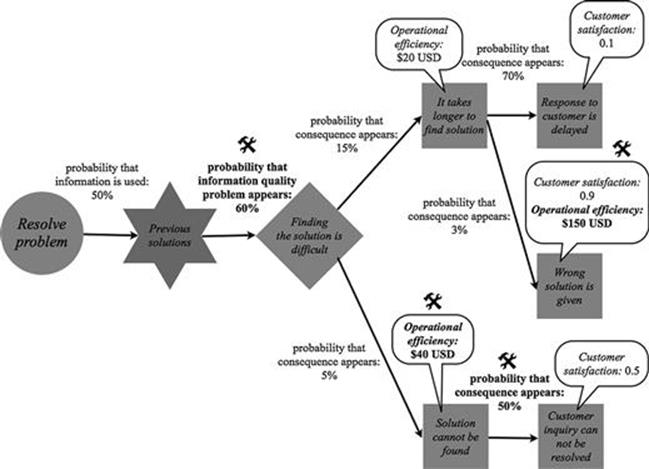
FIGURE 7.24 Refinement of numbers and results.
Step B9: Evaluate and rank information risks
In this step (Figure 7.25), the expected overall impact of each information quality problem is calculated, evaluated, and, finally, information risks are ranked in a list. The activities of this step are shown in Figure 7.26.
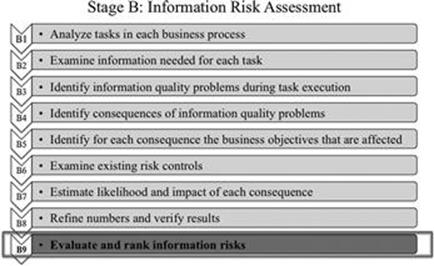
FIGURE 7.25 Step B9 in context.
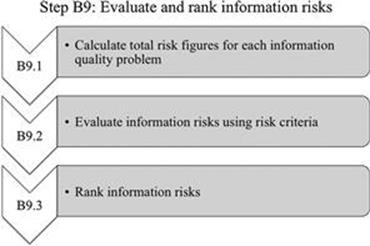
FIGURE 7.26 Activities in step B9.
B9.1 Calculate total risk figures for each information quality problem
This is a list of quantitative estimates that were collected as part of steps B1 to B8:
![]() B1: yearly frequencies of task execution
B1: yearly frequencies of task execution
![]() B2: likelihood that data and information assets are needed for task
B2: likelihood that data and information assets are needed for task
![]() B3: likelihood that the information quality problem appears when information is used for the task
B3: likelihood that the information quality problem appears when information is used for the task
![]() B7: likelihood that consequences appear and impact of each consequence on business objectives
B7: likelihood that consequences appear and impact of each consequence on business objectives
This input can be now used to calculate the total risk caused by an information quality problem.
The expected total risk of an information quality problem can be calculated as the product of the following factors:
The yearly absolute frequency of the information quality problem × the sum of (the likelihood of the direct consequence × the overall impact of the direct consequence) for all direct consequences.
This calculation has to be done separately for each business objective, as each business objective is measured using a different metric. Moreover, it is useful to the decision maker to understand which business objective is affected by how much and by which particular information quality problem. The calculation can be done directly if estimates are in the form of a single number. If ranges or three parameters are given, you need to run a Monte Carlo simulation (see Chapter 11), which is best done with the assistance of an appropriate software tool, such as InfoRAS presented in Chapter 12.
While the likelihood of each direct consequence is available as input collected in step B7, the yearly frequency of the information quality problem must be calculated using equation (A) and the overall impact of a consequence has to be calculated using equation (B).
(A) The yearly absolute frequency of the information quality problem is the product of the following factors:
![]() The yearly frequency of task execution (collected in step B1) ×
The yearly frequency of task execution (collected in step B1) ×
![]() The likelihood that a data and information asset is needed (collected in step B2) ×
The likelihood that a data and information asset is needed (collected in step B2) ×
![]() The likelihood that the information quality problem appears in a task when information is needed (collected in step B3).
The likelihood that the information quality problem appears in a task when information is needed (collected in step B3).
(B) A consequence c causes 1..N further consequences. The overall impact of a consequence c is hence the direct impact of the consequence c on business objectives (collected in step B7) multiplied by the sum for each further consequence n=1..N of the following products:
![]() The likelihood that the further consequence n is caused by consequence c (collected in step B7) multiplied by
The likelihood that the further consequence n is caused by consequence c (collected in step B7) multiplied by
![]() The overall impact of the further consequence n (which needs to be calculated recursively using this equation).
The overall impact of the further consequence n (which needs to be calculated recursively using this equation).
Therefore, it is a recursive calculation, because for calculating the overall impact of a consequence, you need to calculate the overall impact of each of the consequences that are caused by this consequence.
![]() EXAMPLE: TIRM PROCESS APPLIED AT A CALL CENTER
EXAMPLE: TIRM PROCESS APPLIED AT A CALL CENTER
The TIRM process manager now wants to know what the total information risk figures in each of the business processes are. We will use the example of the resolve problem task in the customer inquiry response process to demonstrate how these calculations are made. Figure 7.27 shows the final version of the example model created using the TIRM process.
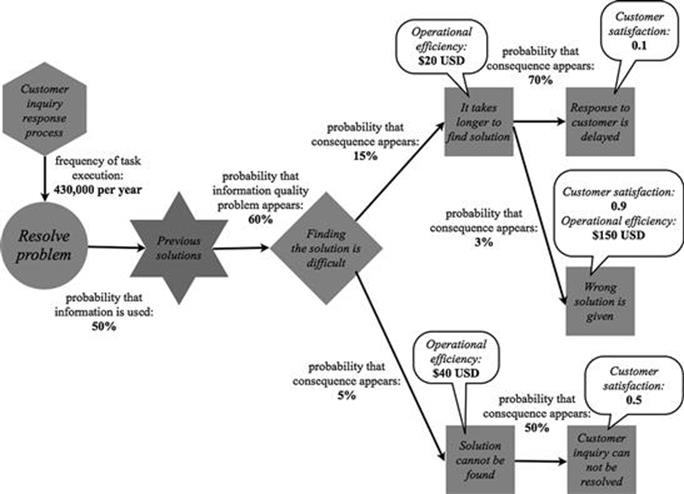
FIGURE 7.27 Final version of example model.
So, the goal is to calculate the total risk of the information quality problem of finding the solution is difficult. There are two business objectives that can be affected in this example: operational efficiency and customer satisfaction. The total risk is a vector of values for these two business objectives.
First, we calculate the yearly absolute frequency of the information quality problem as the product of the following factors:
![]() The yearly frequency of executing the task resolve problem (see step B1): 430,000.
The yearly frequency of executing the task resolve problem (see step B1): 430,000.
![]() The likelihood that the data and information asset of previous solutions is needed for this task (see step B2): 50%.
The likelihood that the data and information asset of previous solutions is needed for this task (see step B2): 50%.
![]() The likelihood that the information quality problem of finding the solution is difficult appears when the data and information asset is needed for the task (see step B3): 60%.
The likelihood that the information quality problem of finding the solution is difficult appears when the data and information asset is needed for the task (see step B3): 60%.
Therefore, the yearly absolute frequency of the information quality problem is:
![]()
Next, we need to calculate the overall impact of each of the direct consequences, for which we need to first know the overall impact of each intermediary consequence. The overall impact of the intermediary consequence that the response to a customer is delayed is ($0, 0.1), as only the business objective of customer satisfaction is affected by this consequence. There are no further consequences caused by this consequence, therefore, the overall impact of this consequence equals its direct impact. Similarly, the overall impact of the wrong solution is given is ($150, 0.9) and of the customer inquiry cannot be resolved is ($0, 0.5).
Using the overall impact of the intermediate consequences, the overall impact of each direct consequence can be now calculated. The overall impact of the direct consequence that it takes longer to find a solution can be calculated as the product of the direct impact of this consequence multiplied by the likelihood of each consequence multiplied by its overall impact:
![]()
This means that each time the consequence that it takes longer to find a solution occurs, the expected impact on operational efficiency is $24.5 USD and that 0.097 customers are dissatisfied (this is, of course, a theoretical value, as there can be either one or zero customers dissatisfied—it only gets meaningful once we aggregate it).
Similarly, the overall impact of the direct consequence that the solution cannot be found is calculated as:
![]()
Now, we can calculate the total expected risk of the information quality problem of finding the solution is difficult in resolve problem task, which is:
The yearly absolute frequency of the information quality problem × the sum of (the likelihood of the direct consequence × the overall impact of the direct consequence) for all direct consequences.
129,000 times per year × (15% × total impact of direct consequence that it takes longer to find a solution + 5% × total impact of direct consequence that the solution cannot be found)

Therefore, the expected yearly impact of the information quality problem of finding the solution is difficult on cost efficiency is roughly $732,000 USD and around 3490 callers who are dissatisfied.
B9.2 Evaluate information risks using risk criteria
Once the annualized cost for the information quality problem has been calculated, the analyzed information risks (an information quality problem that has an impact that corresponds to an information risk) are compared to the risk criteria from substep A4.3.
This is used to evaluate the information risk on a five-level qualitative scale of very low, low, medium, high, or very high. The level of risk is also used to decide if the information risks are tolerable or if they require treatment.
![]() EXAMPLE: TIRM PROCESS APPLIED AT A CALL CENTER
EXAMPLE: TIRM PROCESS APPLIED AT A CALL CENTER
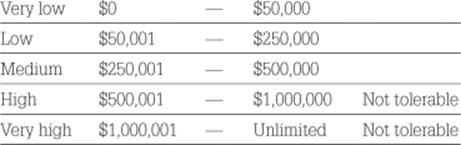
To evaluate information risks, the TIRM process manager compares the expected impact with the risk criteria. As a reminder, these are the risk criteria that were set in substep A4.3.
The following are the risk criteria for the business objective of operational efficiency measured in yearly lost revenue in USD and yearly higher operational costs in USD.
The following are the risk criteria for the business objective of customer satisfaction measured in the number of dissatisfied callers.
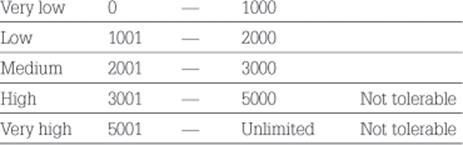
The expected yearly impact of the information quality problem of finding the solution is difficult on cost efficiency is around $732,000 USD and 3490 callers who are dissatisfied. This means that the information risk is evaluated as high regarding both business objectives of operational efficiency and customer satisfaction and therefore the information risks are not tolerable and require treatment.
B9.3 Rank information risks
Information risks can then be ranked, giving due consideration to the total expected risks for each business objective and taking into account the organization’s current priorities. The ranking determines the priorities for the information risk treatment stage.
![]() EXAMPLE: TIRM PROCESS APPLIED AT A CALL CENTER
EXAMPLE: TIRM PROCESS APPLIED AT A CALL CENTER
Once all the other steps have been completed for the three business processes in the scope of the TIRM process at the call center, the TIRM manager creates a ranked list of information risks (Table 7.3). For the call center, customer satisfaction is a slightly higher priority than operational efficiency, since the call center is in a premium segment in which service quality plays a very important role (compare with outputs in steps A2 and A3).
Table 7.3
Ranked List of Information Risks at Call Center
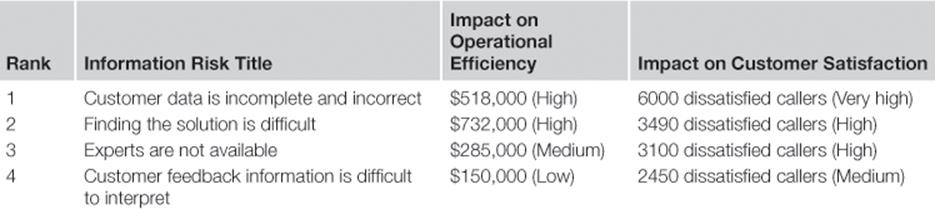
The ranked list of information risks sets the priorities for treating information risks in stage C. Having assessed the information risks in the call center successfully, the TIRM process manager and process sponsor decide that it is now time to move on to the information risk treatment stage of the TIRM process.
Summary
This chapter has provided you with step-by-step guidance on how to identify, analyze, and evaluate information risks. The output of stage B is a ranked list of information risks in all business processes in the scope of the TIRM process, with quantitative values for the expected impact for each of the defined business objectives. The output of stage B will guide the treatment of information risks in stage C, which is explained in Chapter 8.