Network Security Through Data Analysis: Building Situational Awareness (2014)
Part II. Tools
Chapter 9. More Tools
As discussed at the beginning of the book, there are a lot of tools that you will end up using for one or two specific purposes. In this section, I discuss other tools that I find handy for analysis and include a brief explanation about how to use them.
Many of these tools are pretty powerful—far more than in a three-page summary can describe. I will touch on each of these tools very briefly and try to provide an example for each. However, be prepared to look for additional material and supplemental documentation.
Visualization
While R is my primary tool for graph visualization, there are several additional tools that are handy under specific circumstances. Graphviz is toolkit for visualizing graphs. Gnuplot is the utility knife of plotting tools: powerful, scriptable, and profoundly unfriendly.
Graphviz
Graphviz is a graph layout and visualization package. Originally developed by AT&T Labs, the package is now released under the Eclipse license and is actively maintained.
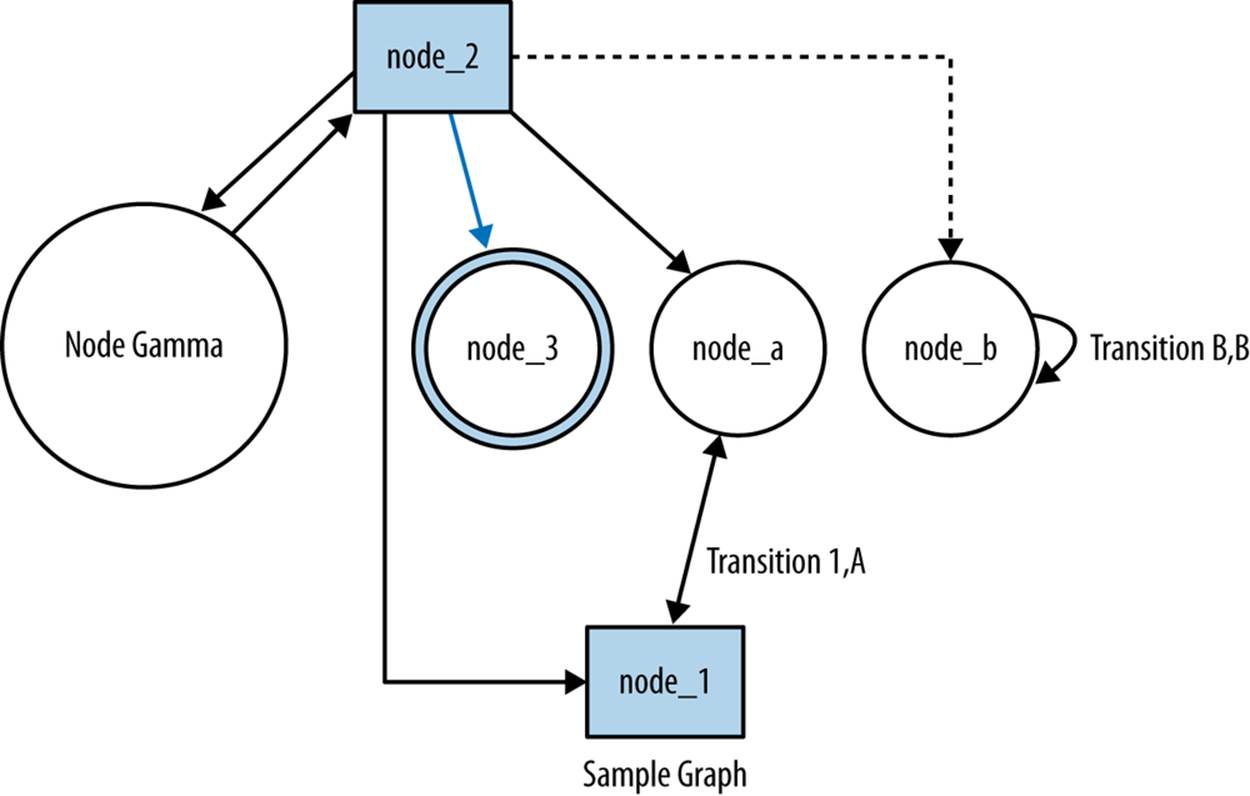
Graphviz is actually a suite of tools, each of which provides a different mechanism for automatically laying out graphs. With each tool, you provide a graph specification, and the tool automatically lays out the graph based on the specification. Graphs are specified via a language called dot, which specifies nodes of various attributes and then links connecting them. An example dot command and output are shown in Example 9-1, with the results illustrated in Figure 9-1.
Example 9-1. A sample graph in dot
# This is a simple dotfile showing the basic features of a graph
digraph sample_graph {
# Nodes are specified with the node command, if note labeled seperately
# Their labels are their names
node [shape=circle] node_a, node_b;
# The shape will automatically be a circle
node [label="Node Gamma"] node_c;
# Node attributes are passed down the line, so if I want to
# avoid everything being called 'Node gamma', I have to reset
# the label to the node name
node [shape=square, label="\N"] node_1, node_2;
node [shape=doublecircle] node_3;
# Edge attributes are put in square brackets; label is the text label
# for the graph
node_1 -> node_a [ label="Transition 1,A" ];
node_a -> node_1;
node_b -> node_b [ label="Transition B,B" ];
node_c -> node_2;
node_2 -> node_1;
# Color is controlled with the color attribte
node_2 -> node_3 [color = "blue"];
node_2 -> node_a;
# Style lets you specify dotted, bold, &c.
node_2 -> node_b [style = "dotted"];
node_2 -> node_c;
label="Sample Graph";
fontsize=14;
}

Figure 9-1. Resulting layout in dot
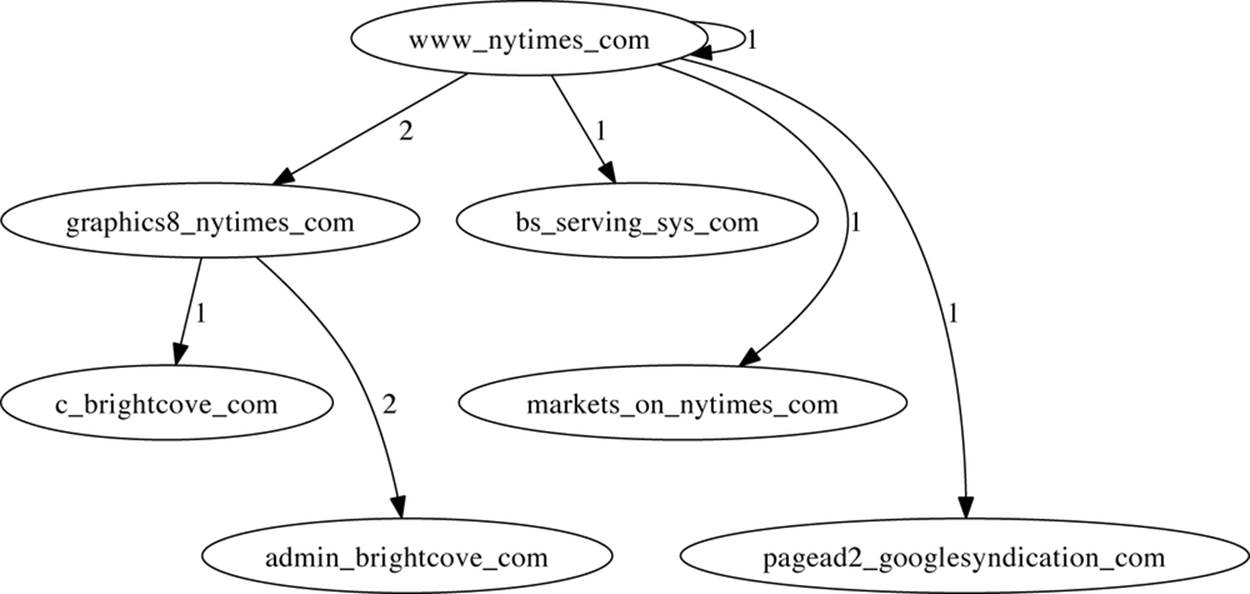
It’s very easy to convert log records from their own formats to dot, and the resulting graphs can often be used to visually signify features such as central nodes. Example 9-2 shows the code that converts HTTP page and referrer sites into links and then plots the progression of surfing using dot. An example graph is shown in Figure 9-2.
Example 9-2. Convert Web Log Records into Dot Graphs
#!/usr/bin/env python
#
# log2dot.py
#
# Input:
# Log files from stdin. We assume these files have been processed to
# provide the URL and Referer URL
#
# Output
# Stdout produces a dot file which can be run through graphviz
import sys, re
host_id = re.compile('^http://([^/]+)/.*$')
pairs = {}
nodes = {}
def graph_output(nodes, pairs):
graph_header = """
digraph graph_output {
rotate = 90;
size="7.5,10";
"""
print graph_header
a = nodes.keys()
a.sort()
for i in a:
print "node [shape = circle] i;"
a = pairs.keys()
a.sort()
for i in a:
for j in pairs[i].keys():
# Prints each link then labels it with the number of occurrences
print '%s -> %s [label="%d"] ;' % (i,j,pairs[i][j])
print "}"
if __name__ == '__main__':
for i in sys.stdin.readlines():
values = i[:-1].split()
host = values[-2][:-1]
referrer = values[-1]
if host_id.match(referrer):
refname = host_id.match(referrer).groups()[0]
else:
refname = referrer
a = host.split('.')
if a[0] == 'www':
host = '.'.join(a[1:])
a = refname.split('.')
if a[0] == 'www':
refname = '.'.join(a[1:])
host = host.replace('-','_')
host = host.replace('.','_')
refname = refname.replace('-','_')
refname = refname.replace('.','_')
nodes[host] = 1
nodes[refname] = 1
if pairs.has_key(refname):
if pairs[refname].has_key(host):
pairs[refname][host] += 1
else:
pairs[refname][host] = 1
else:
pairs[refname] = {host:1}
graph_output(nodes, pairs)

Figure 9-2. Sample output of the log2dot script
Communications and Probing
Network monitoring, as I’ve discussed it in this book, is largely passive. There are a number of situations where more active monitoring and testing is warranted, however. The tools in this section are used for actively poking and probing at a network.
In the context of this book, I’ve focused on tools that are used to actively supplement monitoring infrastructure. They’re used to provide example sessions (netcat), supplement passive monitoring with active probing (nmap), or to provide crafted sessions to test specific monitoring configurations (Scapy).
netcat
netcat is a Unix command-line tool that redirects output to TCP and UDP sockets. The power of netcat is that it turns sockets into just another pipe-accessible Unix FIFO. Using netcat, it is possible to quickly implement clients, servers, proxies, and portscanners.
netcat’s simplest invocation is netcat host port, which creates a TCP socket to the specified host and port number. Input can be passed to netcat and output read using standard Unix redirects, like this:
$echo "GET /" | netcat www.oreilly.com 80
<!DOCTYPE HTML PUBLIC "-//IETF//DTD HTML 2.0//EN">
<html><head>
...
In this example, we use netcat to fetch the index page of a website. The GET / is standard HTTP syntax.[14] If you know how to create a session using a particular protocol such as HTTP, SMTP, or the like, you can send it through netcat to create a client.
On the same principle, you can use netcat for banner grabbing (see Chapter 15). For example, I can grab an ssh banner by sending a bogus session through netcat to an SSH server:
$ echo "WAFFLES" | nc fakesite.com 22
SSH-2.0-OpenSSH_6.2
Protocol mismatch.
Note the use of nc in the example; on most netcat packages, the two applications will be aliases to each other. By default, netcat opens a TCP connection, this can be modified using the -u option.
netcat provides a number of command-line options for finer control of the tool. For example, to improve banner grabbing, we can use a range of ports:
echo "WAFFLES" | nc -w1 -v fakesite.com 20-30
fakesite.com [127.0.0.1] 21 (ftp) open
220 fakesite.com NcFTPd Server (licensed copy) ready.
500 Syntax error, command unrecognized.
fakesite.com [127.0.0.1] 22 (ssh) open
SSH-2.0-OpenSSH_6.2
The -v option specifies verbosity, adding the lines about which ports are opened. The -w1 command specifies a 1-second wait, and the 20-30 specifies to check the ports 20 through 30.
Simple portscanning can be done using the -z option, which simply checks to see if a connection is open. For example:
$ nc -n -w1 -z -vv 192.168.1.9 3689-3691
192.168.1.9 3689 (daap) open
192.168.1.9 3690 (svn): Connection refused
192.168.1.9 3691 (magaya-network): Connection refused
Total received bytes: 0
Total sent bytes: 0
Which, in this case, scans an Apple TV.
netcat is a very handy tool for banner grabbing and internal analytics because it enables you to build an ad hoc client for any application very quickly. When new internal sites are identified, netcat can be used to scan and probe them for more information if a better tool isn’t available.
nmap
Passive security analysis will only go so far, and every effective internal security program should have at least one scanning tool available to them. Network Mapper (nmap) is the best open source scanning tool available.
The reason to use nmap, or any other scanning tool, is because these tools contain a huge amount of information about vulnerabilities and operating systems. The goal of any scanning effort is to gain intelligence about a targeted host or network. While a simple half-open scan can be easily implemented using just about anything with a command line, professional scanning tools benefit from expert systems that can combine banner grabbing, packet analysis, and other techniques to identify host information. For example, consider a simple nmap scan on the Apple TV used in the previous example (address 192.168.1.9):
$ nmap -A 192.168.1.9
Starting Nmap 6.25 ( http://nmap.org ) at 2013-07-28 19:44 EDT
Nmap scan report for Apple-TV-3.home (192.168.1.9)
Host is up (0.0058s latency).
Not shown: 995 closed ports
PORT STATE SERVICE VERSION
3689/tcp open daap Apple iTunes DAAP 11.0.1d1
5000/tcp open rtsp Apple AirTunes rtspd 160.10 (Apple TV)
| rtsp-methods:
|_ ANNOUNCE, SETUP, RECORD, PAUSE, FLUSH, TEARDOWN, OPTIONS, \
GET_PARAMETER, SET_PARAMETER, POST, GET
7000/tcp open http Apple AirPlay httpd
| http-methods: Potentially risky methods: PUT
|_See http://nmap.org/nsedoc/scripts/http-methods.html
|_http-title: Site doesn't have a title.
7100/tcp open http Apple AirPlay httpd
|_http-methods: No Allow or Public header in OPTIONS response (status code 400)
|_http-title: Site doesn't have a title.
62078/tcp open tcpwrapped
Service Info: OSs: OS X, Mac OS X; Device: media device;
CPE: cpe:/o:apple:mac_os_x
Service detection performed. Please report any incorrect results at
http://nmap.org/submit/ .
Nmap done: 1 IP address (1 host up) scanned in 69.63 seconds
The nmap scan contains information about open ports, the version of the server software on those ports, potential risks, and additional data such as the CPE string.[15]
Analytically, scan tools are used immediately after a new host is discovered on a network in order to figure out exactly what the host is. In particular, this is done by using the following process:
1. Audit flow data to see if any new host/port combinations are appearing on the network.
2. If new hosts are found, run nmap on the hosts to determine what they’re running.
3. If nmap can’t identify the service on the port, run nc to do some basic banner grabbing and find out what the new port is.
Scapy
Scapy is a Python-based packet manipulation and analysis library. Using Scapy, you can rip apart packets in a Python-friendly structure, visualize their contents and create new correct IP packets that can be appended or injected into a collection of packets. Scapy is my go-to tool for converting and manipulating tcpdump records.
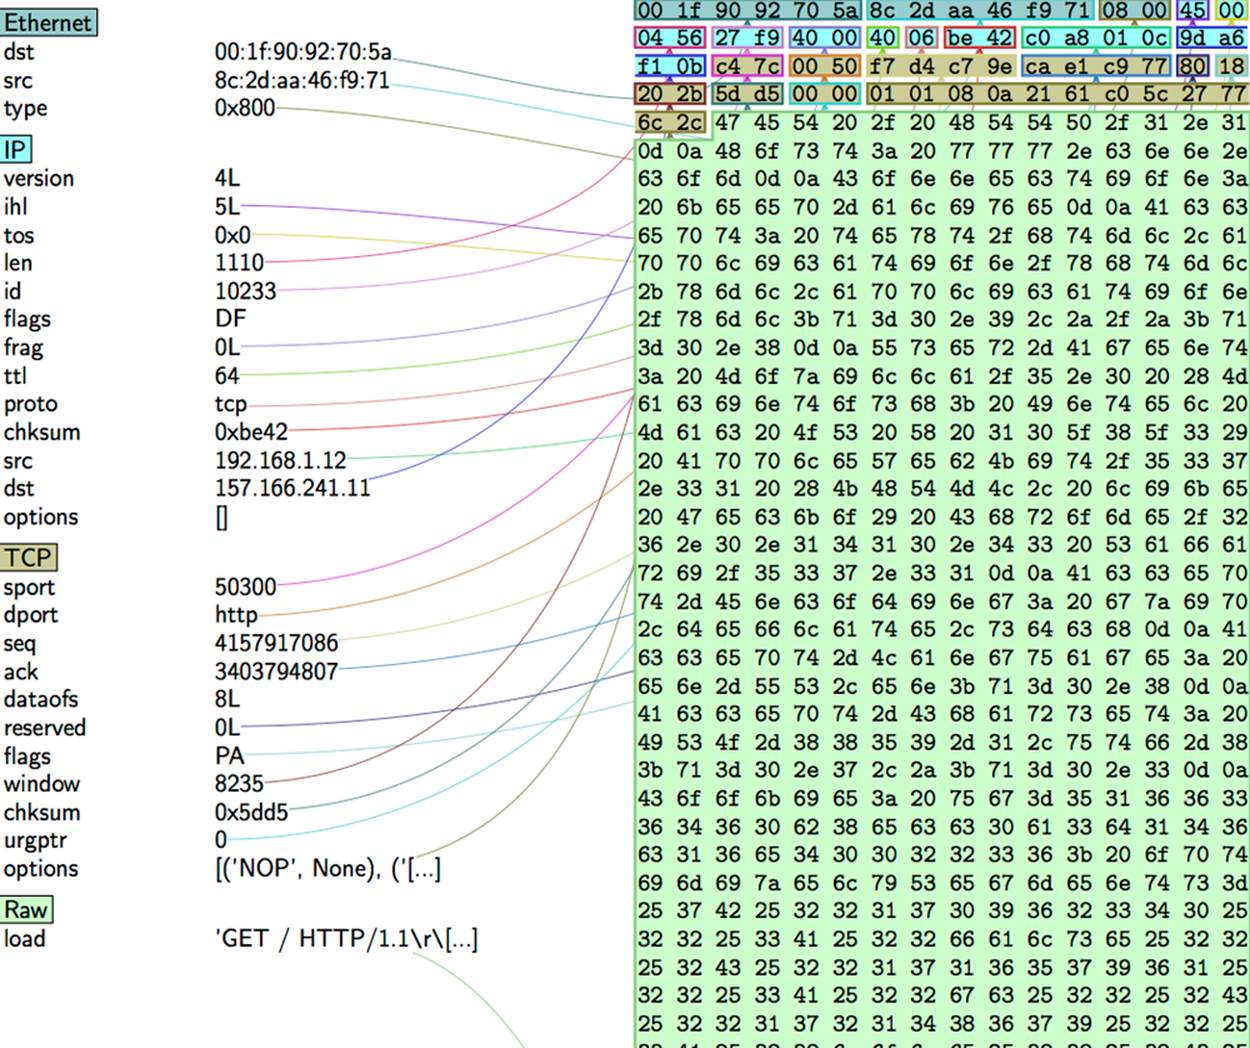
Scapy provides a Python-friendly representation of tcpdump data. Once you’ve loaded the data, you can view it using a number of display functions or examine the various layers of each packet, which are represented as their own elements in a dictionary. In Example 9-3, we read in and examine some packet contents using Scapy’s provided text features and produce the image accompanying it. Figure 9-3 shows the output.
Example 9-3. Reading and examining packet contents
>>> # we start by loading up a dump file using rdpcap
>>> >> s=rdpcap('web.pcap')
>>> # We look for the first packet with TCP payload
>>> for i in range(0,100):
... if len(s[i][TCP].payload) > 0:
... print i
... break
...
63
>>> # We look at its contents using show()
>>> >>> s[63].show()
###[ Ethernet ]###
dst= 00:1f:90:92:70:5a
src= 8c:2d:aa:46:f9:71
type= 0x800
###[ IP ]###
version= 4L
ihl= 5L
tos= 0x0
len= 1110
id= 10233
flags= DF
frag= 0L
ttl= 64
proto= tcp
chksum= 0xbe42
src= 192.168.1.12
dst= 157.166.241.11
\options\
###[ TCP ]###
sport= 50300
dport= http
seq= 4157917086
ack= 3403794807
dataofs= 8L
reserved= 0L
flags= PA
window= 8235
chksum= 0x5dd5
urgptr= 0
options= [('NOP', None), ('NOP', None), ('Timestamp',
(560054364, 662137900))]
###[ Raw ]###
load= 'GET / HTTP/1.1\r\nHost: www.cnn.com\r\nConnection:...'
>>> # Dump the contents using PDFdump
>>> s[63].pdfdump('http.pdf')

Figure 9-3. When fully installed, Scapy can produce graphical disassemblies of a packet
I use Scapy primarily to convert and reformat tcpdump records. The following example is a very simple application of this. The supplied script, shown in Example 9-4, provides a columnar output for pcap files similar to rwcut’s output.
Example 9-4. tcpcut.py script
#!/usr/bin/env python
#
#
# tcpcut.py
#
# This is a script that takes a tcpdump file as input and dumps
# the contents to screen in a format similar to rwcut.
# It supports only nine fields and no prompts for the standard
# pedagogical reason.
#
# Input
# tcpcut.py data_file
#
# Output
# Columnar output to stdout
from scapy.all import *
import sys, time
header = '%15s|%15s|%5s|%5s|%5s|%15s|' % ('sip','dip','sport','dport',
'proto','bytes')
tfn = sys.argv[1]
pcap_data = rdpcap(tfn)
for i in pcap_data:
sip = i[IP].src
dip = i[IP].src
if i[IP].proto == 6:
sport = i[TCP].sport
dport = i[TCP].dport
elif i[IP].proto == 17:
sport = i[UDP].sport
dport = i[UDP].dport
else:
sport = 0
dport = 0
bytes = i[IP].len
print "%15s|%15s|%5d|%5d|%5d|%15d" % (sip, dip, sport, dport,
i[IP].proto, bytes)
I also use Scapy to generate data for session testing. For example, if presented with a new logging system, I’ll generate a session using pcap and run that against the logging system, then tweak the session using Scapy to see how my changes affect the logged records.
Packet Inspection and Reference
The tools discussed in this section are all focused on enhancing packet inspection and analysis. Wireshark is arguably the most useful packet inspection tool available, and geoip is a handy reference tool for figuring out where traffic data came from.
Wireshark
I’m not going to burn a lot of space on Wireshark because, like Snort and nmap, it’s one of the most common and well-documented tools available for traffic analysis. Wireshark is a graphical protocol analyzer that provides facilities for examining packets and collecting statistics on them, as well as a number of tools for meaningfully exploring the data.
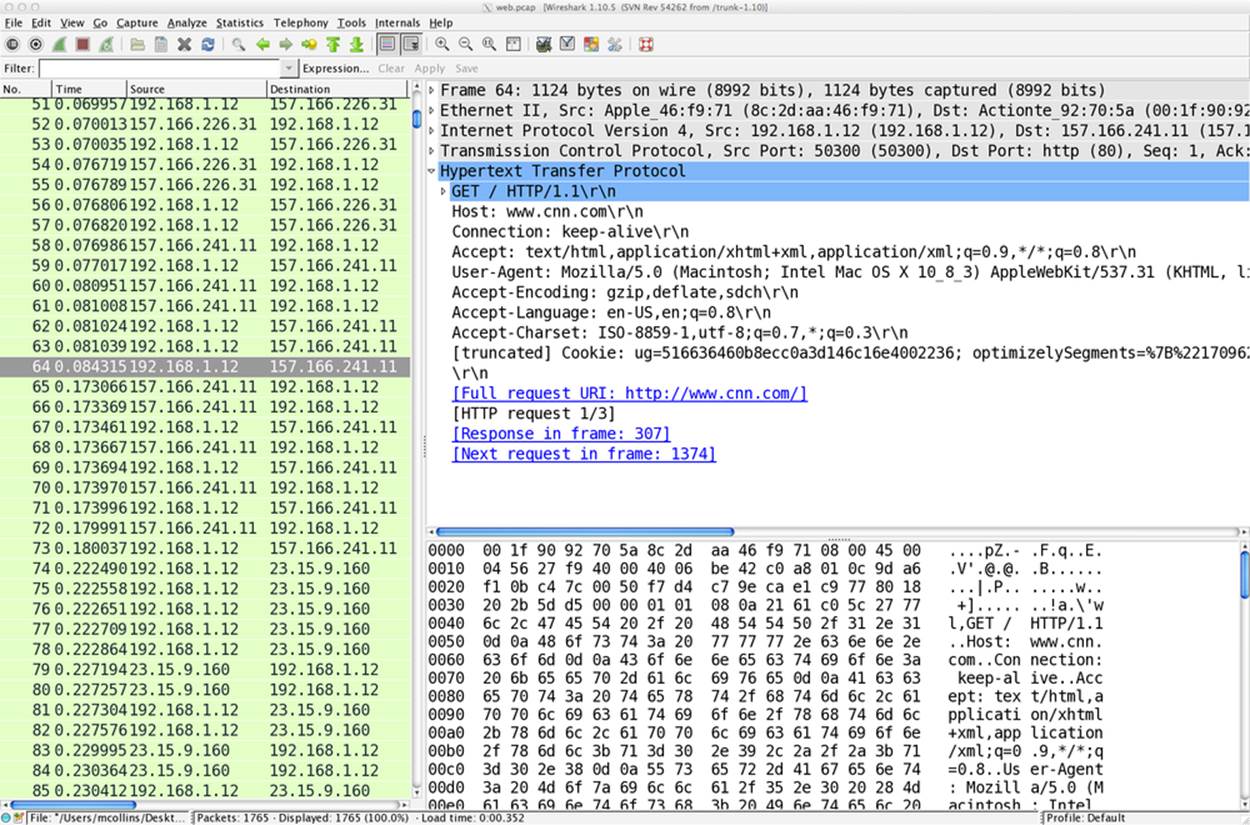
Wireshark’s real strength is in its extensive library of dissectors for analyzing packet data. A dissector is a set of rules and procedures for ripping apart packet data and reconstructing the session underneath. An example of this is shown in Figure 9-4, which shows how Wireshark can extract and display the contents of an HTTP session.

Figure 9-4. An example Wireshark screen showing session reconstruction
GeoIP
Geolocation services take IP addresses and return information on the physical location of the address. Geolocation is an intelligence process: researchers start with the allocation from NICs and then combine a number of different approaches ranging from mapping transmission delays to calling up companies and finding their mailing addresses.
MaxMind’s GeoIP is the default free geolocation database. The free version (GeoLite) will provide you with city, country, and ASN information.
Applied Security has produced a good GeoIP library in Python (pygeoip, also available in pip). pygeoip works with both the commercial and free database instances. The following sample script, pygeoip_lookup.py, shows how the API works:
#!/usr/bin/env python
#
# pygeoip_lookup.py
#
# Takes any IP addresses passed to it as input,
# runs them through the maxminds geoip database and
# returns the country code.
#
include sys,string,pygeoip
gi_handle = None
try:
geoip_dbfn = sys.argv[1]
gi_handle = pygeoip.GeoIP(geoip_dbfn,pygeoip.MEMORY_CACHE)
except:
sys.stderr.write("Specify a database\n")
sys.exit(-1)
for i in sys.stdin.readlines():
ip = i[:-1]
cc = gi_handle.country_code_by_addr(ip)
print "%s %s" % (ip, cc)
Geolocation is big business, and there are a number of commercial geolocation databases available. MaxMind offers their own, and other options include Neustar’s IP Intelligence, Akamai, and Digital Envoy.
The NVD, Malware Sites, and the C*Es
The National Vulnerability Database (NVD) is a public service maintained by NIST to enumerate and classify vulnerabilities in software and hardware systems. The NVD project has been operating under several different names for years, and there are several distinct components to the database. The most important started at MITRE under a variety of names beginning with C and ending with E:
CVE
The Common Vulnerabilities and Exposures database is a mechanism for enumerating software vulnerabilites and exploits.
CPE
The Common Platform Enumeration database provides a mechanism for describing software platforms using a hierarchical string. CVE entries use the CPE to refer to the specific vulnerable software releases covered by the CVE.
CCE
The Common Configuration Enumeration describes and enumerates software configurations, such as an Apache Install. CCE is still under construction.
NVD manages all of these enumerations under the Security Content Automation Protocol (SCAP), an ongoing effort to automate security configuration. For analysis purposes, the CVE is the most critical part of this entire mishegas. A single vulnerability may have dozens or hundreds of different exploits written for it, but the CVE number for that vulnerability ties them all together.
In addition to the government funded efforts, there are a number of other common exploit listings. These include:
BugTraq IDs
BugTraq is a vulnerability mailing list that covers new exploits and vulnerabilities sent in by a large number of independent researchers. BugTraq uses a simple numerical ID and maintains a list for each new vulnerability identified. BugTraq’s bug reports tend to heavily overlap the NVD.
OSVDB
A vulnerability database maintained by the Open Security Foundation (OSF), a nonprofit organization for managing vulnerability data.
Symantec’s Security Response
This site contains a database and summary for every malware signature produced by Symantec’s AV software.
McAfee’s Threat Center
The Threat Center serves the same purpose as Symantec’s site; it’s a frontend to the currently identified threats and malware that McAfee’s AV software tracks.
Kaspersky’s Securelist Threat Descriptions
Kaspersky’s list of signatures.
These databases are more directly useful to malware researchers, who are obviously more focused on exploits and takeover. For network security analysis, these sites are primarily useful for identifying the vectors by which a worm or other malware propagates through a network, and consequently getting a good first approximation of what the traffic feed for malware will look like. For example, if a piece of malware propagates over HTTP and NetBIOS,[16] then you have some network services and port numbers to start poking at.
Search Engines, Mailing Lists, and People
Here’s the difference between an average analyst and a good one. The average analyst will receive data from pcap or weblogs and come to a conclusion with the data provided. The good analyst will seek out other information, whether from weblogs, mailing lists, or by communicating with analysts in other forums.
Computer security is a constantly changing field, and attacks are a constant moving target. It is very easy to grow complacent as an analyst because there are so many simple attacks to track and monitor, while attackers evolve to use new tools and approaches. Internet traffic changes for many reasons, many of them nontechnical—I’ve found the explanations for traffic jumps on mailing lists such as NANOG as well as the New York Times front page.
Further Reading
1. Laura Chappell and Gerald Combs, “Wireshark 101: Essential Skills for Network Analysis.”
2. Graphviz
3. Gordon “Fyodor” Lyon, “Nmap Network Scanning,” Nmap Project, 2009.
4. The Nmap project
5. Scapy
6. Wireshark
[14] HTTP is an extremely robust protocol and tolerates any combination of session attempts, so this is a bit of a straw man for the sake of example.
[15] CPE is a NIST project to provide a common framework for describing platforms.
[16] Which, admittedly, describes a lot of malware.
All materials on the site are licensed Creative Commons Attribution-Sharealike 3.0 Unported CC BY-SA 3.0 & GNU Free Documentation License (GFDL)
If you are the copyright holder of any material contained on our site and intend to remove it, please contact our site administrator for approval.
© 2016-2026 All site design rights belong to S.Y.A.