Network Security Through Data Analysis: Building Situational Awareness (2014)
Part I. Data
This section discusses the collection and storage of data for use in analysis and response. Effective security analysis requires collecting data from widely disparate sources, each of which provides part of a picture about a particular event taking place on a network.
To understand the need for hybrid data sources, consider that most modern bots are general purpose software systems. A single bot may use multiple techniques to infiltrate and attack other hosts on a network. These attacks may include buffer overflows, spreading across network shares, and simple password cracking. A bot attacking an SSH server with a password attempt may be logged by that host’s SSH logfile, providing concrete evidence of an attack but no information on anything else the bot did. Network traffic might not be able to reconstruct the sessions, but it can tell you about other actions by the attacker—including, say, a successful long session with a host that never reported such a session taking place, no siree.
The core challenge in data-driven analysis is to collect sufficient data to reconstruct rare events without collecting so much data as to make queries impractical. Data collection is surprisingly easy, but making sense of what’s been collected is much harder. In security, this problem is complicated by rare actual security threats. The majority of network traffic is innocuous and highly repetitive: mass emails, everyone watching the same YouTube video, file accesses. A majority of the small number of actual security attacks will be really stupid ones such as blind scanning of empty IP addresses. Within that minority is a tiny subset that represents actual threats such as file exfiltration and botnet communications.
All the data analysis we discuss in this book is I/O bound. This means that the process of analyzing the data involves pinpointing the correct data to read and then extracting it. Searching through the data costs time, and this data has a footprint: a single OC-3 can generate five terabytes of raw data per day. By comparison, an eSATA interface can read about 0.3 gigabytes per second, requiring several hours to perform one search across that data, assuming that you’re reading and writing data across different disks. The need to collect data from multiple sources introduces redundancy, which costs additional disk space and increases query times.
A well-designed storage and query system enables analysts to conduct arbitrary queries on data and expect a response within a reasonable time frame. A poorly designed one takes longer to execute the query than it took to collect the data. Developing a good design requires understanding how different sensors collect data; how they complement, duplicate, and interfere with each other; and how to effectively store this data to empower analysis. This section is focused on these problems.
This section is divided into four chapters. Chapter 1 is an introduction to the general process of sensing and data collection, and introduces vocabulary to describe how different sensors interact with each other. Chapter 2 discusses sensors that collect data from network interfaces, such astcpdump and NetFlow. Chapter 3 is concerned with host and service sensors, which collect data about various processes such as servers or operating systems. Chapter 4 discusses the implementation of collection systems and the options available, from databases to more current big data technology.
Chapter 1. Sensors and Detectors: An Introduction
Effective information monitoring builds on data collected from multiple sensors that generate different kinds of data and are created by many different people for many different purposes. A sensor can be anything from a network tap to a firewall log; it is something that collects information about your network and can be used to make judgement calls about your network’s security. Building up a useful sensor system requires balancing its completeness and its redundancy. A perfect sensor system would be complete while being nonredundant: complete in the sense that every event is meaningfully described, and nonredundant in that the sensors don’t replicate information about events. These goals, probably unachievable, are a marker for determining how to build a monitoring solution.
No single type of sensor can do everything. Network-based sensors provide extensive coverage but can be deceived by traffic engineering, can’t describe encrypted traffic, and can only approximate the activity at a host. Host-based sensors provide more extensive and accurate information for phenomena they’re instrumented to describe. In order to effectively combine sensors, I classify them along three axes:
Vantage
The placement of sensors within a network. Sensors with different vantages will see different parts of the same event.
Domain
The information the sensor provides, whether that’s at the host, a service on the host, or the network. Sensors with the same vantage but different domains provide complementary data about the same event. For some events, you might only get information from one domain. For example, host monitoring is the only way to find out if a host has been physically accessed.
Action
How the sensor decides to report information. It may just record the data, provide events, or manipulate the traffic that produces the data. Sensors with different actions can potentially interfere with each other.
Vantages: How Sensor Placement Affects Data Collection
A sensor’s vantage describes the packets that a sensor will be able to observe. Vantage is determined by an interaction between the sensor’s placement and the routing infrastructure of a network. In order to understand the phenomena that impact vantage, look at Figure 1-1. This figure describes a number of unique potential sensors differentiated by capital letters. In order, these sensor locations are:
A
Monitors the interface that connects the router to the Internet.
B
Monitors the interface that connects the router to the switch.
C
Monitors the interface that connects the router to the host with IP address 128.2.1.1.
D
Monitors host 128.1.1.1.
E
Monitors a spanning port operated by the switch. A spanning port records all traffic that passes the switch (see the section on port mirroring in Chapter 2 for more information on spanning ports).
F
Monitors the interface between the switch and the hub.
G
Collects HTTP log data on host 128.1.1.2.
H
Sniffs all TCP traffic on the hub.
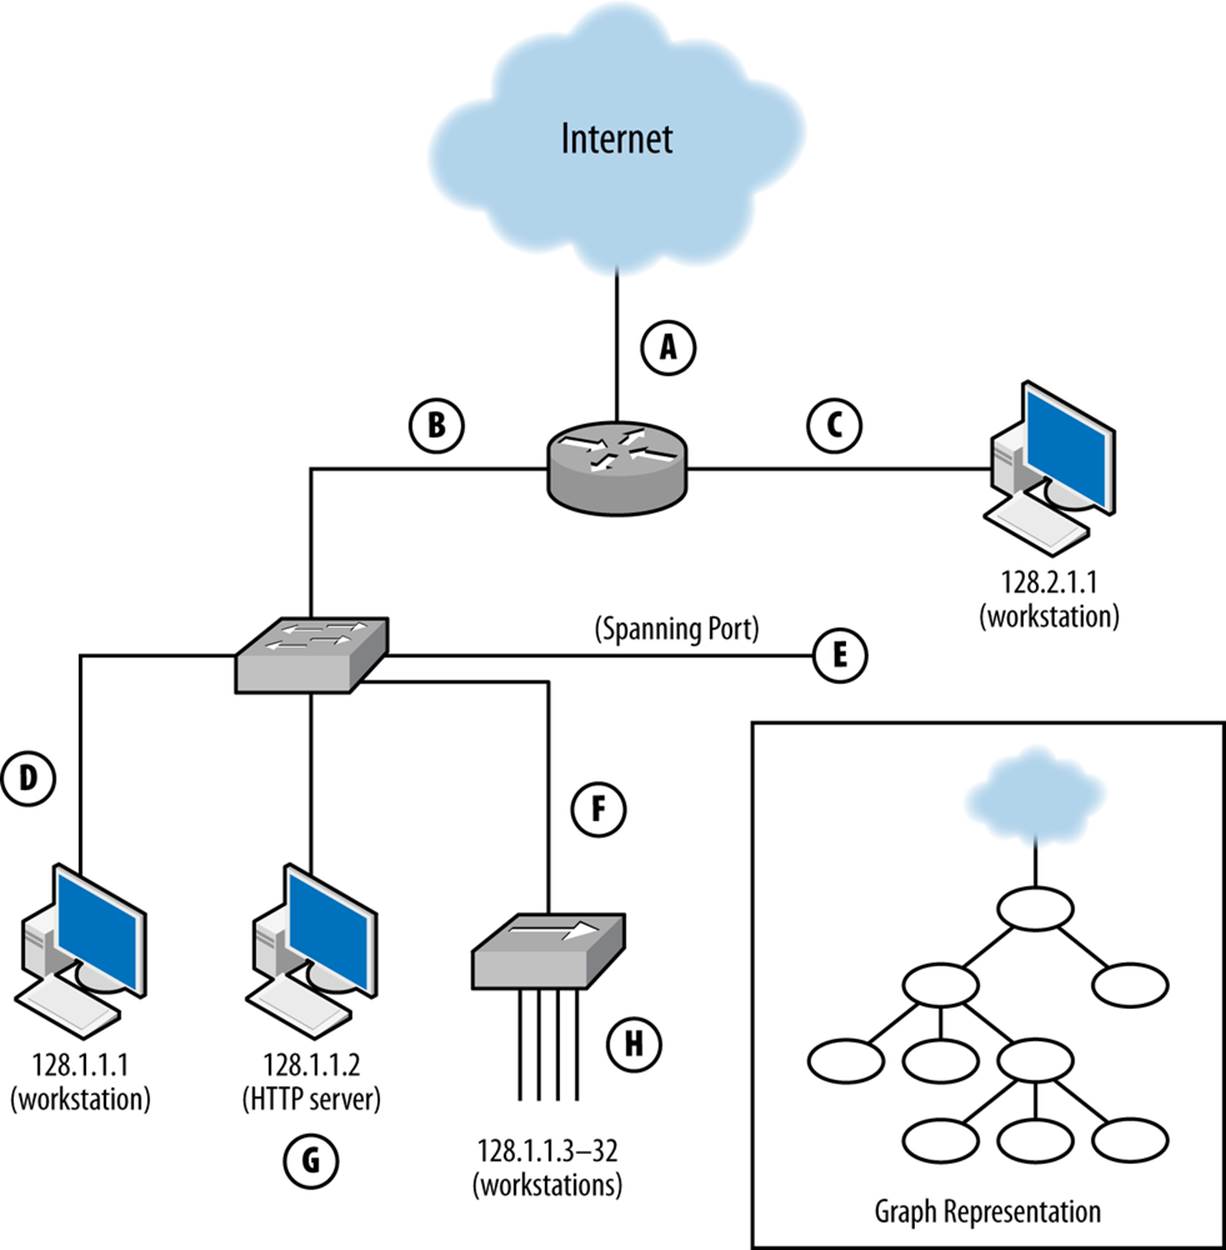
Figure 1-1. Vantage points of a simple network and a graph representation
Each of these sensors has a different vantage, and will see different traffic based on that vantage. You can approximate the vantage of a network by converting it into a simple node-and-link graph (as seen in the corner of Figure 1-1) and then tracing the links crossed between nodes. A link will be able to record any traffic that crosses that link en route to a destination. For example, in Figure 1-1:
§ The sensor at position A sees only traffic that moves between the network and the Internet—it will not, for example, see traffic between 128.1.1.1 and 128.2.1.1.
§ The sensor at B sees any traffic that originates or ends in one of the addresses “beneath it,” as long as the other address is 128.2.1.1 or the Internet.
§ The sensor at C sees only traffic that originates or ends at 128.2.1.1.
§ The sensor at D, like the sensor at C, only sees traffic that originates or ends at 128.1.1.1.
§ The sensor at E sees any traffic that moves between the switches’ ports: traffic from 128.1.1.1 to anything else, traffic from 128.1.1.2 to anything else, and any traffic from 128.1.1.3 to 128.1.1.32 that communicates with anything outside that hub.
§ The sensor at F sees a subset of what the sensor at E sees, seeing only traffic from 128.1.1.3 to 128.1.1.32 that communicates with anything outside that hub.
§ G is a special case because it is an HTTP log; it sees only HTTP traffic (port 80 and 443) where 128.1.1.2 is the server.
§ Finally, H sees any traffic where one of the addresses between 128.1.1.3 and 128.1.1.32 is an origin or a destination, as well as traffic between those hosts.
Note that no single sensor provides complete coverage of this network. Furthermore, instrumentation will require dealing with redundant traffic. For instance, if I instrument H and E, I will see any traffic from 128.1.1.3 to 128.1.1.1 twice. Choosing the right vantage points requires striking a balance between complete coverage of traffic and not drowning in redundant data.
When instrumenting a network, determining vantage is a three-step process: acquiring a network map, determining the potential vantage points, and then determining the optimal coverage.
The first step involves acquiring a map of the network and how it’s connected together as well as a list of potential instrumentation points. Figure 1-1 is a simplified version of such a map.
The second step, determining the vantage of each point, involves identifying every potentially instrumentable location on the network and then determining what that location can see. This value can be expressed as a range of IP address/port combinations. Table 1-1 provides an example of such an inventory for Figure 1-1. A graph can be used to make a first guess at what vantage points will see, but a truly accurate model requires more in-depth information about the routing and networking hardware. For example, when dealing with routers it is possible to find points where the vantage is asymmetric (note that the traffic in Table 1-1 is all symmetric). Refer to Network Layering and Its Impact on Instrumentation for more information.
Table 1-1. A worksheet showing the vantage of Figure 1-1
|
Vantage point |
Source IP range |
Destination IP range |
|
A |
Internet |
128.1, 2.1.1-32 |
|
128.1, 2.1.1-32 |
Internet |
|
|
B |
128.1.1.1-32 |
128.2.1.1, Internet |
|
128.2.1.1, Internet |
128.1.1.1-32 |
|
|
C |
128.2.1.1 |
128.1.1.1-32, Internet |
|
128.1.1.1-32, Internet |
128.2.1.1 |
|
|
D |
128.1.1.1 |
128.1.1.2-32, 128.2.1.1, Internet |
|
128.1.1.2-32, 128.2.1.1, Internet |
128.1.1.1 |
|
|
E |
128.1.1.1 |
128.1.1.2-32, 128.2.1.1, Internet |
|
128.1.1.2 |
128.1.1.1, 128.1.1.3-32, 128.2.1.1,Internet |
|
|
128.1.1.3-32 |
128.1.1.1-2,128.2.1.1, Internet |
|
|
F |
128.1.1.3-32 |
128.1.1.1-2, 128.2.1.1, Internet |
|
128.1.1.1-32, 128.2.1.1, Internet |
128.1.1.3-32 |
|
|
G |
128.1,2.1.1-32, Internet |
128.1.1.2:tcp/80 |
|
128.1.1.2:tcp/80 |
128.1,2.1.1-32 |
|
|
H |
128.1.1.3-32 |
128.1.1.1-32, 128.2.1.1,Internet |
|
128.1.1.1-32, 128.2.1.1, Internet |
128.1.1.3-32 |
The final step is to pick the optimal vantage points shown by the worksheet. The goal is to choose a set of points that provide monitoring with minimal redundancy. For example, sensor E provides a superset of the data provided by sensor F, meaning that there is no reason to include both. Choosing vantage points almost always involves dealing with some redundancy, which can sometimes be limited by using filtering rules. For example, in order to instrument traffic between the hosts 128.1.1.3–32, point H must be instrumented, and that traffic will pop up again and again at points E, F, B, and A. If the sensors at those points are configured to not report traffic from 128.1.1.3–32, the redundancy problem is moot.
Domains: Determining Data That Can Be Collected
Sensor G in Figure 1-1 differs from the other sensors in that image; while the other sensors in the network are presumed to record all network traffic, G is recording only HTTP traffic (tcp/80). While all the other sensors are collecting network traffic data, G is collecting data in a differentdomain. A sensor’s domain describes the scope of the information it records. A sensor can collect data in one of three domains:
Network
This collects information about network traffic. Examples of these sensors include VPNs, most intrusion detection systems (IDSes), NetFlow collectors such as YAF (described in YAF), and TCP collectors such as Snort and raw data collected by tcpdump.
Host
Resides on the host and monitors the activity on a host: logins, logouts, file accesses, and so on. A host-based sensor can provide information that a network based sensor can’t, such as physical logins to a particular host or the use of a USB peripheral. Host-based sensors include IPS tools such as Tripwire or McAfee’s HIPS application, as well as system logfiles or security logs. Host-based sensors provide information on the low-level operation of a host, but won’t provide much information on the services that are running there. Clearly, you can implement host-based sensors only on hosts that you know about. Unauthorized hosts have to be found before you can monitor them.
Service
Service sensors are generated by a particular service process, such as HTTP or SMTP server logs. Service sensors keep track of well-formed, if not necessarily legitimate, activity within the service (for example, an HTTP sensor will record a failed attempt to fetch a URL, but won’t record a port 80 session that didn’t send HTTP compliant commands). Unlike host and sensor logs, which are general sensors, service-based sensors are focused on logging interactions with a particular service: mail messages sent, HTTP requests served, and so on. As with a host-based sensor, you must be aware that the service exists before you can use a service-based sensor.
STREAM REASSEMBLY AND PACKET DISSECTION
There are a number of different tools that can take network traffic and approximate a service log by extracting the relevant information from the packets. For example, the contents of a CLF record (see HTTP: CLF and ELF for more information) are exchanged between an HTTP client and an HTTP server.
Network analysis tools often provide packet dissection or session reconstruction facilities as part of deep packet inspection. These construct a model of the session based on the packet data. These tools are very useful for approximating what happens in a session if you don’t have service logs, however they run into the standard limits involving network session reconstruction: they won’t work with encrypted data, they’re approximating the session and can miss implementation-specific details, and the process of reconstruction is expensive. At the same time, these collectors will work on any network traffic data and do not require the logistically painful process of identifying and instrumenting individual service.
Note that the domain describes the information that the sensor uses, not the information that the sensor reports. For example, NetFlow, tcpdump, and network-based IDS sensors all work within the network domain, but each provides a different output.
To understand the difference between these three domains, consider an HTTP interaction as observed through sensors in three different domains: a network-based monitor that sniffs packets, a host-based sensor that tracks performance and file accesses, and an HTTP server’s logfile. The network sensor can record the packets that were sent, but does not relate them together into HTTP structures such as sessions, cookies, or pages. The host sensor can record the last time a file was accessed, but does not relate that file to a URL or request. The service sensor can say that an HTTP session took place and include what page was served, but it will not record a half-open scan on port 80.
Of the three sensors, the one with the service domain is the only one that can (barring tampering with the logger) state that a particular interaction took place; the others can only provide information for an analyst to use for guesswork. All things being equal, it is always preferable to have a sensor whose domain is as close to the target as possible.
The sensors’ domains, together with their vantages, determine how redundant a sensor combination is. If two sensors have the same domain, and one sensor’s vantage is a superset of the other, the smaller sensor is redundant and probably shouldn’t be run. Conversely, if two sensors have the same vantage but different domains, they should complement each other.
Consider the example network in Figure 1-2, which has an HTTPS server on 128.2.1.1, an unknown HTTP server on 128.2.1.2, and a client on 128.2.1.3.
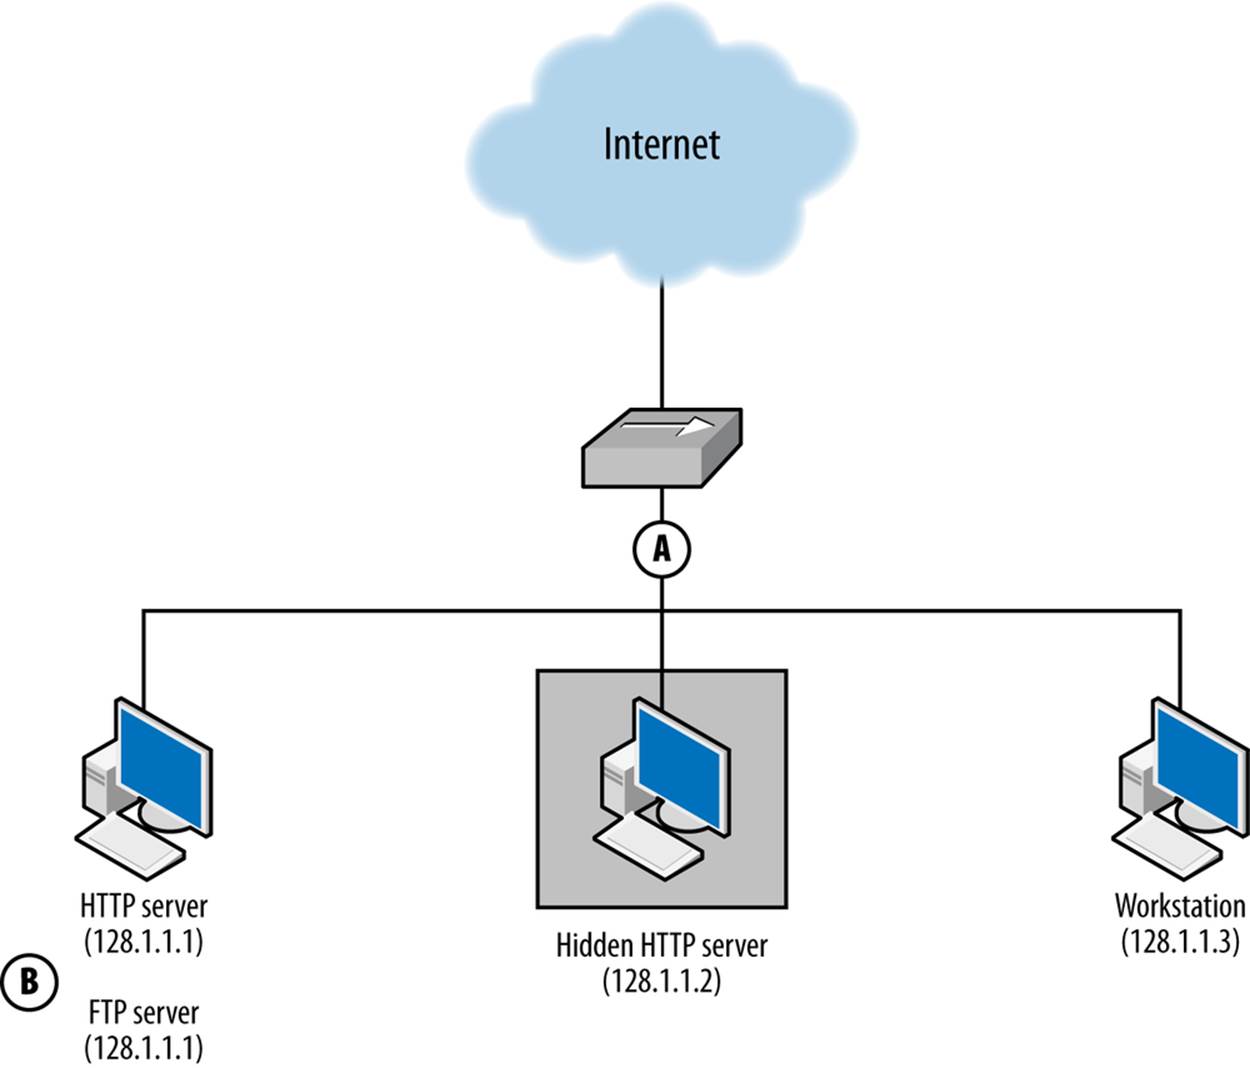
Figure 1-2. An example of host- and network-based sensors working together
The HTTPS server is accessible via FTP, which is not logged. We summarize this information by expanding the table format used in Table 1-1 and adding the domains, shown in Table 1-2.
Table 1-2. Vantage and domain for Figure 1-2
|
Vantage point |
Source IP range |
Destination IP range |
Domain |
|
A |
128.1.1.1-3 |
Internet |
Network |
|
128.1.1.1-3 |
128.1.1.1-3 |
Network |
|
|
Internet |
128.1.1.1-3 |
Network |
|
|
B |
128.1.1.2-3,Internet |
128.1.1.1:tcp/443 |
Service/HTTPS |
|
128.1.1.1:tcp/443 |
128.1.1.2-3,Internet |
Service/HTTPS |
Now, let’s run through some different attacks and how these sensors react to them.
§ An attacker scans the network for FTP servers. The scan and the responses will be seen by sensor A. B will not see the scan, as there is no FTP sensor.
§ An attacker scans the network for HTTPS servers by opening a GET / request to 443. Sensor A sees a session to 128.1.1.1, but sensor B has the actual information on the session.
§ An attacker scans for HTTP servers. A sees the scan, but B logs HTTPS events—not HTTP, and ignores the scan. Sensor A also sees the response from 128.1.1.2, identifying a previously unidentified HTTP server.
Sensors in different domains provide richer information than single sensors, even if those sensors provide the same vantage. Host-based sensors provide more information and can provide data, such as unencrypted payload, that might not be available to a network sensor. However, a defender has to be aware that a host-based sensor exists before he can use it.
Network-based sensors generally provide more information than host-based sensors, both because network sensors cover multiple hosts, and because a host may not react to traffic sent across the network. At the same time, network data is of relatively low value compared to its volume—more records have to be observed to find out what happened, and it’s often hard to determine whether a host actually responded to network traffic. Network sensors can aid in discovery and serve as a fallback to host-based sensors when that information is not available.
Actions: What a Sensor Does with Data
A sensor’s action describes how the sensor interacts with the data it collects. A sensor can take one of three basic actions:
Report
Simply provide information on all phenomena that the sensor observes. Reporting sensors are simple and important for baselining. They are also useful for developing signatures and alerts for phenomena that alerting and blocking sensors haven’t yet been configured to recognize. Reporting sensors include NetFlow collectors, tcpdump, and server logs.
Event
An event sensor differs from a report sensor in that it consumes multiple data to produce an event that summarizes some subset of that data. For example, a host-based intrusion detection system might examine a memory image, find a malware signature in memory, and send an event indicating that its host was compromised by malware. At their most extreme, event sensors are black boxes that produce events in response to internal processes developed by experts. Event sensors include IDS and antivirus (AV).
Control
A controlling sensor, like an event sensor, consumes multiple data and makes a judgment about that data before reacting. Unlike an event sensor, a controlling sensor modifies or blocks traffic when it sends an event. Controlling sensors include IPSes, firewalls, antispam systems, and some anti-virus systems.
A sensor’s action not only affects how a sensor reports data, but also how it affects the data it’s observing. Controlling sensors can modify or block traffic. Figure 1-3 shows how these three different types of action interact with data. The figure shows the work of three sensors: R, a reporting sensor; E, an event sensor; and C, a controlling sensor. The event and control sensors are signature matching systems that react to the string ATTACK. Each sensor is placed between the Internet and a single target.
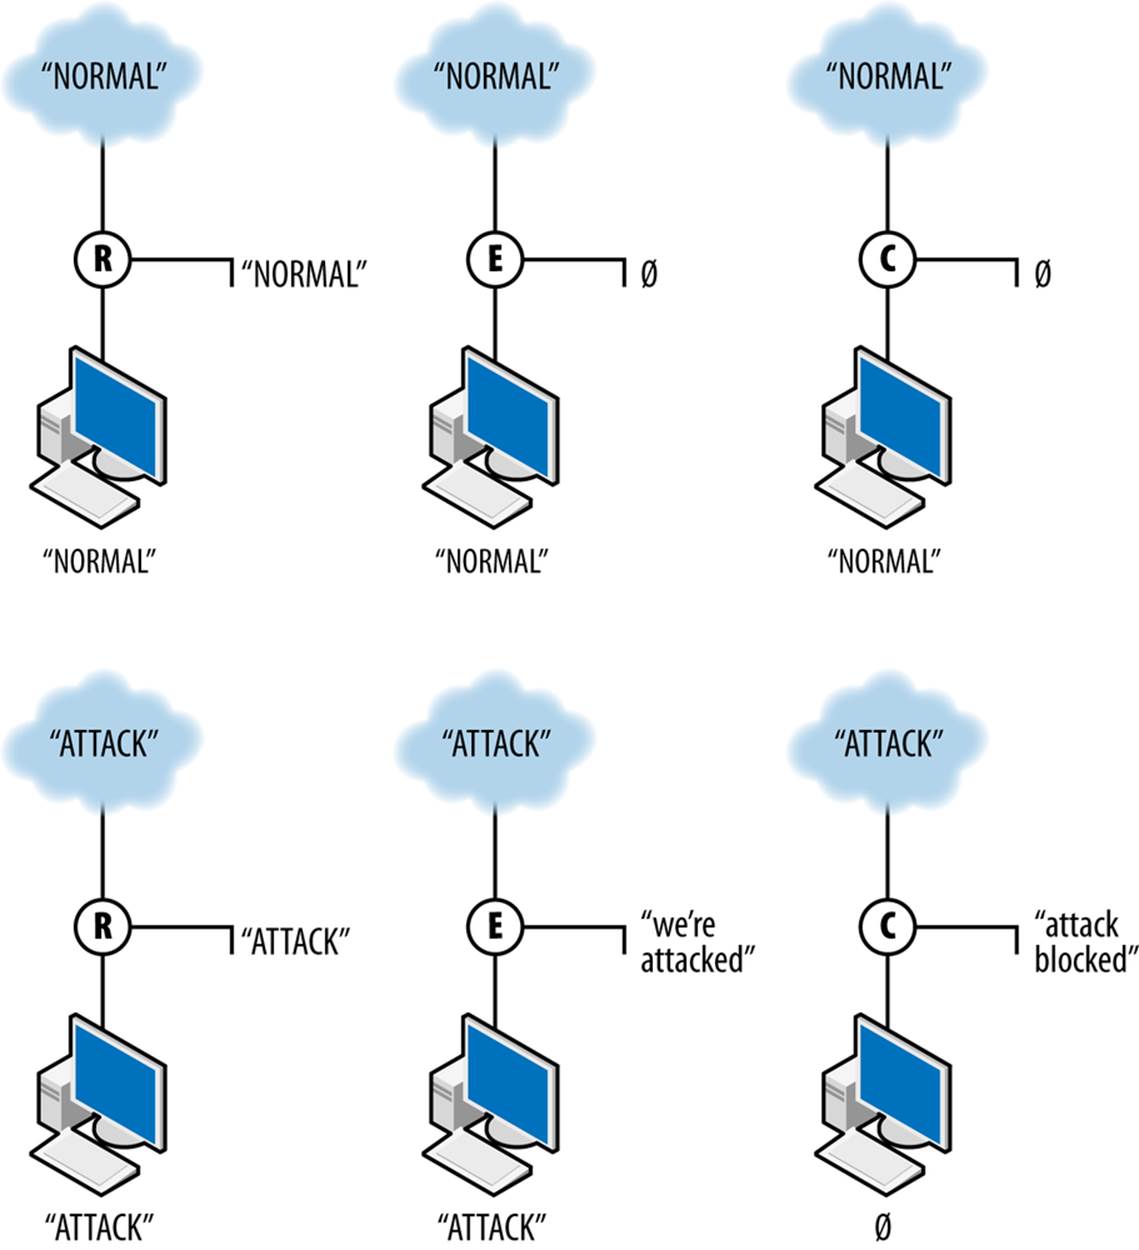
Figure 1-3. Three different sensor actions
R, the reporter, simply reports the traffic it observes. In this case, it reports both normal and attack traffic without affecting the traffic and effectively summarizes the data observed. E, the event sensor, does nothing in the presence of normal traffic but raises an event when attack traffic is observed. E does not stop the traffic; it just sends an event. C, the controller, sends an event when it sees attack traffic and does nothing to normal traffic. In addition, however, C blocks the aberrant traffic from reaching the target. If another sensor is further down the route from C, it will never see the traffic that C blocks.
AGGREGATION AND TRANSPORT TOOLS
When evaluating a logging package, make a point of checking to see if it provides software that aggregates or transports records. These capabilities don’t add data in response to phenomena, but they may modify the format and content of records.
Some examples include the use of aggregation in Cisco NetFlow and the various redirection and transport tools in flow-tools.[2] Historically, NetFlow records in their basic format (raw flows) were sent to a collector, which would then aggregate them into various reports. flow-tools provides a number of tools that can take flow data and route it to different sensors as needed.
Conclusion
The taxonomy introduced in this chapter should be sufficient to describe any sensors available for security monitoring and explain how they can potentially interact. This description is intended to be at a high enough level that an operator can start classifying sensors without getting mired in details. In Chapter 2 and Chapter 3, we discuss vantage, domain, and action in-depth in order to provide a more precise enumeration of how they relate to real systems.
[2] The flow-tools mailing list and repository are both available for free download.
All materials on the site are licensed Creative Commons Attribution-Sharealike 3.0 Unported CC BY-SA 3.0 & GNU Free Documentation License (GFDL)
If you are the copyright holder of any material contained on our site and intend to remove it, please contact our site administrator for approval.
© 2016-2026 All site design rights belong to S.Y.A.