Network Security Through Data Analysis: Building Situational Awareness (2014)
Part I. Data
Chapter 3. Host and Service Sensors: Logging Traffic at the Source
In this chapter, we consider sensors operating in the host or service domain. Host sensors include system logs as well as host-based security tools such as antivirus (AV) software and tools like McAfee’s Host Intrusion Prevention System (HIPS). Host sensors monitor the state of a host and its operating system, tracking features such as local disk usage and peripheral access. Service sensors, including HTTP server logs and mail transfer logs, describe the activity of a particular service: who sent mail to whom, what URLs were accessed in the last five minutes, activity that’s moderated through a particular service. For the sake of clarity, I will use “log” to refer to either host or service logs throughout the remainder of the chapter.
Where available, logs are often preferable to network data because they are generated by the affected process, removing the process of interpretation and guesswork often needed with network data. Host and service logs provide concrete information about events that, viewed from the network perspective, are hard to reconstruct.
Logs have a number of problems, the most important one being a management headache—in order to use one, you have to know it exists and get access to it. In addition, host-based logs come in a large number of formats, many of them poorly documented. At the risk of a sweeping generalization, the overwhelming majority of logs are designed for debugging and troubleshooting individual hosts, not to evaluate security across networks. Where possible, you’ll often need to reconfigure them to include more security-relevant information, possibly needing to write your own aggregation programs. Finally, logs are a target; attackers will modify or disable logging if possible.
Logs complement network data. Network data is good at finding blind spots, confirming the results of logs and identifying things that the logs won’t pick up. An effective security system combines both: network logs for a broad scope, logs for fine detail.
The remainder of this chapter is focused on data from a number of host logs, including system logfiles. We begin by discussing several varieties of log data and preferable message formats. We then discuss specific host and service logs: Unix system logs, HTTP server log formats, and email log formats.
Accessing and Manipulating Logfiles
Operating systems have dozens of processes generating log data at any time. In Unix systems, these logfiles are usually stored as text files in the /var/log directory. Example 3-1 shows this directory for Mac OS X (the ellipses indicate where lines were removed for clarity).
Example 3-1. A /var/log directory from a Mac OS X system
drwxr-xr-x 2 _uucp wheel 68 Jun 20 2012 uucp
...
drwxr-xr-x 2 root wheel 68 Dec 9 2012 apache2
drwxr-xr-x 2 root wheel 68 Jan 7 01:47 ppp
drwxr-xr-x 3 root wheel 102 Mar 12 12:43 performance
...
-rw-r--r-- 1 root wheel 332 Jun 1 05:30 monthly.out
-rw-r----- 1 root admin 6957 Jun 5 00:30 system.log.7.bz2
-rw-r----- 1 root admin 5959 Jun 6 00:30 system.log.6.bz2
-rw-r----- 1 root admin 5757 Jun 7 00:30 system.log.5.bz2
-rw-r----- 1 root admin 5059 Jun 8 00:30 system.log.4.bz2
-rw-r--r-- 1 root wheel 870 Jun 8 03:15 weekly.out
-rw-r----- 1 root admin 10539 Jun 9 00:30 system.log.3.bz2
-rw-r----- 1 root admin 8476 Jun 10 00:30 system.log.2.bz2
-rw-r----- 1 root admin 5345 Jun 11 00:31 system.log.1.bz2
-rw-r--r-- 1 root wheel 131984 Jun 11 18:57 vnetlib
drwxrwx--- 33 root admin 1122 Jun 12 00:23 DiagnosticMessages
-rw-r----- 1 root admin 8546 Jun 12 00:30 system.log.0.bz2
-rw-r--r-- 1 root wheel 108840 Jun 12 03:15 daily.out
-rw-r--r-- 1 root wheel 22289 Jun 12 04:51 fsck_hfs.log
-rw-r----- 1 root admin 899464 Jun 12 20:11 install.log
Note several features of this directory. The system.log files are started daily at 0030 and are differentiated numerically. There are a number of subdirectories for handling various services. Check the configuration of each individual service you want to acquire logfiles for, but it’s not uncommon for Unix systems to dump them to a subdirectory of /var/log by default.
Unix logfiles are almost always plain text. For example, a brief snippet of a system log reads as follows:
$ cat system.log
Jun 19 07:24:49 local-imac.home loginwindow[58]: in pam_sm_setcred(): Done
getpwnam()
Jun 19 07:24:49 local-imac.home loginwindow[58]: in pam_sm_setcred(): Done
setegid() & seteuid()
Jun 19 07:24:49 local-imac.home loginwindow[58]: in pam_sm_setcred():
pam_sm_setcred: krb5 user admin doesn't have a principal
Jun 19 07:24:49 local-imac.home loginwindow[58]: in pam_sm_setcred(): Done
cleanup3
The majority of Unix system logs are text messages created by filling in templates with specific event information. This kind of templated text is easy to read, but doesn’t scale very well.
As of Vista, Windows has extensively revamped their logging structure. Windows recognizes two classes of logfiles: Windows logs and application/service logs. Windows logs are further subdivided into five classes:
Application log
The application log contains messages from individual applications. Note that services such as IIS may use auxiliary logs to contain additional information.
Security log
Contains security events, such as logon attempts and audit policy changes.
System log
Messages about system status, such as driver failures.
Forwardedevents log
Stores events from remote hosts.
These logs are recorded in %SystemRoot%\System32\Config by default on most Windows installs; however, the more effective mechanism for accessing and reading the files is to use the Windows Event Viewer, as seen in Figure 3-1.
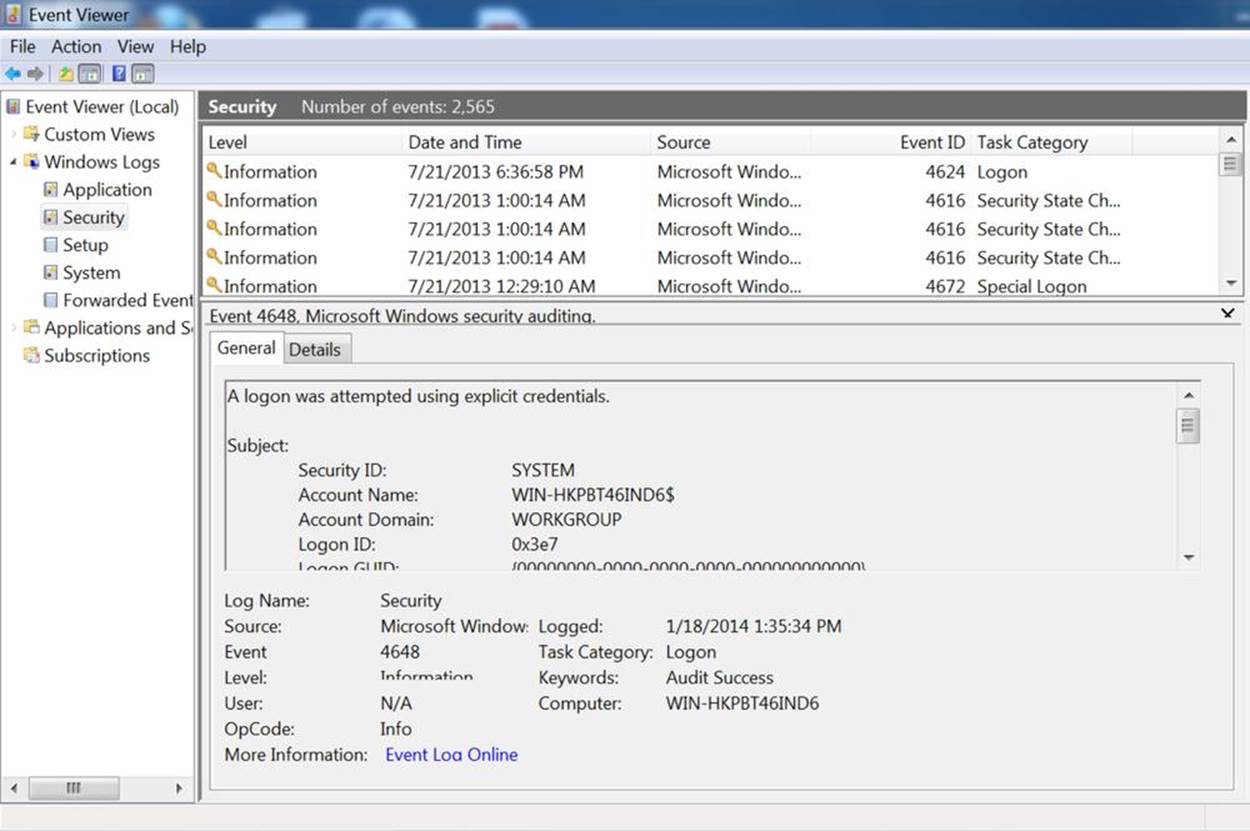
Figure 3-1. The Windows event log
Note the use of the Event ID in Figure 3-1; as with Unix systems, the Windows event messages are templated text, though Windows explicitly identifies the type of event using a unique numeric code. These messages are accessible from Microsoft’s website.
Application logfiles are much less consistently located. As seen in the /var/log directory, administrative structure may be set up to record a logfile in a fixed location, but almost every application has the ability to move around logfiles as necessary. When working with a particular application, consult its documentation to find out where it drops logs.
The Contents of Logfiles
Logs are usually designed to provide debugging and troubleshooting information for an administrator on the host. Because of this, you will often find that host-based logs require both some degree of parsing and some degree of reorganization to make them satisfactory security logs. In this section, we discuss mechanisms for interpreting, troubleshooting, and converting host log data.
The Characteristics of a Good Log Message
Before discussing how to convert a log message, and before complaining about how bad most log messages are, it behooves us to describe what a good security message should look like. A good security log should be descriptive, it should be relatable to other data, and it should be complete.
A descriptive message is one that contains enough information for an analyst to identify all necessary accessible resources for the event described by the message. For example, if a host log records that a user attempted to illegally access a file, it should contain the user’s ID and the file accessed. A host log recording a change in group permissions for a user needs to record the user and the group. A log recording a failed remote login attempt should include the ID that attempted the login and the address that attempted the login.
For example, consider a log message about a failed login attempt on host 192.168.2.2, local name myhost. A nondescriptive message would look like this:
Mar 29 11:22:45.221 myhost sshd[213]: Failed login attempt
This message doesn’t tell me anything about why the failure occurred and doesn’t provide any information to differentiate between this and any other failed login attempts. I have no information on the target of the attack; is it against the admin account or some user? Analysts with only this information will have to reconstruct the attempt solely from timing data, and they can’t even be sure what host was contacted because the name of the host is nondescriptive and there is no addressing information.
A more descriptive message would look like this:
Mar 29 11:22:45.221 myhost (192.168.2.2) sshd[213]: Failed
login attempt from host 192.168.3.1 as 'admin',
incorrect password
A good mental exercise for building a descriptive message is to fall back to the “five Ws and one H” approach from investigation and journalism: who, what, when, where, why, and how. The nondescriptive log message answers what (failed login) and when, and provides a partial answer where (myhost). The descriptive log message answers who (192.168.3.1 as admin), why and how (incorrect password), and provides a better where.
A relatable message is one where the event is easily related to information from other sources. For host-based events, this requires IP address and timing information including whether an event was remote or physically local, if the event was remote, the IP address and port of the remote event, and the IP address and port of the host. Relatability is a particular headache when dealing with service logs, as these types of logs often introduce additional addressing schemes on top of IP. For example, here’s an unrelatable mail log message:
Mar 29 11:22:45.221 myhost (192.168.2.2) myspamapp[213]:
Message <21394.283845@spam.com> title 'Herbal Remedies and Tiny Cars'
from 'spammer@spam.com' rejected due to unsolicited commercial content
The message has a lot of information, but it has no way to relate the message sent back to a particular IP address that sent the message. When looking at log messages, consider how you will relate this information to other sources, particularly network traffic. A more relatable message would be as follows:
Mar 29 11:22:45.221 myhost (192.168.2.2) myspamapp[213]:
Message <21394.283845@spam.com> title 'Herbal Remedies and Tiny Cars'
from 'spammer@spam.com' at SMTP host 192.168.3.1:2034 rejected due
to unsolicited commercial content
This example includes client port and addressing information, so I can now relate it to network traffic.
A complete log message is one that contains all the information about a particular event within that single log message. Completeness reduces the number of records an analyst has to search through and provides the analyst with a clear indicator that there is no further information to acquire from this process. Incomplete messages are usually a function of complicated process. For example, an antispam tool might run several different filters on a message, with each filter and the final decision being a separate log line. For example:
Mar 29 11:22:45.221 myhost (192.168.2.2) myspamapp[213]:
Received Message <21394.283845@spam.com> title
'Herbal Remedies and Tiny Cars' from 'spammer@spam.com' at
SMTP host 192.168.3.1:2034
Mar 29 11:22:45.321 myhost (192.168.2.2) myspamapp[213]:
Message <21394.283845@spam.com> passed reputation filter
Mar 29 11:22:45.421 myhost (192.168.2.2) myspamapp[213]:
Message <21394.283845@spam.com> FAILED Bayesian filter
Mar 29 11:22:45.521 myhost (192.168.2.2) myspamapp[213]:
Message <21394.283845@spam.com> Dropped
With incomplete messages, you have to track state across multiple messages, each of which gives a snippet of information and which you’re going to have to group together to do any useful analysis. Consequently, I prefer the message to be aggregated at the start, like this:
Mar 29 11:22:45.521 myhost (192.168.2.2) myspamapp[213]:
Received Message <21394.283845@spam.com> title
'Herbal Remedies and Tiny Cars' from 'spammer@spam.com' at
SMTP host 192.168.3.1:2034 reputation=pass Bayesian=FAIL decision=DROP
Log messages are often only minimally modifiable directly. Instead, to build an effective message you might have to write some kind of logging shim. For example, if the log system outputs syslog messages, you can receive and parse those messages, convert them to a friendlier format, and then forward them on. When considering converting logfiles, in addition to the rules above, consider the following:
Convert time to epoch time
Almost all record correlation involves identifying the same phenomenon from different sensors, meaning that you need to look for records that are close in time. Converting all time values to epoch time reduces parsing complexity, throws out the nightmare of time zones and daylight saving time, and ensures a consistent treatment for a consistent value.
Make sure sensors are synchronized
A corrollary to the first note; make sure that when sensors report the same event, they are reporting the same time. Trying to correct for this after the fact is terribly difficult, so make sure that all the sensors are coordinated, that they all report the same time, and that the clocks are corrected and resynchronized regularly.
Include addressing information
Wherever possible, include the flow five-tuple (source IP, destination IP, source port, destination port, protocol). If some of the values can be inferred from the record (e.g., HTTP servers are running TCP), they can be dropped.
Ensure that delimiters are understood by the logger
On several occasions, I have encountered helpful administrators reconfiguring HTTP logs to use pipes rather than spaces as delimiters. A worthy sentiment, except when the logging module doesn’t know to escape the pipe when it occurs in text. If the logger can change its delimiter and understands that the change requires escaping the character, let the logger do it.
Use error codes rather than text if possible
Text doesn’t scale well—it’s bulky, difficult to parse, and often repetitive. Logging systems that generate template messages can also include an error code of some kind as a compact representation of the message. Use this rather than text to save space.
Existing Logfiles and How to Manipulate Them
We can break logfiles into three major categories: columnar, templated, or annotative. Columnar logs record records in discrete columns that are distinguishable by delimiters or fixed text width. Templated logfiles look like English text, but the text comes from a set of document templates and is enumerable. Annotative logfiles use multiple text records to describe a single event.
Columnar data, such as HTTP’s CLF format, records one message per event. This message is a summary of the entire event, and consists of a fixed set of fields in columnar format. Columnar logs are relatively easy to deal with as the fields are cleanly delineated and the format is rigid; every message has the same columns and the same information.
When dealing with columnar data, keep in mind the following:
§ Is the data delimited or fixed-width? If it’s fixed-width, are there fields that could conceivably exceed that width, and if so, are the results truncated or is the column expanded?
§ If the data is delimited, is the delimiter escaped when used in the fields? Customizable formats (such as HTTP logs) may use a default delimiter and automatically escape it; if you decide to use your own delimiter, it probably won’t be automatically escaped.
§ Is there a maximum record length? If there is a maximum record length, you may encounter truncated messages with missing fields.
ELF and CLF logfiles, discussed later in this chapter, are good examples of columnar formats.
Templated text messages record one message per event, but the events are recorded as unformatted English text. The messages are templated in the sense that they come from a fixed and enumerable set of templates. Where possible, it’s best to convert templated text messages into some kind of indexed numeric format. In the best case, this is at least partly done. For example, the Windows Event Log shown in Figure 3-1 has an Event ID that describes the type of event and can be used to determine the other arguments that will be provided.
When dealing with templated text, keep in mind the following:
§ Can you get a complete list of the log messages? As an example, consider the Windows logfile in Figure 3-1. Each of these messages is text, but it has a unique integer ID for the message. Check the documentation for a list of all potential log messages.
CONVERTING TEXT TO COLUMNS
Templated text can be parsed; the messages belong to an enumerable set and can conceivably be converted into a columnar format. Creating such a system, however, requires developing an intermediary application that can read the text, parse each individual message, and deposit the result in a schema. Doing so is a nontrivial development task (and will have to be updated when new messages are developed), but it also can reduce the amount of space required and increase the readability of the data.
1. From whatever documentation you can find on the text format, identify and select the messages most relevant to security. Any conversion script is going to consist of a bunch of regular expressions, and the fewer expressions you have to maintain, the happier you’ll be.
2. For each message, identify the parameters it contains. As an example, consider the following made-up templated messages: “Antispam tool SPAMKILLER identifies email <12938@yahoo.com> as Spam,” “Antispam tool SPAMKILLER identifies email <12938@yahoo.com> as Commercial,” “Antispam tool SPAMKILLER identifies email <12938@yahoo.com> as Legitimate.” There are three potential parameters here: the name of the antispam tool (enumerable), the message ID (a string), and the output (enumerable).
3. Once you’ve identified parameters for each potential message, merge the parameters to create a superset. The goal of this stage is to create a schema representation of all the parameters that a message may potentially have; a particular message may not have all of them.
4. Try to generate at least one event record for every templated message. Documentation can be inaccurate.
In annotative logs, a single event is split across multiple messages unified through a common ID. Event logs, system logs, and antispam may all potentially use this format. Annotative logs spread an event across multiple messages, and effectively parsing them requires identifying the common identifier, pulling all of those messages, and dealing with the potential for missing messages.
Representative Logfile Formats
In this section, we discuss several common log formats, including ELF and CLF, the standard log formats for HTML messages. The formats discussed here are customizable, and we provide guidelines for improving the log messages in order to provide more security-relevant information.
HTTP: CLF and ELF
HTTP is the modern Internet’s reason for existence, and since its development in 1991, it has metamorphosed from a simple library protocol into the Internet’s glue. Applications for which, 10 years ago, a developer would have implemented a new protocol are now routinely offloaded to HTTP and web servers.
HTTP is a challenging protocol to nail down. The core protocol is incredibly simple, but any modern web browsing session involves combining HTTP, HTML, and JavaScript to create ad hoc clients of intense complexity. In this section, we briefly discuss the core components of HTTP with a focus on the analytical aspects.
HTTP is fundamentally a very simple file access protocol. To understand how simple it is today, try the exercise in Example 3-2 using netcat. netcat (which can also be invoked as nc, perhaps because administrators find it so useful that they want to make it easy to invoke) is a flexible network port access tool that can be used to directly send information to ports. It is handy for scripting and capable of a variety of tasks with minimum automation.
Example 3-2. Accessing an HTTP server using the command line
host$ echo 'GET /' | nc www.oreilly.com 80 > oreilly.html
host$ kill %1
Executing the command in the previous example should produce a valid HTML file. In its simplest, most unadorned form, HTTP sessions consist of opening up a connection, passing a method and a URI, and receiving a file in return.
HTTP is simple enough to be run at the command line by hand if need be—however, that also means that an enormous amount of functionality is handed over to optional headers. When dealing with HTTP logs, the primary challenge is deciding which headers to include and which to ignore.
HTTP HEADERS WORTH NOTING
There are well over a hundred unique HTTP headers, tracked in RFC 4229. Of these, a limited number are particularly critical to track. These include:
Cookie
The Cookie header describes the contents of HTTP cookies sent by the client to the server.
Host
The Host header defines the name of the host that the client is contacting. This is critical when dealing with virtually hosted HTTP servers—that is, multiple servers at the same IP address differentiated by their domain name.
Referer
The Referer (sic) header includes the URL of the web page containing the link that initiated this request.
User-Agent
The User-Agent header provides information on the HTTP client, generally the type of client and the build.
There are two standards for HTTP log data: common log format (CLF) and extended log format (ELF). Most HTTP log generators (such as Apache’s mod_log) provide extensive configuration options.
CLF is a single-line logging format developed by NCSA for the original HTTP server; the W3C provides a minimal definition of the standard. A CLF event is defined as a seven-value single-line record in the following format:
remotehost rfc931 authuser [date] "request" status bytes
Where remotehost is the IP name or address of the remote host, rfc931 is the remote login account name of the user, authuser is the user’s authenticated name, date is the date and time of the request, request is the request, status is the HTTP status code, and bytes is the number of bytes.
Pure CLF has several eccentricities that can make parsing problematic. The rfc931 and authuser fields are effectively artifacts; in the vast majority of the CLF records, the fields will be set to “–”. The actual format of the date value is unspecified and can vary between different HTTP server implementations.
A common modification of CLF is Combined Log Format. The Combined Log Format adds two additional fields to CLF: the HTTP referer field and the user-agent string.
ELF is an expandable columnar format that has largely been confined to IIS, although tools such as Bluecoat also use it for logging. As with CLF, the W3C maintains the standard on their website.
An ELF file consists of a sequence of directives followed by a sequence of entries. Directives are used to define attributes common to the entries, such as the date of all entries (the Date directive), and the fields in the entry (the Fields directive). Each entry in ELF is a single HTTP request, and the fields that are defined by the directive are included in that entry.
ELF fields come in one of three forms: identifier, prefix-identifier, or prefix(header). The prefix is a one or two character string that defines the direction the information took (c for client, s for server, r for remote). The identifier describes the contents of the field, and the prefix(header) value includes the corresponding HTTP header. For example, cs-method is in the prefix-identifier format and describes the method sent from client to server, while time is a plain identifier denoting the time at which the session ended.
Example 3-3 shows simple outputs from CLF, Combined Log Format, and ELF. As the example shows, each event is a single line.
Example 3-3. Examples of CLF and ELF
#CLF
192.168.1.1 - - [2012/Oct/11 12:03:45 -0700] "GET /index.html" 200
1294
# Combined Log Format
192.168.1.1 - - [2012/Oct/11 12:03:45 -0700] "GET /index.html" 200 1294
"http://www.example.com/link.html" "Mozilla/4.08 [en] (Win98; I ;Nav)"
#ELF
#Version: 1.0
#Date: 2012/Oct/11 00:00:00
#Fields: time c-ip cs-method cs-uri
12:03:45 192.168.1.1 GET /index.html
Most HTTP logs are some form of CLF output. Although ELF is an expandable format, I find the need to carry the header around problematic in that I don’t expect to change formats that much, and would rather that individual log records be interpretable without this information. Based on principles I discussed earlier, here is how I modify CLF records:
1. Remove the rfc931 and authuser fields. These fields are artifacts and waste space.
2. Convert the date to epoch time and represent it as a numeric string, In addition to my general disdain for text over numeric representations, time representations have never been standardized in HTTP logfiles. You’re better off moving to a numeric format to ignore the whims of the server.
3. Incorporate the server IP address, the source port, and the destination port. I expect to move the logfiles to a central location for analysis, so I need the server address to differentiate them. This gets me closer to a five-tuple that I can correlate with other data.
4. Add the duration of the event, again to help with timing correlation.
5. Add the host header. In case I’m dealing with virtual hosts, this also helps me identify systems that contact the server without using DNS as a moderator.
COOKBOOK: CREATING LOGFILES
Log configuration in Apache is handled via the mod_log_config module, which provides the ability to express logs using a sequence of string macros. For example, to express the default CLF format, you specify it as:
LogFormat "%h %l %u %t \"%r\" %>s %b"
Combined Log Format is expressed as:
LogFormat "%h %l %u %t \"%r\" %>s %b \"%{Referer}i\" \"%{User-agent}i\""
While my extended format contains the hostname, local IP address, server port, epoch time, request string, request status, response size, response time, referer, user-agent string, and host from the request:
LogFormat "%h %A %p %{msec}t \"%r\" %>s %b %T \"%{Referer}i\"
\"${User-Agent}i\" \"${Host}i\""
Logging in nginx is controlled with HttpLogModule, which uses a similar log_format directive. To configure CLF, specify it with:
log_format clf $remote_addr - $remote_user [$time_local] "$request"
$status $body_bytes_sent;
Combined Log Format is defined as follows:
log_format combined $remote_addr - $remote_user [$time_local] "$request"
$status $body_bytes_sent "$http_referer" "$http_user_agent";
My extended format is defined as:
log_format extended $server_addr $remote_addr $remote_port $msec
"$request$" $status $body_bytes_sent $request_time $http_referer
$http_user_agent $http_host
SMTP
SMTP log messages vary by the MTA used and are highly configurable. In this section, we discuss two log formats that are representative of the major Unix and Windows families: sendmail and Microsoft Exchange.
In this section, we focus on logging the transfer of email messages. The logging tools for these applications provide an enormous amount of information about the server’s internal status, connection attempts, and other data that, while enormously valuable, requires a book of its own.
Sendmail moderates mail exchange through syslog, and consequently is capable of sending an enormous number of informational messages besides the actual email transaction. For our purposes, we are concerned with two classes of log messages: messages describing connections to and from the mail server, and messages describing actual mail delivery.
By default, sendmail will send messages to /var/maillog, although the logging information it sends is controlled by sendmail’s internal logging level. Sendmail uses its own internal logging level ranging from 1 to 96; a log level of n logs all messages of severity 1 to n. Notable log levels include 9 (all message deliveries logged), 10 (inbound connections logged), 12 (outbound connections logged), and 14 (connection refusals logged). Of note is that anything above log level 8 is considered an informational log in syslog, and anything above 11 a debug log message.
A sendmail log line consists of five fixed values, followed by a list of one or more equates:
<date> <host> sendmail[<pid>]: <qid>: <equates>
Where <date> is the date, <host> is the name of the host, sendmail is a literal string, <pid> is the sendmail process ID, and the <qid> is an internal queue ID used to uniquely identify messages. Sendmail sends at least two log messages when sending an email message, and the only way to group those messages together is through the qid. Equates are descriptive parameters given in the form <key>=<value>. Sendmail can send a number of potential equates, listed in Table 3-1 for messages.
For every email message received, sendmail generates at least two log lines. The first line is the receiver line, and describes the message’s point of origin. The final line, the sender line, describes the disposition of the mail: sent, quarantined, and where it was delivered to.
Table 3-1. Relevant sendmail equates
|
Equate |
Description |
|
arg1 |
Current sendmail implementations enable internal filtering using rule sets; arg1 is the argument passed to the ruleset. |
|
from |
The from address of the envelope. |
|
msgid |
The message ID of the email. |
|
quarantine |
If sendmail quarantines a mail, this is the reason it was held. |
|
reject |
If sendmail rejects a mail, this is the reason for rejection. |
|
relay |
This is the name and address of the host that sent the message; in recipient lines, it’s the host that sent it, in sender lines, the host that received it. |
|
ruleset |
This is the ruleset that processed the message, and provides the justification for rejecting, quarantining, or sending the message. |
|
stat |
The status of a message’s delivery. |
|
to |
The email address of a target; multiple to equates can appear in the same line. |
Sendmail will take one of four basic actions with a message: reject it, quarantine it, bounce it, or send it. Rejection is implemented by message filtering and is used for spam filtering; a rejected message is dropped. Quarantined messages are moved off the queue to a separate area for further review. A bounce means the mail was not sent to the target, and results in a nondelivery report being sent back to the origin.
MANAGING EMAIL RULES AND FILTERING
Email traffic analysis is complicated, largely because email is attacked constantly (via spam), and there’s a constantly escalating war between spammers and defenders. Even in a relatively small enterprise, it’s easy to build a complex defensive infrastructure with relatively little work. In addition to the spam and defensive issues, email operates in its own little world—the IP addresses logged by email infrastructure are pretty much exclusively used by the email infrastructure.
As usual, the first step in email instrumentation is figuring out how email is routed. Is there some kind of dedicated antispam hardware at the gateway, such as a Barracude or an IronPort box? How many SMTP servers are there, and how do they connect to the actual email servers (POP, IMAP, Eudora, Exchange)? Figure out where a mail message will be sent if it’s correctly routed, quarantined, rejected, or bounced. If webmail is available, figure out where it actually is; where is the webmail server, what’s the route to SMTP, etc.
Once you’ve identified the hardware, figure out what blocking is going on. Blocking techniques include black-box sources (such as AV or IronPort’s reputation service), public blacklists such as SpamHaus’s SBL, and internal rules. Each requires a little different treatment.
Since black-box detection systems are basically opaque, it’s important to track what version of the system’s knowledge base is being used and when the system is updated; verifying updates with network monitoring is a good idea. If you have multiple instances of the same detector, make sure that their updates are coordinated.
Most blacklist services are publically accessible. Knowing which organization runs the blacklist, the frequency of its updates, and the delivery mechanisms are all good things. As with AV, verifying communications (particularly if its a DNSBL) is also a good thing.
Internal monitoring should be identified, audited, and kept under version control. Because these are the rules that you have the most control over, it’s also a good idea to compare them to the rest of your blocking infrastructure and see what can be pushed out of the email system. If you’re blocking a particular address, for example, you might be better off blocking at the router or the firewall.
Email works within its own universe, and the overwhelming majority of IP addresses recorded in email logs are the addresses of other email servers. To that end, while SMTP tracking is important, it’s often the case that to fully figure out what happened with a message, you also need to track the IMAP or POP3 servers.
Microsoft Exchange: Message Tracking Logs
Exchange has one master log format for handling messages, the Message Tracking Log (MTL).
Table 3-2. MTL fields
|
Field name |
Description |
|
date-time |
ISO 8601 representation of the date and time format. |
|
client-ip |
The IP address of the host that submitted the message to the server. |
|
client-hostname |
The client_ip’s FQDN. |
|
server-ip |
The IP address of the server. |
|
server-hostname |
The server_ip’s FQDN. |
|
source-context |
This is optional information about the source, such as an identifier for the transport agent. |
|
connector-id |
The name of the connector. |
|
source |
Exchange enumerates a number of source identities for defining the origin of a message, such as an inbox rule, a transport agent, or DNS. The source field will contain this identity. |
|
event-id |
The event type. This is also an enumerable quantity, and includes a number of status messages about how the message was handled. |
|
internal-message-id |
This is an internal integer identifier used by Exchange to differentiate messages. The ID is not shared between Exchange servers, so if a message is passed around, this value will change. |
|
message-id |
This is the standard SMTP message ID. Exchange will create one if the message does not already have one. |
|
network-message-id |
This is a message ID like _internal-message-id+ except that it is shared across copies of the message and created when a message is cloned or duplicated, such as when it’s sent to a distribution list. |
|
recipient-address |
The addresses of the recipients; this is a semicolon-delimited list of names. |
|
recipient-status |
This is a per-recipient status code indicating how each recipient was handled |
|
total-bytes |
The total size of the message in bytes. |
|
recipient-count |
The size of recipient-address in terms of number of recipients. |
|
related-recipient-address |
Certain Exchange events (such as redirection) will result in additional recipients being added to the list; those addresses are added here. |
|
reference |
This is message-specific information; the contents are a function of the type of message (defined in event-id). |
|
message-subject |
The subject found in the Subject: header. |
|
sender-address |
The sender, as specified in the Sender: header; if Sender: is absent, From: is used instead. |
|
return-path |
The return email address, as specified in Mail From:. |
|
message-info |
Event-type dependent message information. |
|
directionality |
The direction of the message; an enumerable quantity. |
|
tenant-id |
No longer used. |
|
original-client-ip |
The IP address of the client. |
|
original-server-ip |
The IP address of the server. |
|
custom-data |
Additional data dependent on the type of event. |
Logfile Transport: Transfers, Syslog, and Message Queues
Host logs can be transferred off their hosts in a number of ways dependending on how the logs are generated and on the capabilities of the operating system. The most common approaches involve using regular file transfers or the syslog protocol. A newer approach uses message queues to transport log information.
Transfer and Logfile Rotation
Most logging applications write to a rotating logfile (see, for example, the rotated system logs in Accessing and Manipulating Logfiles). In these cases, the logfile will be closed and archived after a fixed period and a new file started. Once the file is closed, it can be copied over to a different location to support analytics.
File transfer is simple. It can be implemented using ssh or any other copying protocol. The major headache is ensuring that the files are actually complete when copied; the rotation period for the file effectively dictates your response time. For example, if a file is rotated every 24 hours, then you will, on average, have to wait a day to get a hold of the latest events.
Syslog
The grandfather of systematic system logging utilities is syslog, a standard approach to logging originally developed for Unix systems that now comprises a standard, a protocol, and a general framework for discussing logging messages. Syslog defines a fixed message format and the ability to send that message to logger daemons that might reside on the host or be remotely located.
All syslog messages contain a time, a facility, a severity, and a text message. Table 3-3 and Table 3-4 describe the facilities and priorities encoded in the syslog protocol. As Table 3-3 shows, the facilities referred to by syslog comprise a variety of fundamental systems (some of them largely obsolete). Of more concern is what facilities are not covered—DNS and HTTP, for example. The priorities (in Table 3-4) are generally more germane, as the vocabulary for their severity has entered into common parlance.
Table 3-3. syslog facilities
|
Value |
Meaning |
|
0 |
Kernel |
|
1 |
User-level |
|
2 |
|
|
3 |
System daemons |
|
4 |
Security/Authorization |
|
5 |
Syslogd |
|
6 |
Line printer |
|
7 |
Network news |
|
8 |
UUCP |
|
9 |
Clock daemon |
|
10 |
Security/Authorization |
|
11 |
ftpd |
|
12 |
ntpd |
|
13 |
Log audit |
|
14 |
Log alert |
|
15 |
Clock daemon |
|
16-23 |
Reserved for local use |
Table 3-4. syslog priorities
|
Value |
Meaning |
|
0 |
Emergency: system is unusable |
|
1 |
Alert: action must be taken immediately |
|
2 |
Critical: critical conditions |
|
3 |
Error: error conditions |
|
4 |
Warning: warning conditions |
|
5 |
Notice: normal but significant condition |
|
6 |
Informational: informational messages |
|
7 |
Debug: debugging information |
Syslog’s reference implementations are UDP-based, and the UDP standard results in several constraints. Most important, UDP datagram length is constrained by the MTU of the layer 2 protocol carrying the datagram, effectively imposing a hard limit of about 1,450 characters on any syslog message. The syslog protocol itself specifies that messages should be less than 1,024 characters, but this is rarely observed while the UDP cutoff will affect long messages. In addition, syslog runs on top of UDP, which means that when messages are dropped, they are lost forever.
The easiest way to solve this problem is to use TCP-based syslog, which is implemented in the open source domain with tools such as syslog-ng and rsyslog. Both of these tools provide TCP transport, as well as a number of other capabilities such as database interfaces, the ability to rewrite messages en route, and selective transport of syslog messages to different receivers. Windows does not support syslog natively, but there exist a number of commercial applications that provide similar functionality.
CEF: THE COMMON EVENT FORMAT
Syslog is a transport protocol—it doesn’t specify anything about the actual contents of a message. A number of different organizations have attempted to develop interoperability standards for security applications, such as Common Intrusion Detection Framework (CIDF) and Intrusion Detection Message Exchange Format (IDMEF). None of them have achieved serious industry acceptance.
What has been accepted widely is CEF. Originally developed by ArcSight (now part of Hewlett-Packard) to provide sensor developers with a standard format in which to send messages to their SIEM. CEF is a record format that specifies events using a numeric header and a set of key/value pairs. For example, a CEF message for an attack from host 192.168.1.1 might look like this:
CEF:0|My Attack Detector|Test|1.0|1000|Attack|5|src=192.168.1.1
CEF is transport-agnostic, but the majority of CEF implementations use syslog as their transport of choice. The actual specification and key/value assignments are available from HP.
Further Reading
1. Richard Bejtlich, The Practice of Network Security Monitoring: Understanding Incident Detection and Response (No Starch Press, 2013).
2. Anton Chuvakin, Logging and Log Management: The Authoritative Guide to Dealing with Syslog, Audit Logs, Alerts, and other IT ‘Noise’ (Syngress, 2012).
All materials on the site are licensed Creative Commons Attribution-Sharealike 3.0 Unported CC BY-SA 3.0 & GNU Free Documentation License (GFDL)
If you are the copyright holder of any material contained on our site and intend to remove it, please contact our site administrator for approval.
© 2016-2026 All site design rights belong to S.Y.A.