Network Security Through Data Analysis: Building Situational Awareness (2014)
Part II. Tools
Chapter 7. Classification and Event Tools: IDS, AV, and SEM
This chapter focuses on the development and use of event-based sensors such as intrusion detection systems (IDSes). These systems include passive sensors such as IDSes and most AVs, as well as active systems such as firewalls. Analytically, they all behave similarly—they analyze data and create events in response to that data. Event construction is what differentiates an IDS from a simple reporting sensor such as NetFlow. Simple sensors report everything they observe, while an IDS or other classifying sensor is configured to report only on specific phenomena that it infers from the data it observes.
Many analytic processes will eventually result in some form of IDS. For example, you might want to develop a system detecting abusive activity on a host. Using some of the math in Part III, you build up a model of abusive activity, create some thresholds, and raise an alert whenever there’s a threshold.
The problem is that these processes almost never work as intended. Operational IDS systems are very hard to implement properly. The problem is not detection; the problem is context and attribution. IDS systems are easily, and usually, configured into uselesness. Either they produce so many alarms that analysts ignore them, or they’re configured to produce so few alarms that they might as well not be there. Developing effective alarms requires understanding how IDSes are used operationally, how they fail as classifiers, and the impact of those failures on analysts.
This chapter is divided into two parts. The first section breaks down IDS systems and the way they’re used on floors. It discusses how IDS systems fail and how these failure modes impact analysis. The second section is focused on the construction of better detection systems, and discusses strategies to improve the efficacy of signature, and anomaly-based detection techniques.
How an IDS Works
All IDSes are expert systems of a type called a binary classifier. A classifier reads in data and marks it as one of two categories. Either the data is normal and requires no further action, or the data is characteristic of an attack. If it is an attack, then the system reacts as specified; event sensors generate an event, controllers block traffic, and so on.
An IDS system interprets data in a different way than passive sensors such as NetFlow. A simple sensor reports on everything it monitors, while an IDS only reports on events that it is configured to report on. IDSes differ based on the data they use to make this interpretation and the process they use to make this decision.
There are several problems with classification, which we can term the moral, the statistical, and the behavioral. The moral problem is that attacks can be indistinguishable from innocuous, or even permitted, user activity. For example, a DDoS attack and a flash crowd can look very similar until some time has passed. The statistical problem is that IDS systems are often configured to make hundreds or millions of tests a day—under those conditions, even low false positive rates can result in far more false positives in a day than true positives in a month. The behavioral problem is that attackers are intelligent parties interested in evading detection, and often can do so with minimal damage to their goals.
This section will discuss IDS, and often take a very pessimistic view of its capabilities. We begin with a discussion of the vocabulary of intrusion detection, then move onto the mechanics of binary classifiers, and then into the problem of engineering detection systems and the impact of classifier failures.
Basic Vocabulary
We can break IDS along two primary axes: where the IDS is placed, and how the IDS makes decisions. On the first axis, IDS is broken into Network-Based IDS (NIDS), and Host-Based IDS (HIDS). On the second axis, IDS is split between signature-based systems and anomaly-basedsystems.
An NIDS is effectively any IDS that begins with pcap data. In the open source domain, this includes systems such as Snort, Bro, and Suricata. NIDS systems operate under the constraints discussed for network sensors in Chapter 2, such as the need to receive traffic through port mirroring or direct connect to the network and an inability to read encrypted traffic.
HIDSes operate within the host domain and are usually far more varied than NIDSes. An HIDS can monitor network activity, physical access (such as whether a user is trying to use a USB device), and information from the operating system such as ACL violations or file accesses.
Figure 7-1 shows how several common IDS systems break down along these axes.
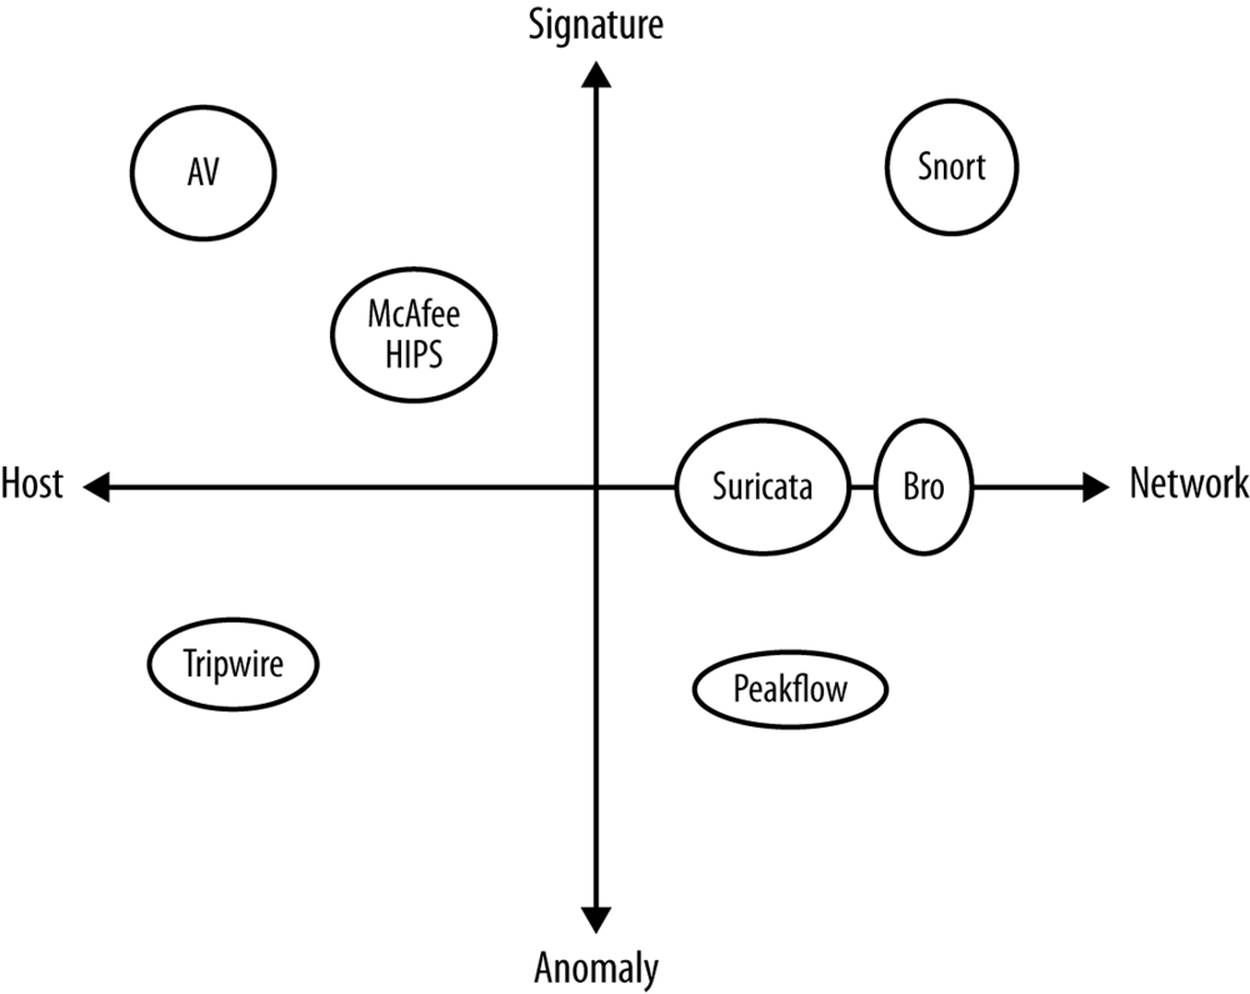
Figure 7-1. A breakdown of common IDS
Figure 7-1 shows seven examples of different IDS. These are:
Snort
The most commonly used IDS. Snort is a network-based signature matching system that uses hand-crafted Snort signatures to identify malicious traffic. Snort provides an extensive language for describing signatures and can be manually configured to add new ones.
Bro
A sophisticated traffic analysis system that can be used for intrusion detection using both signatures and anomalies. Bro is less of an IDS than a traffic analysis language. Bro has recently been redesigned to work with clusters.
Suricata
An experimental open source IDS developed by the Open Information Security Foundation with funding from the Department of Homeland Security. Suricata is the youngest IDS listed here and is used for experimentation in new techniques in intrusion detection.
Peakflow
A commercial traffic analysis package developed by Arbor Networks, Peakflow analyzes NetFlow traffic to identify and mitigate attacks such as DDoS.
Tripwire
A file integrity monitoring system. Tripwire monitors specific directories and raises events when it sees the contents of the directory change.
AV
Antivirus systems such as Symantec, ClamAV, or McAfee are the most common forms of a signature-based HIDS. AV systems examine host disk and memory for the binary signatures of malware and raise alerts when encountering suspicious binaries.
McAfee HIPS
McAfee’s host intrusion prevention (HIPS) is one of several commercial IPS packages. HIPS systems such as this one combine binary analysis with log analysis, such as examining ACL violations or suspicious file modifications.
The vast majority of IDSes are signature-based. A signature-based system uses a set of rules that are derived independently from the target in order to identify malicious behavior. For example, a Snort signature written in Snort’s rule language could look like this:
alert tcp 192.4.1.0/24 any -> $HOME_NET 22 (flow:to_server,established; \
content:"root";)
This alert is raised when traffic from a suspicious network (192.4.1.0/24) attempts to contact any host on the internal network and tries to log on as root to SSH. An HIDS may offer signatures such as “raise an alert when a user tries to delete the security log.” Ruleset creation and management is a significant issue for signature-based IDS, and well-crafted rules are often the secret sauce that differentiates various commercial packages.
A signature-based IDS will only raise alerts when it has a rule specifying to do so. This limitation means that signature-based IDSes usually have a high false negative rate, meaning that a large number of attacks go unreported by them. The most extreme version of this problem is associated with vulnerabilities. AV primarily, but also NIDS and HIDS, rely on specific binary signatures in order to identify malware (see On Code Red and Malware Evasiveness for a more extensive discussion on this). These signatures require that some expert have access to an exploit; these days, exploits are commonly “zero-day,” meaning that they’re released and in the wild before anyone has the opportunity to write a signature.
Anomaly-based IDSes are built by training (or optionally configuring) the IDS on traffic data in order to create a model of normal activity. Once this model is created, deviations from the model are anomalous, suspicious, and produce events. For example, a simple anomaly-based NIDS might monitor traffic to specific hosts and generate an event when traffic suddenly spikes upward, indicating a DDoS or other suspicious event.
Anomaly-based IDSes are used far less than signature-based IDS, primarily because they have the opposite problem of a signature-based IDS—a high false positive rate. Anomaly-based IDSes are notorious for creating alerts incessantly, and are often dialed down to produce a minimal number of alerts rather than constantly go off.
Historically, IDS systems didn’t interoperate because there wasn’t anything to interoperate with; IDS reported directly to the analyst. As security systems have become more complex, there’s a growing interest in security event management (SEM) software[9] such as ArcSight, LogRhythms, LogStash, and Splunk. An SEM is effectively a database that collects data from multiple detection systems. After it is collected, the data can be collated and compound events can be created from one or more sensors.
ON CODE RED AND MALWARE EVASIVENESS
Sometimes there’s a fine line between NIDS and AV. Read the original papers on NIDS by Paxson and Roesch and you’ll see that they were thinking about hand-crafted attacks on systems that they’d be able to defend by looking for people trying to log in as root or admin. There was a functionality change around 2001, which was the beginning of a very nasty worm-heavy era in defense. Worms like Code Red and Slammer caused widespread havoc by spreading actively and destructively choking bandwidth.
The Code Red v1 and v2 worms both exploited a buffer overflow in Microsoft IIS in order to subvert IIS processes and launch an attack against the White House. The orignal Code Red worm contained a payload looking like the following:
GET /default.ida?NNNNNNNNNNNNNNNNNNNNNNNNNNNNNNNNNNNNNNNNNNNNNNNNNNNNNNNN
NNNNNNNNNNNNNNNNNNNNNNNNNNNNNNNNNNNNNNNNNNNNNNNNNNNNNNNNNNNNNNNNNNNNNNNNN
NNNNNNNNNNNNNNNNNNNNNNNNNNNNNNNNNNNNNNNNNNNNNNNNNNNNNNNNNNNNNNNNNNNNNNNNN
NNNNNNNNNNNNNNNNNNNNNN%u9090%u6858%ucbd3%u7801%u9090%u6858%ucbd3%u7801
%u9090%u6858%ucbd3%u7801%u9090%u9090%u8190%u00c3%u0003%u8b00%u531b%u53ff
%u0078%u0000%u00=a HTTP/1.0
IDS at the time detected Code Red by looking for that specific payload, and a couple of weeks later, an updated version of the worm using the same exploit was launched. The payload for Code Red II looked like this:
GET /default.ida?XXXXXXXXXXXXXXXXXXXXXXXXXXXXXXXXXXXXXXXXXXXXXXXXXXXXXXXX
XXXXXXXXXXXXXXXXXXXXXXXXXXXXXXXXXXXXXXXXXXXXXXXXXXXXXXXXXXXXXXXXXXXXXXXXX
XXXXXXXXXXXXXXXXXXXXXXXXXXXXXXXXXXXXXXXXXXXXXXXXXXXXXXXXXXXXXXXXXXXXXXXXX
XXXXXXXXXXXXXXXXXXXXXX%u9090%u6858%ucbd3%u7801%u9090%u6858%ucbd3%u7801
%u9090%u6858%ucbd3%u7801%u9090%u9090%u8190%u00c3%u0003%u8b00%u531b%u53ff
%u0078%u0000%u00=a HTTP/1.0
As a buffer overflow, the Code Red worms needed to pad their contents in order to reach a specific memory location; the worms were often differentiated by the presence of an X or an N in the buffer. The thing is, the buffer contents are irrelevant to the execution of the worm; an attacker could change them at will without changing the functionality.
This has been a problem for IDS ever since. As originally conceived, intrusion detection systems were looking for anomalous and suspicious user behavior. These types of long term hacks could be detected and stopped because they’d be happening over the course of hours or days, which is enough time for analysts to examine the alert, vet it, and take a course of action. Modern attacks are largely automated, and the actual subversion and control of a host can take place instantaneously if the right conditions are met.
The problem of binary signature management has gotten significantly worse in the past decade because it’s easy for attackers to modify payload without changing the functionality of the worm. If you examine threat databases such as Symantec’s (see Chapter 8), you will find that there are hundreds or more variants of common worms, each of them with a different binary signature.
As for the explosive, destructive worms like Slammer, they basically calmed down for what I will best describe as evolutionary reasons. Much like it doesn’t pay a physical virus to kill its host until it’s had a chance to spread, modern worms are generally more restrained in their reproduction. It’s better to own the Internet than to destroy it.
Classifier Failure Rates: Understanding the Base-Rate Fallacy
All IDS systems are applied exercises in classification, a standard problem in AI and statistics. A classifier is a process that takes in input data and classifies the data into one of at least two categories. In the case of IDS systems, the categories are usually “attack” and “normal.”
Signature and anomaly-based IDSes view attacks in fundamentally different ways, and this impacts the type of errors they make. A signature-based IDS is calibrated to look for specific weird behaviors such as malware signatures or unusual login attempts. Anomaly-based IDSes are trained on normal behavior and then look for anything that steps outside the norm. Signature-based IDSes have high false negative rates, meaning that they miss a lot of attacks. Anomaly-based IDSes have high false positive rates, which means that they consider a lot of perfectly normal activity to be an attack.
IDSes are generally binary classifiers, meaning that they break data into two categories. Binary classifiers have two failure modes:
False positives
Also called a Type I error, this occurs when something that doesn’t have the property you’re searching for is classified as having the property. This occurs, for instance, when email from the president of your company informing you about a promotion is classified as spam.
False negatives
Also called a Type II error, this occurs when something that has the property you’re searching for is classified as not having the property. This happens, for instance, when spam mail appears in your inbox.
Sensitivity refers to the percentage of positive classifications that are correct, and specificity refers to the percentage of negative classifications that are correct. A perfect detection has perfect sensitivity and specificity. In the worst case, neither rate is above 50%: the same as flipping a coin.
Most systems require some degree of tradeoff; generally, increasing the sensitivity means also accepting a lower specificity. A reduction in false negatives will be accompanied by an increase in false positives, and vice versa.
To describe this tradeoff, we can use a visualization called a receiver operating characteristic (ROC) curve. A ROC curve plots the specificity against the false positive rates, using a third characteristic (the operating characteristic) as a control. Figure 7-2 shows an example of a ROC curve.
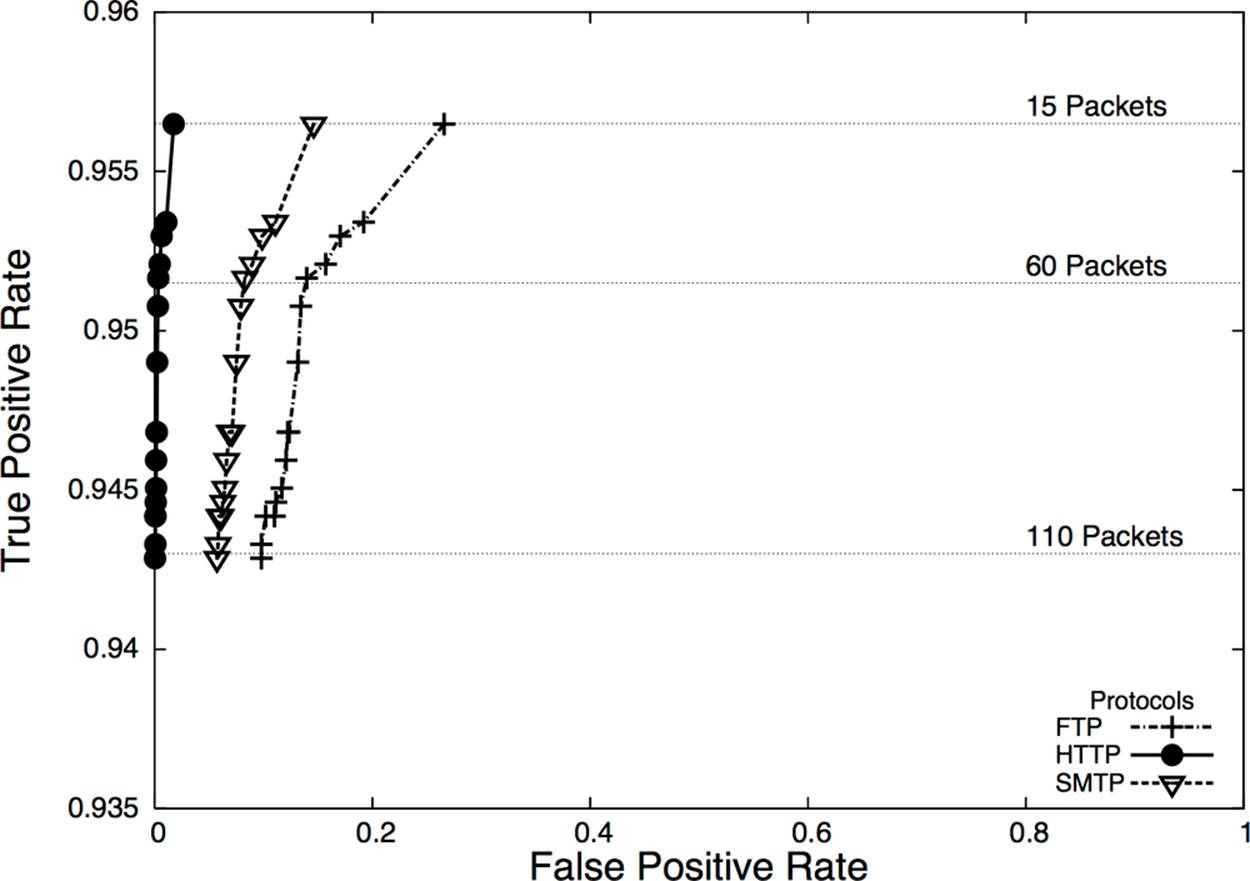
Figure 7-2. ROC curve showing packet size of messages sent for BitTorrent detection
In this case, the operating characteristic is the number of packets in a session and is shown on the horizontal lines in the plot. At this site, HTTP traffic (falling at the very left edge) has a good ratio of true to false positives, whereas SMTP is harder to classify correctly, and FTP even harder.
Now, let’s ask a question. We have an ROC curve and we calibrate a detector so it has a 99% true positive rate, and a 1% false positive rate. We receive an alert. What is the probability that the alert is a true positive? It isn’t 99%; the true positive rate is the probability that if an attack took place, the IDS would raise an alarm.
Let’s define a test as the process that an IDS uses to make a judgement call about data. For example, a test might consist of collecting 30 seconds worth of network traffic and comparing it against a predicted volume, or examining the first two packets of a session for a suspicious string.
Now assume that the probability of an actual attack taking place during a test is 0.01%. This means that out of every 10,000 tests the IDS conducts, one of them will be an attack. So out of every 10,000 tests, we raise one alarm due to an attack—after all, we have a 99% true positive rate. However, the false positive rate is 1%, which means that 1% of the tests raise an alarm even though nothing happened. This means that for 10,000 tests, we can expect roughly 101 alarms: 100 false positives and 1 true positive, meaning that the probability that an alarm is raised because of an attack is 1/101 or slightly less than 1%.
This base-rate fallacy explains why doctors don’t run every test on every person. When the probability of an actual attack is remote, the false positives will easily overwhelm the true positives. This problem is exacerbated because nobody in their right mind trusts an IDS to do the job alone.
Applying Classification
Consider the data flow in Figure 7-3, which is a simple representation of how an IDS is normally used in defense.
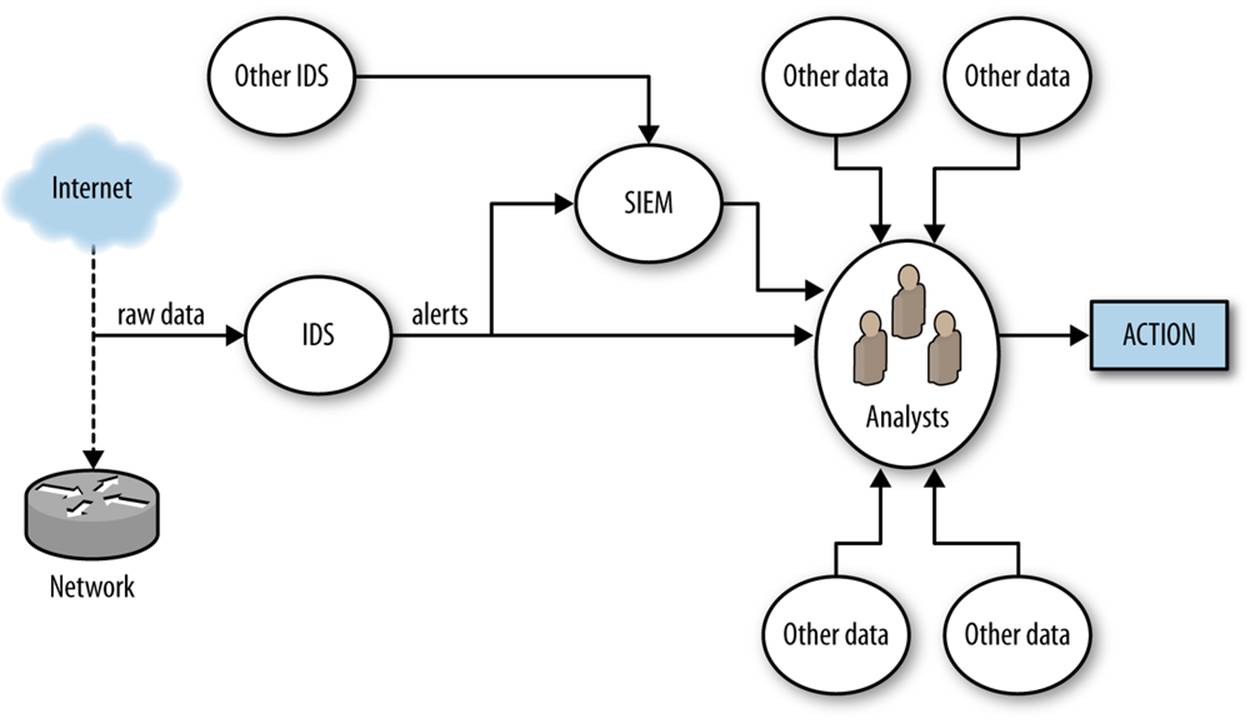
Figure 7-3. Simple detection workflow
Figure 7-3 breaks alert processing into three steps: IDS receives data, raises an alert, and that alert is then passed to analysts either directly or through a SIEM.
Once an IDS generates an alert, that alert must be forwarded to an analyst for further action. Analysts begin by examining the alert and figuring out what the alert means. This may be a relatively simple process, but often it becomes wider-ranging and may involve a number of queries. Simple queries will include looking at the geolocation, ownership, and past history of the address originating the attack (see Chapter 8), by examining the payload of the event using tcpdump or Wireshark. With more complex attacks, analysts will have to reach out to Google, news, blogs, and message boards to identify similar attacks or real-world events precipitating the attack.
With the exception of IPS systems, which work on very crude and obvious attacks such as DDoSes, there is always an interim analytical step between alert and action. At this point, analysts have to take the alert and determine if the alert is a threat, if the threat is relevant to them, and whether or not there’s anything they can do about it. This is a nontrivial problem, consider the following scenarios:
§ The IDS reports that an attacker is exploiting a particular IIS vulnerability. Are there any IIS servers on the network? Have they been patched so they’re not subject to the exploit? Is there evidence from other sources that the attacker succeeded?
§ The IDS reports that an attacker is scanning the network. Can we stop the scan? Should we bother given that there are another hundred scans going on right now?
§ The IDS reports that a host is systematically picking through a web server and copying every file. Is the host a Google spider, and would stopping it mean that our company’s primary website would no longer be visible on Google?
Note that these are not actually failures on the part of detection. The first two scenarios represent actual potential threats, but those threats may not matter, and that decision can only be made through a combination of context and policy decisions.
Verifying alerts takes time. An analyst might be able to seriously process approximately one alert an hour, and complex events will take days to investigate. Consider how that time is spent given the false positive rates discussed earlier.
Improving IDS Performance
There are two approaches to improving how IDSes work. The first is to improve the IDS as a classifier; that is, increase the sensitivity and specificity. The second way is to reduce the time an analyst needs to process an alert by fetching additional information, providing context, and identifying courses of action.
There are no perfect rules to this process. For example, although it’s always a good (and necessary) goal to minimize false positives, analysts will take a more nuanced approach to this problem. For example, if there’s a temporary risk of a nasty attack, an analyst will often tolerate a higher false positive rate in order to more effectively defend against that attack.
There’s a sort of Parkinson’s Law problem here. All of our detection and monitoring systems provide only partial coverage because the Internet is weird, and we don’t really have a good grasp of what we’re missing. As any floor improves its detection process, it will find that there are newer and nastier alerts to consider. To paraphrase Donald Rumsfeld: we do have a problem with unknown unknowns.
This problem of unknown unknowns makes false negatives a particular headache. By definition, a signature-based IDS can’t alert on anything it isn’t configured to alert on. That said, most signature matching systems will be configured to identify only a limited subset of all the malicious behaviors that a particular host uses. By combining signature and anomaly detecting IDSes together, you can at least begin to identify the blind spots.
Enhancing IDS Detection
Improving an IDS as a classifier involves reducing the false positive and false negative rates. This is generally best done by reducing the scope of the traffic the IDS examines. In the same way that a doctor doesn’t run a test until he has a symptom to work with, we try to run the IDS only when we have an initial suspicion that something odd is going on. A number of different mechanisms are available based on whether you’re using a signature- or an anomaly-based IDS.
INCONSISTENT NOTIFICATION: A HEADACHE WITH MULTIPLE IDSES
A special category of false negative involves inconsistent IDS rulesets. Imagine that you run a network with the access points A and B, with IDS running on both. If you don’t keep the ruleset on IDS A consistent with the ruleset on IDS B, you will find that A sends you alerts that B doesn’t recognize and vice versa.
The easiest way to manage this problem is to treat the rulesets as any other source code. That is, put the rules in a version control system, make sure that you commit and comment them, and then install the rules from your version control system. Keeping the rules under version control’s a good idea anyway because if you’re doing a multi-month traffic investigation, you really will want to look at those old rulesets to figure out exactly what you were blocking last April.
There is a class of IDS that makes this type of management particularly problematic, however. AV and some other detection systems are usually black-box systems. A black-box system provides ruleset updates as a subscription service, and the rulesets are usually completely inaccessible to an administrator. Inconsistent identification can be particularly problematic with black-box systems where, at the best you must keep track of what the current rulebase is and identify systems that are behind.[10]
One mechanism common to both signature and anomaly-based IDSes is using inventory to create whitelists. Pure whitelists, meaning that you implicitly trust all traffic from a host, are always a risk. I don’t recommend simply whitelisting a host and never checking it. A better approach, and one that is going to appear in various forms throughout this discussion, is to use whitelisting as a guide for less or more extensive instrumentation.
For example, I create an inventory of all the web servers on my network. A host that is not a web server is de facto suspicious if I see it serving HTTP traffic. In that case, I want to capture a representative cut of traffic and figure out why it’s now a web server. At the same time, for actual web servers, I will use my standard signatures.
In signature-based IDSes, the signature base can usually be refined so that the rule triggers only for specific protocols or in tandem with other indicators. For example, a rule to detect the payload string “herbal supplement” on port 25 will track spam emails with that title, but also internal mail such as “we’re getting a lot of herbal supplement spam lately.” Reducing the false positive rate in this case involves adding more constraints to the match, such as tracking only mail from outside the network (filtering on addresses). By refining the rule to use more selective expressions, an operator can reduce the false positive rate.
As an example, consider the following (stupid) rule to determine whether or not someone is logging on as root to an SSH server:
alert tcp any any -> any 22 (flow:to_server, established;)
A Snort rule consists of two logical sections: the header and the options. The header consists of the rule’s action and addressing information (protocol, source address, source port, destination address, destination port). Options consist of a number of specific keywords separated by semicolons.
In the example above, the action is alert, indicating that Snort generates an alert and logs the packet. Alternative actions include log (log the packet without alerting), pass (ignore the packet), and drop (block the packet) Following the action is a string naming the protocol, tcp in this case, with udp, icmp, and ip being other options. The action is followed by source to destination information separated by the arrow (→) digraph. Source information can be expressed as an address (e.g., 128.1.11.3), a netblock (118.2.0.0/16) as above, or any to indicate all addresses. Snort can also define various collections of addresses with macros (e.g., $HOME_NET to indicate the home network for an IDS), to implement the inventory-based whitelisting discussed earlier.
This rule raises an alert when anyone successfully connects to an ssh server, which is far too vague. In order to refine the rule, I have to add additional constraints. For example, I can constrain it to only raise an alert if it comes from a specific network, and if someone tries to log on specifically as root.
alert tcp 118.2.0.0/16 any -> any 21 (flow:to_server,established; \
content:"root"; pcre:"/user\s_root/i";)
Following the addressing information are one or more rule options. Options can be used to refine a rule, fine-tuning the information the rule looks for in order to reduce the false positive rate. Options can also be used to add additional information to an alert, trigger another rule, or to complete a variety of other actions.
Snort defines well over 70 options for various forms of analysis. A brief survey of the more useful rules include:
content
content is Snort’s bread-and-butter pattern matching rule; it does an exact match of the data passed in the content option against packet payload. content can use binary and text data, enclosing the binary data in pipes. For example, content:|05 11|H|02 23| matches the byte with contents 5, then 11, then the letter H, then the byte 2, then the byte 23. A number of other options directly impact content, such as depth (specifying where in the payload to stop searching), and offset (specifying where in the payload to start searching).
HTTP options
A number of HTTP options (http_client_body, http_cookie, http_header) will extract the relevant information from an HTTP packet for analysis by content.
pcre
The pcre option uses a PCRE regular expression to match against a packet. Regular expressions are expensive; make sure to use content to prefilter traffic and skip applying the regular expression against every packet.
flags
Checks to see whether or not specific TCP flags are present.
flow
The flow keyword specifies the direction traffic is flowing in, such as from a client, to a client, from a server, or to a server. The flow keyword also describes certain characteristics of the session, such as whether or not it was actually established.
Snort’s rule language is used by several other IDSes, notably Suricata. Other systems may differentiate themselves with additional options (for example, Suricata has an iprep option for looking at IP address reputation).
Unlike signature-based systems, where you can’t really go wrong by discussing Snort rules, anomaly-detection systems are more likely to be built by hand. Consequently, when discussing how to make an anomaly detector more effective, we have to operate at a more basic level. ThroughoutPart III, we discuss a number of different numerical and behavioral techniques for implementing anomaly-detection systems, as well as cases for false positives. However, this is an appropriate place to discuss general criteria for building good anomaly-detection systems.
In their simplest forms, anomaly-detection systems raise alarms via thresholds. For example, I might decide to build anomaly detection for a file server by counting the number of bytes downloaded from a server every minute. I can do so using rwfilter to filter the data, and rwcount to count it over time. I then use R, and generate a histogram showing the probability that the value is above x. The nice thing about histograms and statistical anomaly detection is that I control this nominal false positive rate. A test every minute and a 95% threshold before raising alarms means that I create three alarms an hour; a 99% threshold means one alarm every two hours.
The problem lies in picking a threshold that is actually useful. For example, if an attacker is aware that I’ll raise an alarm if he’s too busy, he can reduce his activity below the threshold. This type of evasiveness is really the same kind we saw with Code Red in On Code Red and Malware Evasiveness. The attacker in that case could change the contents of the buffer without impacting the worm’s performance. When you identify phenomena for anomaly detection, you should keep in mind how it impacts the attacker’s goals; detection is simply the first step.
I have four of rules of thumb I apply when evaluating phenomena for an anomaly detection system: predictability, manageable false positives, disruptibility, and impact on attacker behavior.
Predictability is the most basic quality to look for in a phenomenon. A predictable phenomenon is one whose value effectively converges over time. “Convergence” is something that I have to be a bit hand-wavy about. You may find that nine days out of ten, a threshold is x, and then on the tenth day it rises to 10x because of some unexplained weirdness. Expect unexplained weirdness; if you can identify and describe outliers behaviorally and whatever remains has an upper limit you can express, then you’ve got something predictable. False positives will happen during investigation, and true positives will happen during training!
The second rule is manageable false positives. Look at a week of traffic for any publicly available host and you will see something weird happen. Can you explain this weirdness? Is it the same address over and over again? Is it a common service, such as a crawler visiting a web server? During the initial training process for any anomaly detector, you should log how much time you spend identifying and explaining outliers, and whether you can manage those outliers through whitelisting or other behavioral filters. The less you have to explain, the lower a burden you impose on busy operational analysts.
A disruptible phenomenon is one that the attacker must affect in order to achieve his goals. The simpler, the better. For example, to download traffic from a web server, the attacker must contact the web server. He may not need to do so from the same address, and he may not need authentication, but he needs to pull down data.
Finally, there’s the impact of a phenomenon on attacker behavior. The best alarms are the ones that the attacker has to trigger. Over time, if a detector impacts an attacker, the attacker will learn to evade or confuse it. We see this in antispam and the various tools used to trick Bayesian filtering, and we see it consistently in insider threats. When considering an alarm, consider how the attacker can evade it, such as:
By moving slower
Can an attacker impact the alarm if she reduces her activity? If so, what’s the impact on the attacker’s goal? If a scanner slows her probes, how long does it take to scan your network? If a file leech copies your site, how long to copy the whole site?
By moving faster
Can an attacker confuse the system if he moves faster? If he risks detection, can he move faster than your capability to block him by moving as fast as possible?
By distributing the attack
If an attacker works from multiple IP addresses, can the individual addresses slip under the threshold?
By alternating behaviors
Can an attacker swap between suspicious and innocent behavior, and confuse the IDS that way?
Many of the techniques discussed previously imply a degree of heterogeneity in your detection system. For example, anomaly-detection systems might have to be configured individually for different hosts. I have found it useful to push that idea toward a subscription model, where analysts choose which hosts to monitor, decide on the thresholds, and provide them with whitelisting and blacklisting facilities for every host they decide to monitor. Subscriptions ensure that the analyst can treat each host individually, and eventually build up an intuition for normal behavior on that host (for example, knowing that traffic to the payroll server goes bonkers every two weeks).
The subscription model acknowledges that you can’t monitor everything, and consequently the next question about any subscription-based approach is precisely what to monitor. Chapter 13 and Chapter 15 discuss this issue in more depth.
Enhancing IDS Response
IDS, particularly NIDS, was conceived of as a real-time detection system—there would be enough of a gap between the time the attack began and the final exploit that, armed with the IDS alerts, the defenders could stop the attack before it caused significant damage. This concept was developed in a time when attackers might use two computers, when attacks were hand-crafted by experts, and when malware was far more primitive. Now, IDS is too often a recipe for annoyance. It’s not simply a case of misclassified attacks; it’s a case of attackers attacking hosts that aren’t there in the hopes that they’ll find something to take over.
At some point, you will make an IDS as effective a detector as you can, and you’ll still get false positives because there are normal behaviors that look like attacks and the only way you’ll figure this out is by investigating them. Once you reach that point, you’re left with the alerting problem: IDSes generate simple alerts in real time, and analysts have to puzzle them out. Reducing the workload on analysts means aggregating, grouping, and manipulating alerts so that the process of verification and response is faster and conducted more effectively.
When considering how to manipulate an alert, first ask what the response to that alert will be. Most CSIRTS have a limited set of actions they can take in response to an alert, such as modifying a firewall or IPS rules, removing a host from the network for further analysis, or issuing policy changes. These responses rarely take place in real time, and it’s not uncommon for certain attacks to not merit any response at all. The classic example of the latter case is scanning: it’s omnipresent, it’s almost impossible to block, and there’s very little chance of catching the culprit.
If a real-time response isn’t necessary, it’s often useful to roll up alerts, particularly by attacker IP address or exploit type. It’s not uncommon for IDSes to generate multiple alerts for the same attacker. These behaviors, which are not apparent with single real-time alerts, become more obvious when the behavior is aggregated.
Prefetching Data
After receiving an alert, analysts have to validate the information and examine it. This usually involves tasks such as determining the country of origin, the targets, and any past activity by this address. Prefetching this information helps enormously to reduce the burden on analysts.
In particular with anomaly-detection sytems, it helps to present options. As we’ve discussed, anomaly detections are often threshold-based, raising an alert after a phenomenon exceeds a threshold. Instead of simply presenting an aberrant event, return a top-n list of the most aberrant events at a fixed interval.
Providing summary data in visualizations such as time series plots or contact graphs helps reduce the cognitive burden on the analyst. Instead of just producing a straight text dump of query information, generate relevant plots. Chapter 10 discusses this issue in more depth.
Finally, consider monitoring assets rather than simply monitoring attacks. Most detection systems are focused on attacker behavior, such as raising an alert when a specific attack signature is detected. Instead of focusing on attacker behavior, assign your analysts specific hosts on the network to watch and analyze the traffic to and from the asset for anomalies. Lower-priority targets should be protected using more restrictive techniques, such as restrictive firewalls.
Assigning analysts to assets rather than simply reacting to alerts has another advantage: analysts can develop expertise about the systems they’re watching. False positives often rise out of common processes that aren’t easily described to the IDS, such as a rise in activity to file servers because a project is reaching crunch time, regular requests to payroll, a service that’s popular with a specific demographic. Expertise reduces the time analysts need to sift through data, and helps them throw out the trivia to focus on more significant threats.
Further Reading
1. Stefan Axelsson, “The Base-Rate Fallacy and the Difficulty of Intrusion Detection,” ACM Transactions on Information and System Security, Vol. 3, Issue 3, August 2000.
2. Brian Caswell, Jay Beale, and Andrew Baker. Snort IDS and IPS Toolkit (Syngress, 2007).
3. Vern Paxson, “Bro: A System for Detecting Network Intruders in Real-Time,” Computer Networks: The International Journal of Computer and Telecommunications Networking, Vol. 31, Issue 23-24, December 1999.
4. Martin Roesch, “Snort—Lightweight Intrusion Detection for Networks,” Proceedings of the 1999 Large Installation Systems Administration Conference.
[9] A number of similar tools are associated with SEM, particularly security information management (SIM) and security information and event management (SIEM). Technically, SIM refers to the log data and information management while SEM is focused on more abstract events, but you are more likely to hear people say “SIM/SEM/SIEM” or some other aggregate.
[10] This has the nice bonus of identifying systems that may be compromised. Malware will disable AV as a matter of course.
All materials on the site are licensed Creative Commons Attribution-Sharealike 3.0 Unported CC BY-SA 3.0 & GNU Free Documentation License (GFDL)
If you are the copyright holder of any material contained on our site and intend to remove it, please contact our site administrator for approval.
© 2016-2026 All site design rights belong to S.Y.A.