Essential MATLAB for Engineers and Scientists (2013)
PART 1
Essentials
CHAPTER 4
MATLAB Functions and Data Import-Export Utilities
Abstract
The objectives of this chapter are to enable you to become familiar with some of the more common MATLAB functions, and to introduce you to ways of importing and exporting data in and out of the MATLAB workspace using the load and save commands, the Import Wizard, and low-level file input/output (I/O) functions. In addition, since problems in science and engineering usually involve special mathematical functions such as sines, cosines, logarithms, etc., this chapter introduces you to the some of the functions of the large collection of such functions in MATLAB.
Keywords
Import/export of data; Built-in functions (e.g., to compute sines, cosines, etc.)
CHAPTER OUTLINE
Common functions
Importing and exporting data
The load and save commands
Exporting text (ASCII) data
Importing text (ASCII) data
Exporting binary data
Importing binary data
Summary
Exercises
THE OBJECTIVES OF THIS CHAPTER ARE:
(1) To enable you to become familiar with some of the more common MATLAB functions.
(2) To introduce you briefly to ways of importing and exporting data in and out of the MATLAB workspace using:
■ The load and save commands.
■ The Import Wizard.
■ The low-level file input/output (I/O) functions.
At this point you should be able to write a MATLAB program which inputs data, performs simple arithmetic operations on the data, perhaps involving loops and decisions, and displays the results of the computation in a comprehensible form. However, more interesting problems in science and engineering are likely to involve special mathematical functions like sines, cosines, logarithms, etc. MATLAB comes with a large collection of such functions; we have seen some of them already. This chapter introduces you to the more common functions available in MATLAB. In addition, you may wish to import data to be plotted or operated on mathematically, and export data for future use. Hence, this chapter also introduces you to the importing of data into the MATLAB workspace from various sources. It also discusses the exporting of data to files in your work directory for later use with MATLAB or with other software tools.
4.1. Common functions
Tables of MATLAB functions and commands appear in Appendix C. A short list of some of the more common ones follows. Use helpwin at the command line to see a list of categories of functions, with links to descriptions of the functions. Alternatively, go to the Contents listing in the Help Navigator (the left pane in the Help browser), and expand successively MATLAB, Reference, MATLAB Function Reference where you can choose either Functions by Category, or Alphabetical List of Functions.
Note that if the argument of a function is an array, the function is applied element by element to all the values in the array, e.g.,
sqrt([1 2 3 4])
returns
1.0000 1.4142 1.7321 2.0000
Since this text is written in a tutorial style, it is expected that you will examine the following list of some of the more common functions in MATLAB. It is also, to some extent, expected that you already know, from your first courses in mathematics and science, something about these functions. One way to examine these functions is to plot them. Have some fun experimenting with MATLAB in your investigation of the following functions! For example, do the following exercise for all functions of the assigned variable x, as illustrated next.
x = -1:.1:1; <Enter>
plot(x,abs(x),'o') <Enter>
You should get an illustration that looks like a V.
abs(x)
absolute value of x.
acos(x)
arc cosine (inverse cosine) of x between 0 and π.
acosh(x)
inverse hyperbolic cosine of x, i.e., ![]() .
.
asin(x)
arc sine (inverse sine) of x between ![]() and
and ![]() .
.
asinh(x)
inverse hyperbolic sine of x, i.e., ![]() .
.
atan(x)
arc tangent of x between ![]() and
and ![]() .
.
atan2(y, x)
arc tangent of y/x between −π and π.
atanh(x)
inverse hyperbolic tangent of x, i.e., ![]() .
.
ceil(x)
smallest integer which exceeds x, i.e., rounds up to nearest integer, e.g., ceil(-3.9) returns -3, ceil(3.9) returns 4.
clock
time and date in a six-element vector, e.g., the statements
t = clock;
fprintf( ' %02.0f:%02.0f:%02.0f\n', t(4), t(5), t(6) );
result in 14:09:03. Note how the hours, minutes and seconds are left-filled with zeros if necessary.
cos(x)
cosine of x.
cosh(x)
hyperbolic cosine of x, i.e., ![]() (see Figure 4.1).
(see Figure 4.1).
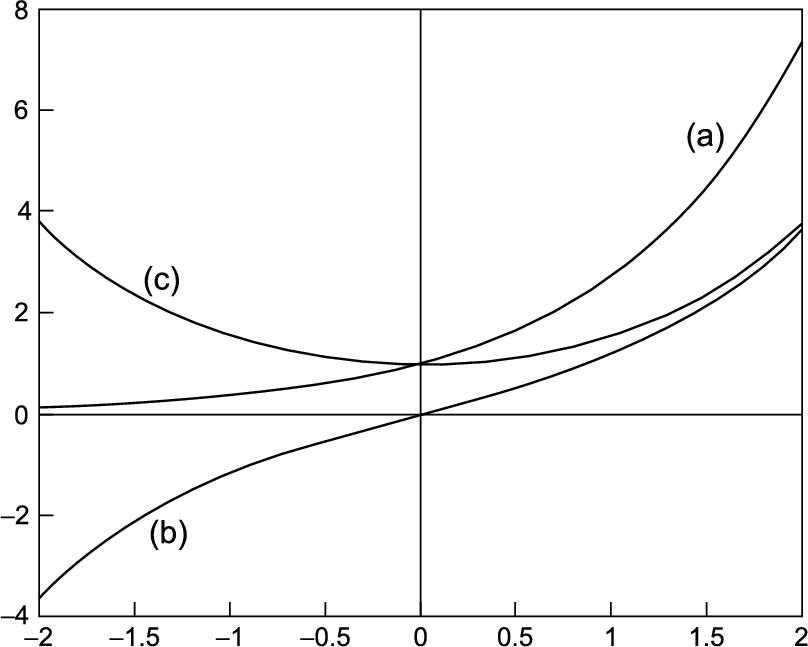
FIGURE 4.1 (a) Exponential, (b) hyperbolic sine and (c) hyperbolic cosine functions.
cot(x)
cotangent of x.
csc(x)
cosecant of x.
cumsum(x)
cumulative sum of the elements of x, e.g., cumsum(1:4) returns [1 3 6 10].
date
date in a string in dd-mmm-yyyy format, e.g., 02-Feb-2001.
exp(x)
value of the exponential function ![]() (see Figure 4.1).
(see Figure 4.1).
fix(x)
rounds to the nearest integer towards zero, e.g., fix(-3.9) returns -3, fix(3.9) returns 3.
floor(x)
largest integer not exceeding x, i.e., rounds down to nearest integer, e.g., floor(-3.9) returns -4, floor(3.9) returns 3.
length(x)
number of elements of vector x.
log(x)
natural logarithm of x.
log10(x)
base 10 logarithm of x.
max(x)
maximum element of vector x.
mean(x)
mean value of elements of vector x.
min(x)
minimum element of vector x.
pow2(x)
![]() .
.
prod(x)
product of the elements of x.
rand
pseudo-random number in the interval (0, 1). The value returned is pseudo- random rather than truly random in the sense that there is an algorithm that determines rand from the initial ‘seed’. The same seed will generate the same ‘random’ sequence; see a later chapter for how to seed rand by looking in the index.
realmax
largest positive floating point number on your computer.
realmin
smallest positive floating point number on your computer.
rem(x, y)
remainder when x is divided by y, e.g., rem(19, 5) returns 4 (5 goes 3 times into 19, remainder 4).
Strictly, rem(x, y) returns x - y * n where n = fix(x/y) is the integer nearest to x/y. This shows how negative and/or non-integer arguments are handled.
fix and rem are useful for converting smaller units to larger ones, e.g., inches to feet and inches (one foot = 12 inches). The following statements convert 40 inches this way:
feet = fix(40/12)
inches = rem(40, 12)
Let us next examine an example that will hopefully inspire you to examine all of the functions listed as well as any other function that you may discover that MATLAB supports. Let us consider the arc-cosine, the arc-sine and the arc-tangent functions, i.e., acos(x), asin(x) and atan(x), respectively. If you specify x, i.e., the cosine, the sine and the tangent, respectively, between −1 and 1, what quadrant of the circle are the output angles selected? To provide an answer, the following M-file script was created and executed. The graphical comparison of the computed results is illustrated in Figure 4.2. The REMARKS at the end of the script provides an interpretation of the graphical results and, hence, an answer to the question raised.
%
% Script to compare the acos(x), asin(x), and atan(x)
% functions over the range -1 < x < 1. The values are
% converted to angles in degrees. The results are
% compared graphically.
%
% Script prepared by D. T. Valentine - September 2006.
% Comments modified by D.T.V. ........ 2008/2012/2016.
%
% The question raised is: What range of angles, i.e.,
% which of the four quadrents of the circle from 0 to
% 2*pi are the angular outputs of each of the functions?
%
% Assign the values of x to be examined:
%
x = -1:0.001:1;
%
% Compute the arc-functions:
%
y1 = acos(x);
y2 = asin(x);
y3 = atan(x);
%
% Convert the angles from radians to degrees:
%
y1 = 180*y1/pi;
y2 = 180*y2/pi;
y3 = 180*y3/pi;
%
% Plot the results:
%
plot(y1,x,y2,x,y3,x),grid
legend('asin(x)', 'acos(x)', 'atan(x)')
xlabel('\theta in degrees')
ylabel('x, the argument of the function')
%
% REMARKS: Note the following:
% (1) The acos(x) varies from 0 to 90 to 180 degrees.
% (2) The asin(x) varies from -90 to 0 to 90 degrees.
% (3) The atan(x) varies from -90 to 0 to 90 degrees.
% To check remark (3) try atan(10000000) *180/pi.
%
% Stop
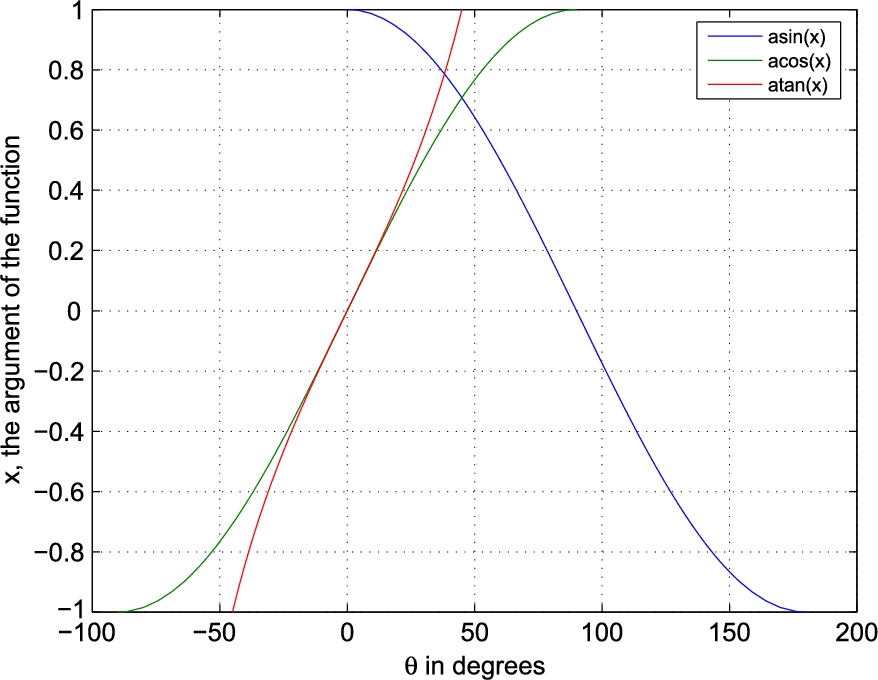
FIGURE 4.2 Comparison of the results from the acos, asin and atan functions.
4.2. Importing and exporting data
When you get into serious programming you will often need to store data on a disk. The process of moving data between MATLAB and disk files is called importing (from disk files) and exporting (to disk files). Data are saved in disk files in one of two formats: text or binary. In text format, data values are ASCII codes, and can be viewed in any text editor. In binary format, data values are not ASCII codes and cannot be viewed in a text editor. Binary format is more efficient in terms of storage space required. This chapter provides a brief summary of the main ways in which MATLAB imports and exports data. For full details consult MATLAB Help: Development Environment: Importing and Exporting Data.
4.2.1. The load and save commands
If you want to save data between MATLAB sessions the save and load commands are probably the best ones to use.
4.2.2. Exporting text (ASCII) data
To export (save) the array
A =
1 2 3
4 5 6
in ‘delimited’ ASCII format in the file myData.txt use the command
save myData.txt A -ascii
If you view myData.txt in a text editor (or type it in the Command Window) it looks like this:
1.0000000e+000 2.0000000e+000 3.0000000e+000
4.0000000e+000 5.0000000e+000 6.0000000e+000
Delimiters are the characters used to separate the data values in the file—spaces by default. You can use tabs instead of spaces by specifying the -tabs qualifier instead of -ascii. If you save character arrays (strings) in this way, the ASCII codes of the characters are written to the file.
4.2.3. Importing text (ASCII) data
The load command is the reverse of save, but has a curious twist. If the array A has been saved in myData.txt as above the command
load myData.txt
creates a variable in the workspace with the same name as the file, minus the extension, i.e., myData. If you don't want the filename as the variable name use the functional form of the command, e.g.,
A = load('myData.txt')
Data imported in this way doesn't have to be created by MATLAB. You can create it in a text editor, or it could be created by any other program that exports data in ASCII format.
4.2.4. Exporting binary data
The command
save filename x y z
saves the variables x, y and z in the file filename.mat in MATLAB proprietary binary format, i.e., such a MAT-file can only be used by MATLAB.
Note:
■ If no variables are listed the entire workspace is saved.
■ The extension .mat is the default—you can specify a different extension.
■ Seek help for all the save options.
4.2.5. Importing binary data
The command
load filename
loads all the variables from filename.mat into the workspace; see help for all the load options.
Summary
■ MATLAB functions may be used to perform a variety of mathematical, trigonometric and other operations.
■ Data can be saved to disk files in text (ASCII) format or in binary format.
■ load and save can be used to import/export both text and binary data (the latter in the form of MAT-files).
Exercises
4.1 Write some MATLAB statements which will:
(a) find the length C of the hypotenuse of a right-angle triangle in terms of the lengths A and B of the other two sides;
(b) find the length C of a side of a triangle given the lengths A and B of the other two sides and the size in degrees of the included angle θ, using the cosine rule:
![]()
4.2 Translate the following formulae into MATLAB expressions:
(a) ![]()
(b) ![]()
(c) ![]() (inverse tangent)
(inverse tangent)
(d) ![]()
(e) ![]() (use MATLAB's inverse cotangent)
(use MATLAB's inverse cotangent)
4.3 There are 39.37 inches in a meter, 12 inches in a foot, and three feet in a yard. Write a script to input a length in meters (which may have a decimal part) and convert it to yards, feet and inches. (Check: 3.51 meters converts to 3 yds 2 ft 6.19 in.)
4.4 A sphere of mass ![]() impinges obliquely on a stationary sphere of mass
impinges obliquely on a stationary sphere of mass ![]() , the direction of the blow making an angle α with the line of motion of the impinging sphere. If the coefficient of restitution is e it can be shown that the impinging sphere is deflected through an angle β such that
, the direction of the blow making an angle α with the line of motion of the impinging sphere. If the coefficient of restitution is e it can be shown that the impinging sphere is deflected through an angle β such that
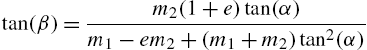
Write a script to input values of ![]() ,
, ![]() , e, and α (in degrees) and to compute the angle β in degrees.
, e, and α (in degrees) and to compute the angle β in degrees.
4.5 Section 2.7 has a program for computing the members of the sequence
![]() . The program displays every member
. The program displays every member ![]() computed. Adjust it to display only every 10th value of
computed. Adjust it to display only every 10th value of ![]() .
.
Hint: the expression rem(n, 10) will be zero only when n is an exact multiple of 10.
Use this in an if statement to display every tenth value of ![]() .
.
4.6 To convert the variable mins minutes into hours and minutes you would use fix(mins/60) to find the whole number of hours, and rem(mins, 60) to find the number of minutes left over. Write a script which inputs a number of minutes and converts it to hours and minutes.
Now write a script to convert seconds into hours, minutes and seconds. Try out your script on 10 000 seconds, which should convert to 2 hours 46 minutes and 40 seconds.
4.7 Design an algorithm (i.e., write the structure plan) for a machine which must give the correct amount of change from a $100 note for any purchase costing less than $100. The plan must specify the number and type of all notes and coins in the change, and should in all cases give as few notes and coins as possible. (If you are not familiar with dollars and cents, use your own monetary system.)
4.8 A uniform beam is freely hinged at its ends ![]() and
and ![]() , so that the ends are at the same level. It carries a uniformly distributed load of W per unit length, and there is a tension T along the x-axis. The deflection y of the beam a distance x from one end is given by
, so that the ends are at the same level. It carries a uniformly distributed load of W per unit length, and there is a tension T along the x-axis. The deflection y of the beam a distance x from one end is given by
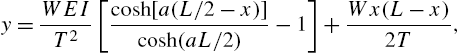
where ![]() , E being the Young's modulus of the beam, and I is the moment of inertia of a cross-section of the beam. The beam is 10 m long, the tension is 1 000 N, the load 100 N/m, and EI is 104.
, E being the Young's modulus of the beam, and I is the moment of inertia of a cross-section of the beam. The beam is 10 m long, the tension is 1 000 N, the load 100 N/m, and EI is 104.
Write a script to compute and plot a graph of the deflection y against x (MATLAB has a cosh function).
To make the graph look realistic you will have to override MATLAB's automatic axis scaling with the statement
axis( [xmin xmax ymin ymax] )
after the plot statement, where xmin etc. have appropriate values.
All materials on the site are licensed Creative Commons Attribution-Sharealike 3.0 Unported CC BY-SA 3.0 & GNU Free Documentation License (GFDL)
If you are the copyright holder of any material contained on our site and intend to remove it, please contact our site administrator for approval.
© 2016-2026 All site design rights belong to S.Y.A.