Software Engineering: A Methodical Approach (2014)
PART B. Software Investigation and Analysis
Chapter 6. Communicating Via Diagrams
In the previous chapter, we discussed information gathering. Remember, as a software engineer, you do not gather information (or anything for that matter) just for the sake of doing so. Rather, there must be a purpose, and as pointed out earlier, your objective is the preparation of the project’s second major deliverable — the requirements specification. As you will soon see, this deliverable can be quite bulky, particularly if the software system is quite complex and/or large. In software engineering, we do not like unnecessary fluff; we promote comprehensive but succinct coverage.
Comprehensive coverage and brevity are often not easy to achieve since they are to some extent mutually contradictory. However, to assist in the pursuit of these sometimes-conflicting ideals, we use diagrams. This chapter provides you with a broad overview of various diagramming techniques that are used in documenting the requirements of computer software. It proceeds under the following captions:
· Introduction
· Traditional System Flow Charts
· Procedure Analysis Chart
· Innovation: Topology Charts
· Data Flow Diagrams
· Object Flow Diagram
· Other Contemporary Diagramming Techniques
· Program Flow Chart
· Summary and Concluding Remarks
6.1 Introduction
In the preparation of the requirements specification, the software engineer invariably employs various diagramming techniques in order to convey information about the software. Diagrams provide graphic representation of the flow of information, as well as the inter-relationships among system resources. In developing diagrams, the software engineer uses predefined symbols that have established meanings.
Among the many advantages of system diagrams are the following:
· They aid in the illustration of logical inter-relationships of various components of a system.
· They help in the development of system logic since they show from start to finish, various conditions, actions and data storage in the system.
· They are traceable.
· They can help to identify bottlenecks and weaknesses in the system.
· In the object-oriented paradigm (particularly with OO-CASE tools), diagrams are executable.
The diagramming techniques discussed in this chapter are drawn from the traditional function-oriented (FO) software engineering paradigm, as well as the more contemporary object-oriented (OO) paradigm. While contemporary products tend to be designed based on the OO paradigm, there are many legacy systems that still abound. An understanding of both approaches is therefore imperative for the keen software engineer. Figure 6-1 provides a list of some commonly used diagrams and the software engineering paradigm(s) (OO or FO) to which they apply. Some of these diagrams will be discussed in this chapter; others will be discussed in more appropriate sections later in the course.
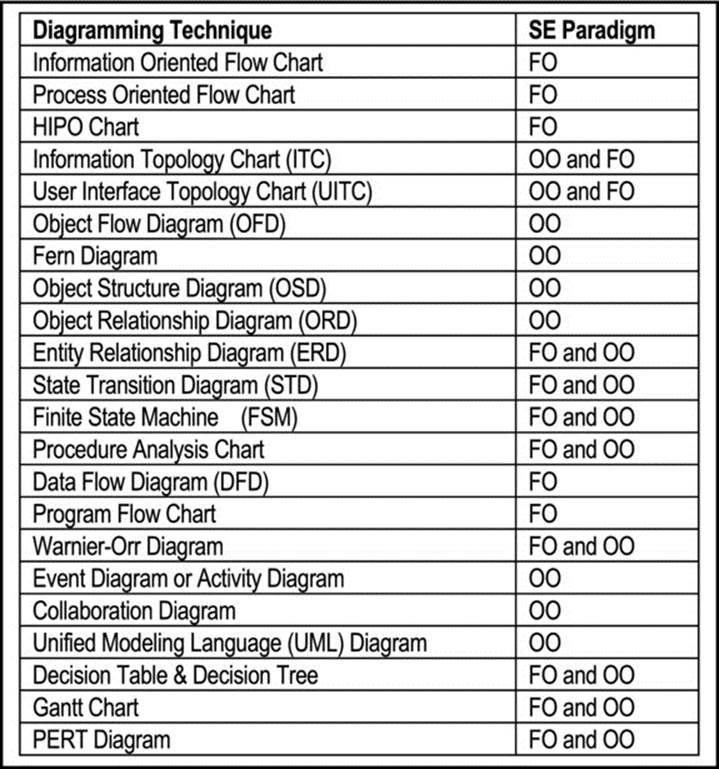
Figure 6-1. Commonly Used Diagramming Techniques
6.2 Traditional System Flowcharts
Traditional system flow charts include information-oriented flow charts, HIPO charts and process-oriented flow charts. Figure 6-2 shows symbols used for these traditional system flow charts. This figure provides a good opportunity to clarify a few terms that are commonly used in software requirements specification:
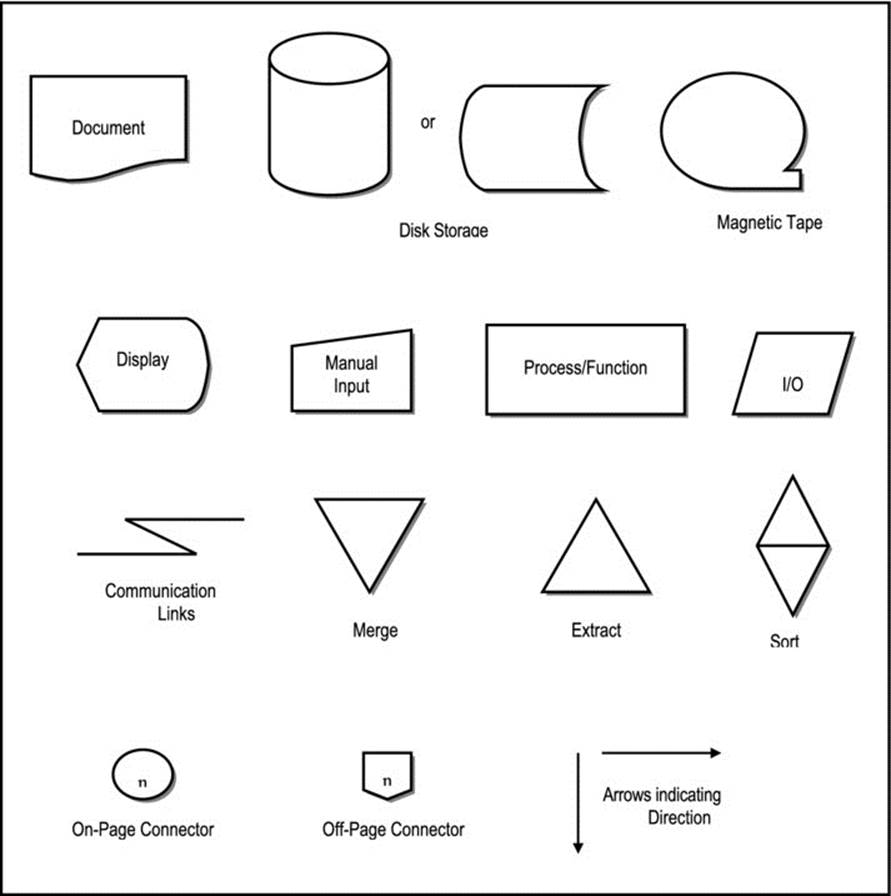
Figure 6-2. Traditional System Flowchart Symbols
Disk or Data Storage: This represents the storage of a data entity (items) to an appropriate storage device (typically magnetic disk or optical disk). As you will learn later in the course, these entities are comprised of data elements (also called attributes). However, at this stage, we do not concern ourselves with data elements; only the data storages.
Process or Function or Operation: Some texts will distinguish between process and function. Such distinctions are frivolous at best, and confusing at worst; this course makes no such distinction; rather, the terms will be used as synonyms (in the context of the FO paradigm). A process (or function) describes a set of related activities that can be conveniently summarized in the descriptive name given to the process. Functions eventually translate to actual programs that will be written as part of the software system. In the OO paradigm, the term operation is preferred to function or process. Throughout this text, this is the preferred term, except when dealing with traditional (function oriented) techniques. Finally, it must be borne in mind that operations translate to actual methods of classes, or classes with constituent methods that will be written at development time. For further clarification, please review appendix 2.
Subsystem: A subsystem is an independent (or almost independent) component of a software system. The subsystem may operate as part of a larger system, or on its own as an independent system.
Module: A module is a subservient component of a system or subsystem. The module does not operate on its own.
6.2.1 Information-Oriented Flowchart
The information-oriented flowchart (IOF) has the following characteristics:
· It traces the flow of information through the organization.
· It is usually grid structure.
· It uses mainly the document symbol.
· It is normally accompanied by a narrative that describes the information flow steps.
Figure 6-3 shows an example on an IOF. Notice that in this example, only the document symbol is used to show the flow of information across different departments in the organization. This is typical of IOFs.
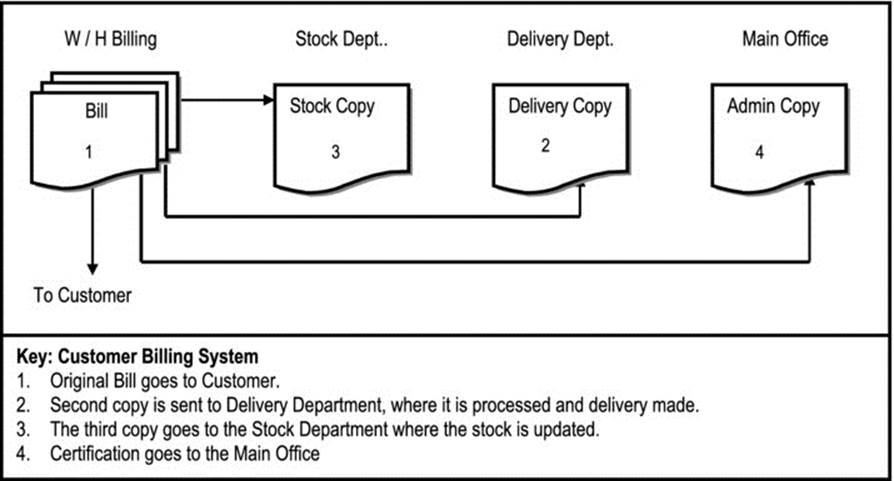
Figure 6-3. Example of Information-Oriented Flowchart
6.2.2 Process-Oriented Flowchart
The process-oriented flowchart (POF) has the following characteristics:
· It traces the processing of information throughout the organization.
· It may be highly summarized or fairly detailed.
· It uses mainly the I/O symbol, the process symbol, the document symbol, and the storage symbol.
· It is normally accompanied by a descriptive narrative.
· It is useful at the analysis, system specification and design stages.
Figure 6-4 shows an example of a POF. Notice from the example that the POF conveys a number of important pieces of information about the software system as mentioned below:
· The inputs to the system
· The important processes comprising the system
· The important data storages comprising the system (these translate to information entities in the underlying database)
· The critical outputs from the system
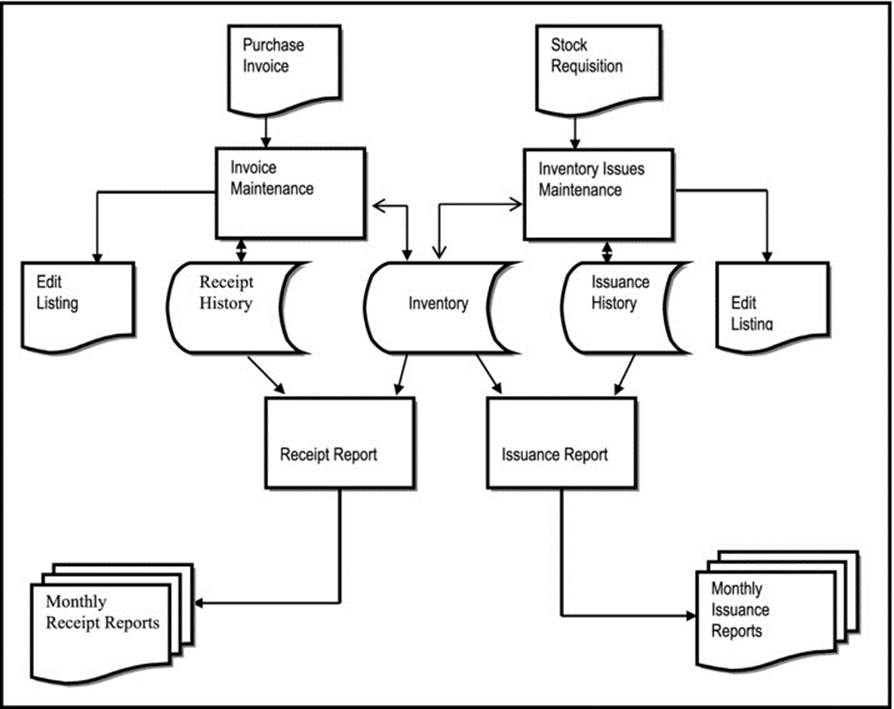
Figure 6-4. Process-Oriented Flowchart for (part of an) Inventory Management System
6.2.3 Hierarchy- Input–Process-Output Chart
The hierarchy-input-process-output (HIPO) chart has the following characteristics:
· It presents the system and its main functional components in a hierarchical manner, so that relationships among them can be easily depicted.
· The name of the software system is at level-1; the second and/or intermediate levels contain major functional components of the system (subsystems, modules, and eventually functions/processes); for the final level, each function is broken down into component activities.
· A second IPO chart can show more details about each functional module, outline inputs, processing steps and outputs. This is useful at the design phase.
Figure 6-5 illustrates a HIPO chart for the earlier mentioned inventory management system. Notice that on the HIPO chart, system functions are usually indicated at the lowest level of the hierarchy.
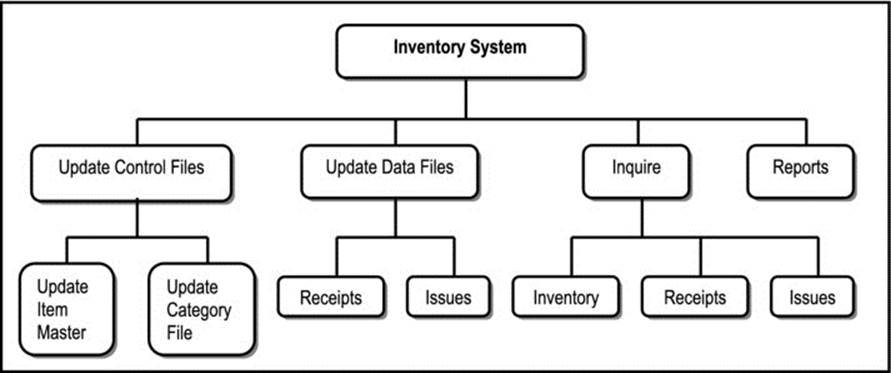
Figure 6-5a. Example of a HIPO Chart
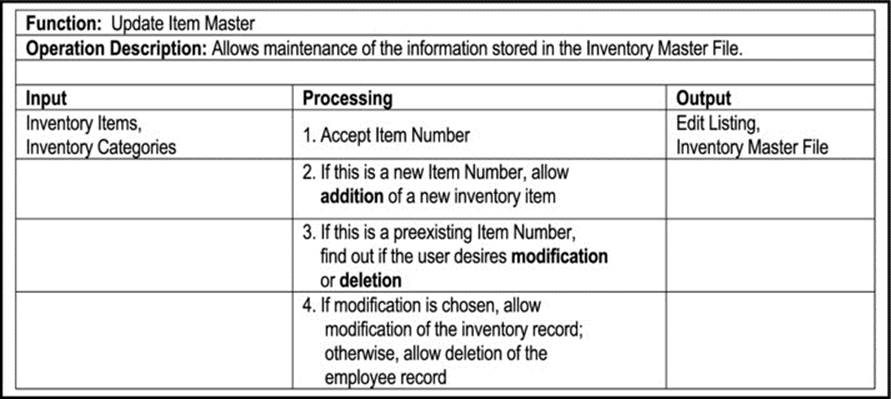
Figure 6-5b. Example of an IPO Chart
6.3 Procedure Analysis Chart
The procedure analysis chart (PAC) is used to conduct process analysis in the organization. Its main objective is to identify bottlenecks and solve them by any of the following strategies:
· Eliminating delays
· Merging processes
· Eliminating redundant processes
· Introducing new processes if necessary
The procedure analysis chart is particularly useful in process re-engineering in the organization. Figure 6-6 provides an example. From the chart, you will observe that there are five types of actions that are studied: activity, transportation, inspection, delay and storage. The summary provides the total time by each type of action, for that particular job function. By examining the chart, the software engineer can make recommendations as to whether improvements are needed in that particular functional area of the system. For this reason, PACs are extremely useful in business process reengineering (BPR).
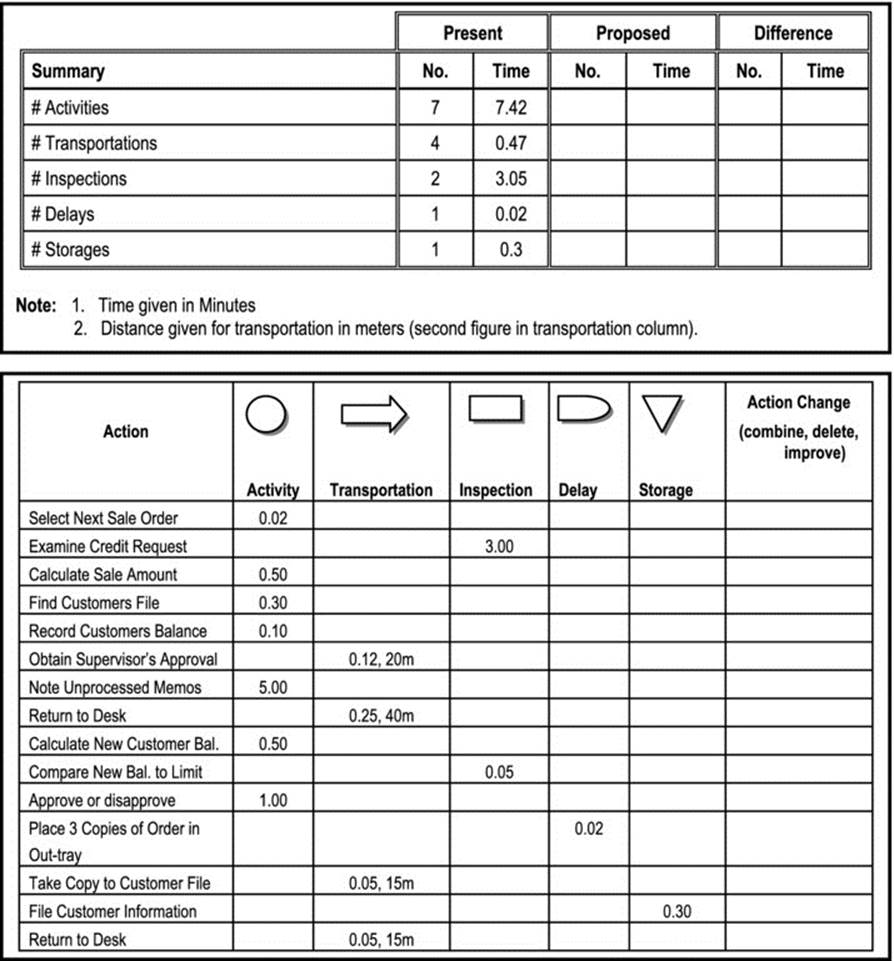
Figure 6-6. Procedure Analysis Chart
6.4 Innovation: Topology Charts
The following two topology charts have been proposed by the current writer and may be employed in both (OO and FO) paradigms of software engineering.
6.4.1 Information Topology Chart
The information topology chart (ITC) shows information levels of the software system in a top-down manner — the system is at the highest level and data elements at the lowest level. It presents information to be managed in the system in a logical and modular way, and therefore allows for easy analysis and identification of omissions or redundancies.
The ITC is particularly useful in providing a global view of the system, including all significant components. It is useful for analysis and specification, as well as the design phases of the SDLC. The technique differs from the HIPO chart in the following way: The HIPO chart is a functional representation of processes in a system. On the other hand, the ITC is a conceptual representation of component information entities (object types) of the system.
The ITC also differs from other techniques such as fern diagram, object-relationship diagram, and object flow diagram. A comparison of the ITC with these methodologies is available in reference [Foster, 1999]. This information has been excluded because it is not considered necessary for this course. However, it is useful to mention some benefits of the approach:
· The ITC is a useful design and documentation aid.
· The technique is easy to learn, involving minimal use of symbols.
· The technique is useful in conceptualizing (the entire) system scope.
· The technique is useful in illustrating how information (object types) will be managed.
· The technique is useful applicable in the FO paradigm as well as OO paradigm.
The ITC is more useful in OOSE, but can also be used in the traditional approach. Figure 6-7 illustrates a portion of an ITC for a generic College/University Administrative Information System (CUAIS). From this diagram, it can be seen that the CUAIS is an integrated software system consisting of nine independent but interrelated subsystems. Software systems of this sort belong to a family called enterprise resource planning (ERP) systems, which in turn belongs to a larger family called management support systems (MSSs). Each subsystem is responsible for the management of various information entities, some of which have been included in the diagram. Appendix 10 includes additional ITC illustrations.
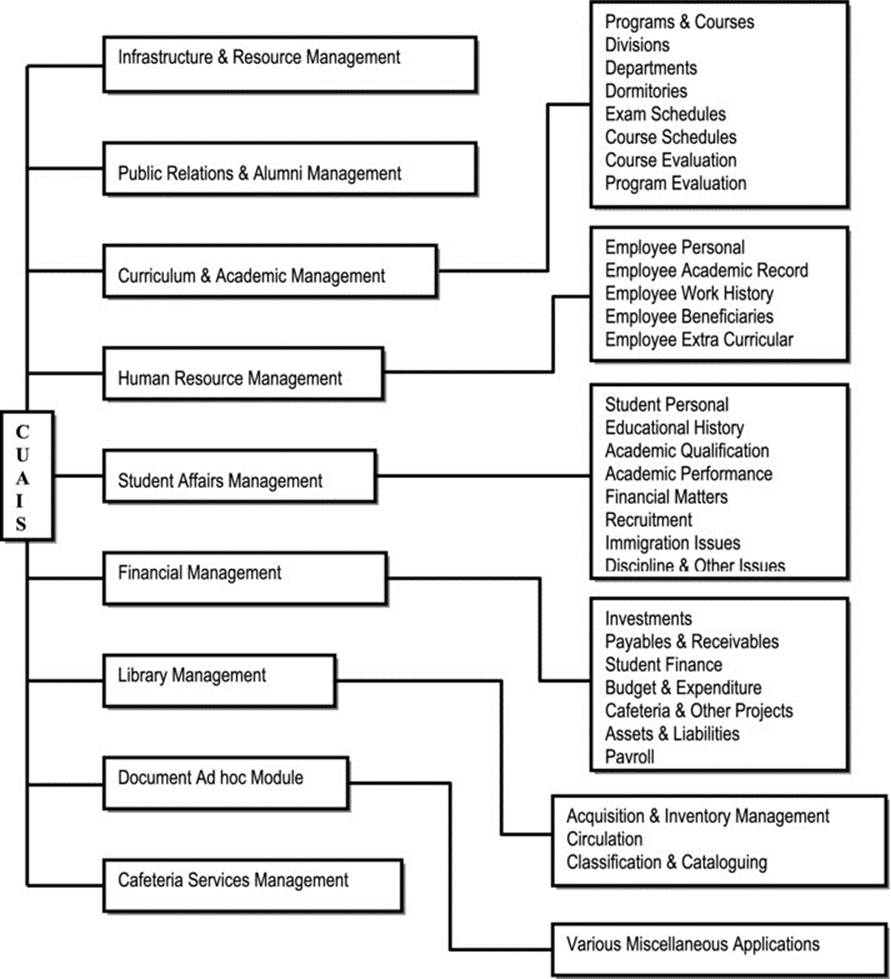
Figure 6-7. Partial Information Topology Chart for the CUAIS Project
6.4.2 User Interface Topology Chart
The user interface topology chart (UITC) is logically constructed from the ITC, and is comparable to Schneideman’s Object-Action Interface (OAI) model for user interfaces [Schneiderman, 2005].
It shows the operational levels of the system in a top-down manner: the system is represented at the highest level; subsystems (may) appear at the intermediate levels; actual operations are represented at the lowest level. It is similar to a HIPO chart, except that it favors an OO approach to software design.
The UITC presents operations of the system in a logical manner, showing interrelationships, and how they fit in the overall system architecture. It also presents the end user with a panoramic perspective of the entire system. Hence, as the name suggests, it is useful is portraying a blown out static picture of the (menu driven or graphical) user interface of the system. Figure 6-8 illustrates a partial UITC for the CUAIS project. Additional illustrations of UITCs are available in appendix 10.
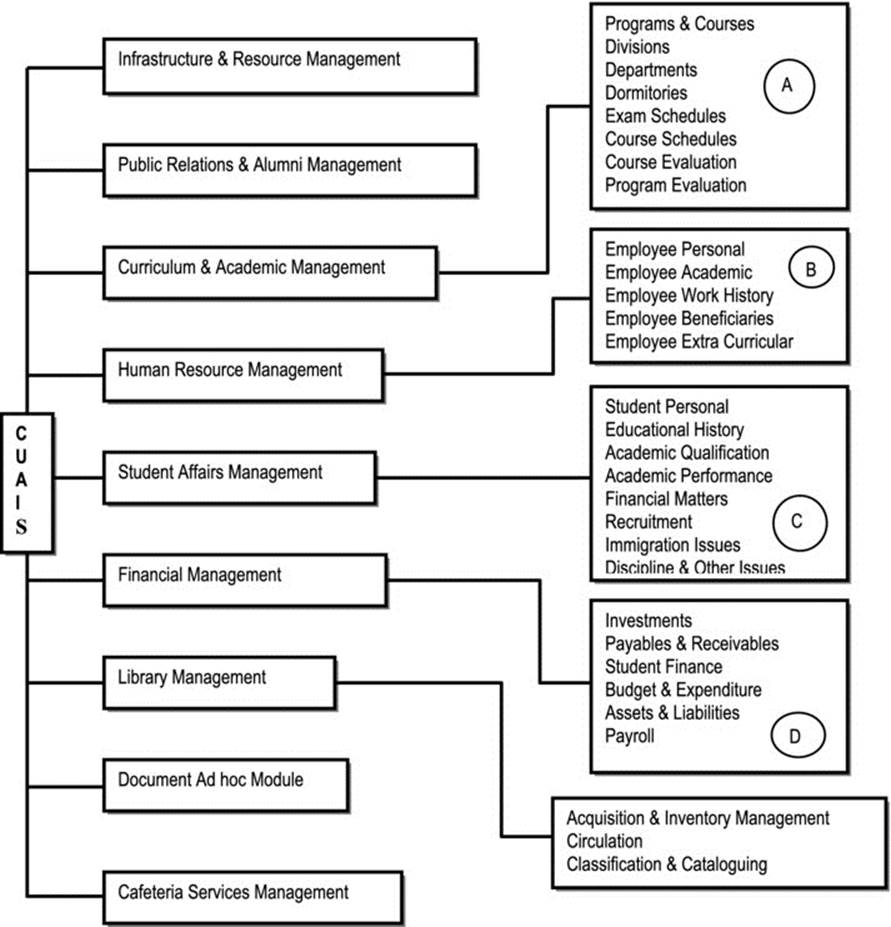
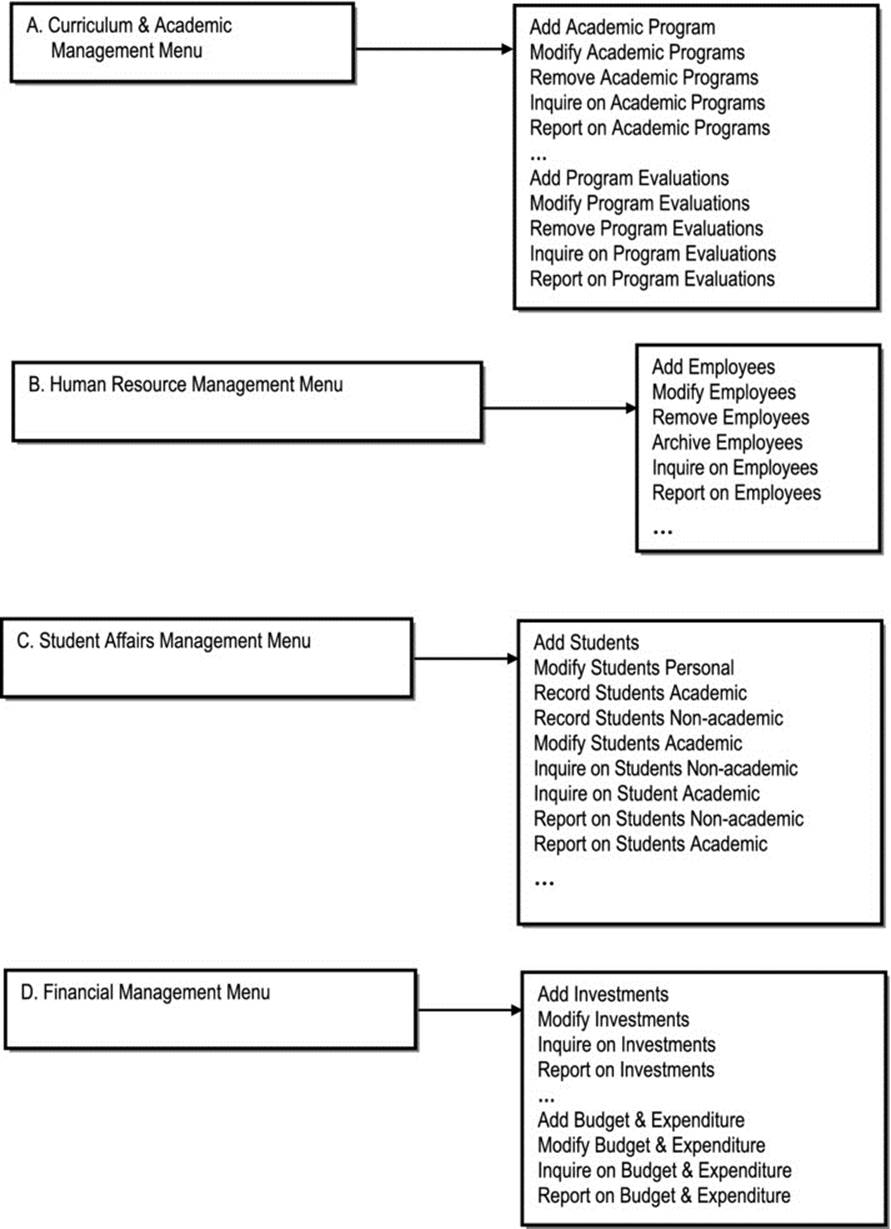
Figure 6-8. Partial User Interface Topology Chart for the CUAIS Project
6.5 Data Flow Diagrams
A data flow diagram (DFD) reflects the main information storage, information flow and processes of a software system all in one. It has relevance in the FO paradigm, as a useful analysis technique for representing the logic underlying a system. Figure 6-9 shows the symbols used. Notice the similarity between the process and the data storage symbols. In the original proposals for DFD, the process symbol is a rectangle with rounded corners, and a data storage symbol is a rectangle with one side opened. In the interest of simplicity, these intricacies have been relaxed.
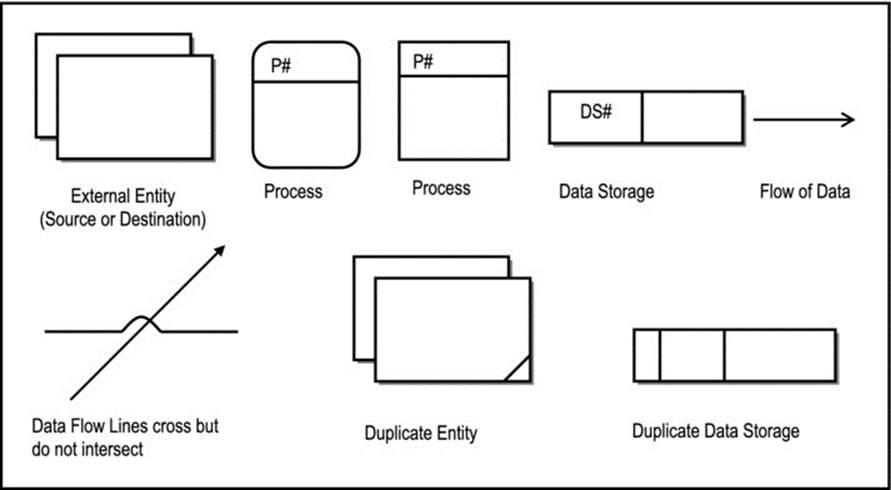
Figure 6-9. Symbols Used in DFD
The DFD provides the following advantages:
· It enhances understanding of the interrelatedness of systems and subsystems.
· It is an effective tool in communicating to users.
In drawing a DFD, the following conventions are employed:
· Indicate process number at the top of the process rectangle. Use decimals to indicate sub-processes.
· Indicate data store number at the left of the data store rectangle.
· Label entities, processes and data stores on the inside of respective rectangles.
· Develop DFD in a top-down manner; level-0 to level-n. Explode from one level to the next in order to reveal more detail about the processes. At each level, identify external entities, processes, data flows and data storages.
By way of illustration, let us revisit the inventory management system (IMS) introduced earlier in the chapter, and take a closer look. Consider the case where the manager of a supermarket, variety store, or auto-store desires such a system that will allow him/her to effectively keep track of products needed to keep the store in operation. In each of these cases, the system implementation will have several points of similarities with the other two scenarios, and a few points of differences. Let us for the moment concentrate on some of the similarities. This illustration does not attempt to cover all aspects of the IMS; rather it covers some of the salient features:
· Two obvious external entities that are crucial to the implementation of the software system are suppliers of inventory items and the customers who purchase from the business.
· Figure 6-10 provides a list of some important processes and data storage objects that would comprise the IMS (this is not a comprehensive list). As you view this, remember that the storage objects typically translate to information entities in the underlying database.
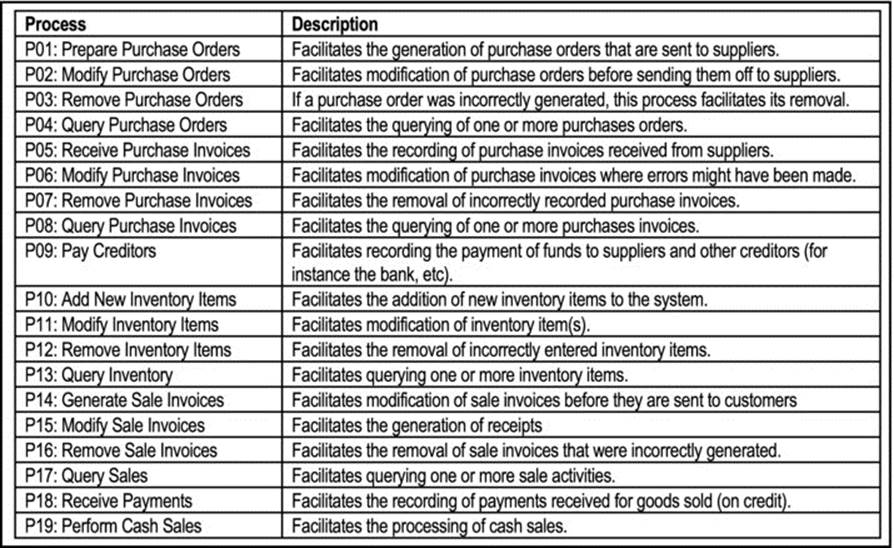
Figure 6-10a. Important Processes in an Inventory Management System
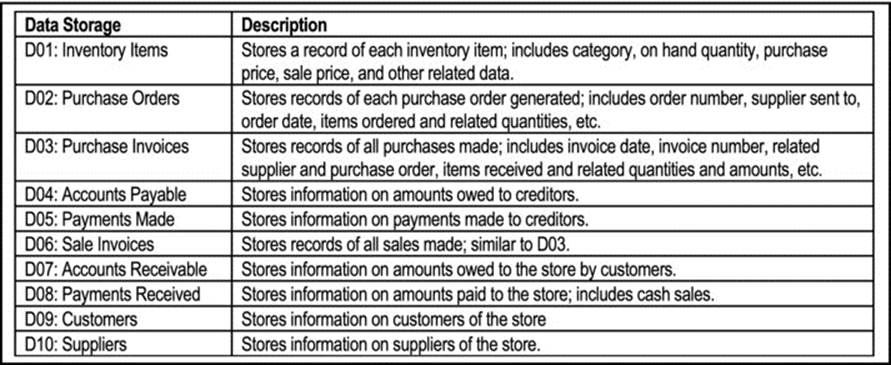
Figure 6-10b. Important Data Storage Objects in an Inventory Management System
Figure 6-11 shows a level 0 DFD called a context diagram. Notice that at this level, the system is perceived as a large process. Figure 6-12 shows a (partial) level-1 DFD of the system, highlighting processes P01, P05, P09, P11, P14, P18 and P19 (see Figure 6-10). These were chosen because they represent the most critical processes in the system. You would then have a choice as to how to continue refining your requirements: for each of the processes specified in your level-1 diagram (Figure 6-12), you could specify a level-2 DFD as illustrated in Figure 6-13, a program flowchart (see section 6.8), an IPO chart (review section 6.2.3), a Warnier-Orr diagram (discussed in chapter 12), an activity diagram (discussed in chapter 12), or an extended operation specification (discussed in chapter 12).
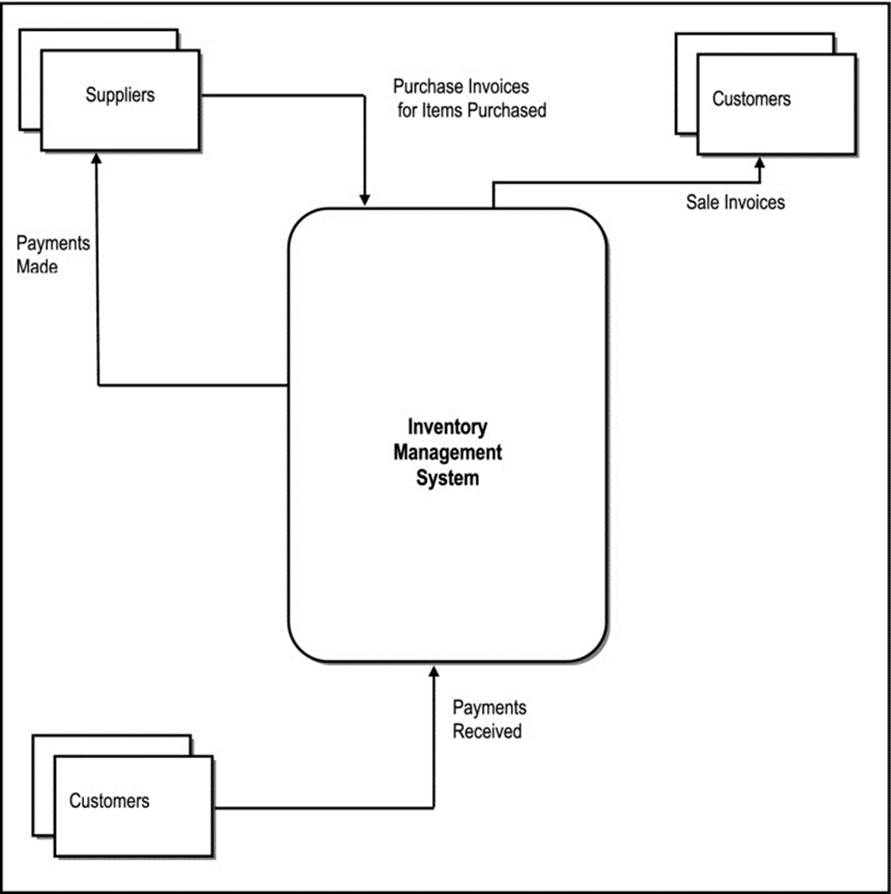
Figure 6-11. Context Diagram for the Inventory Management System
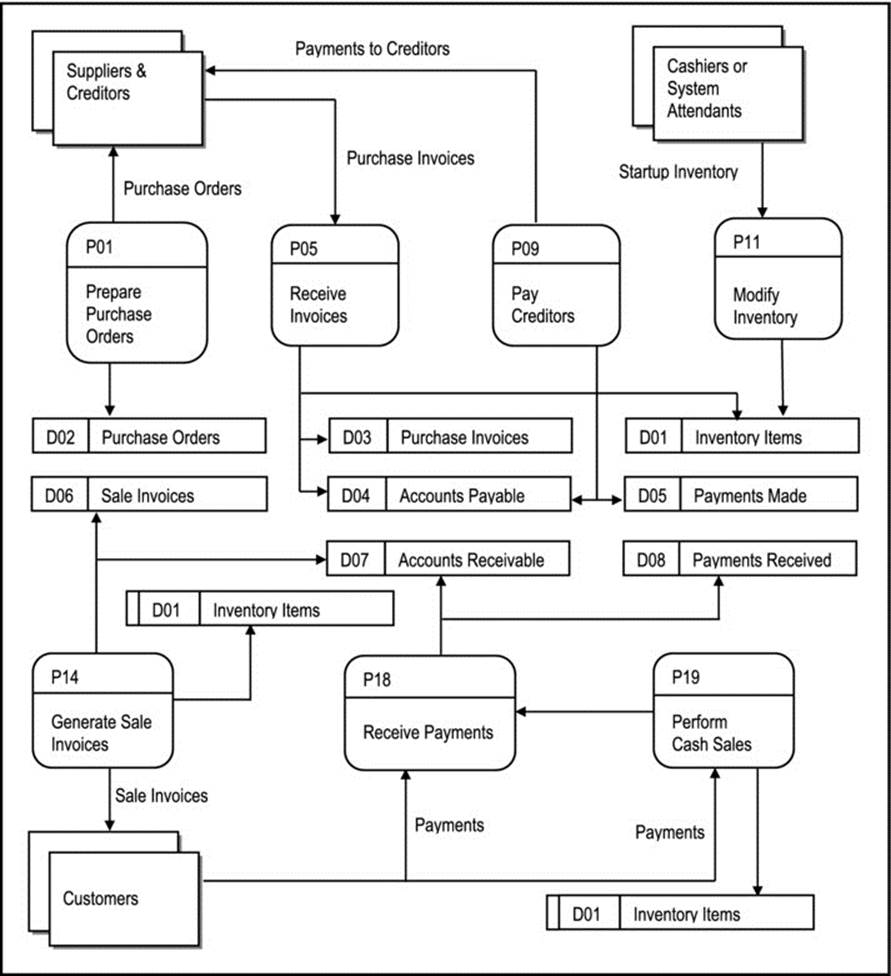
Figure 6-12. Level-1 DFD for the Inventory Management System
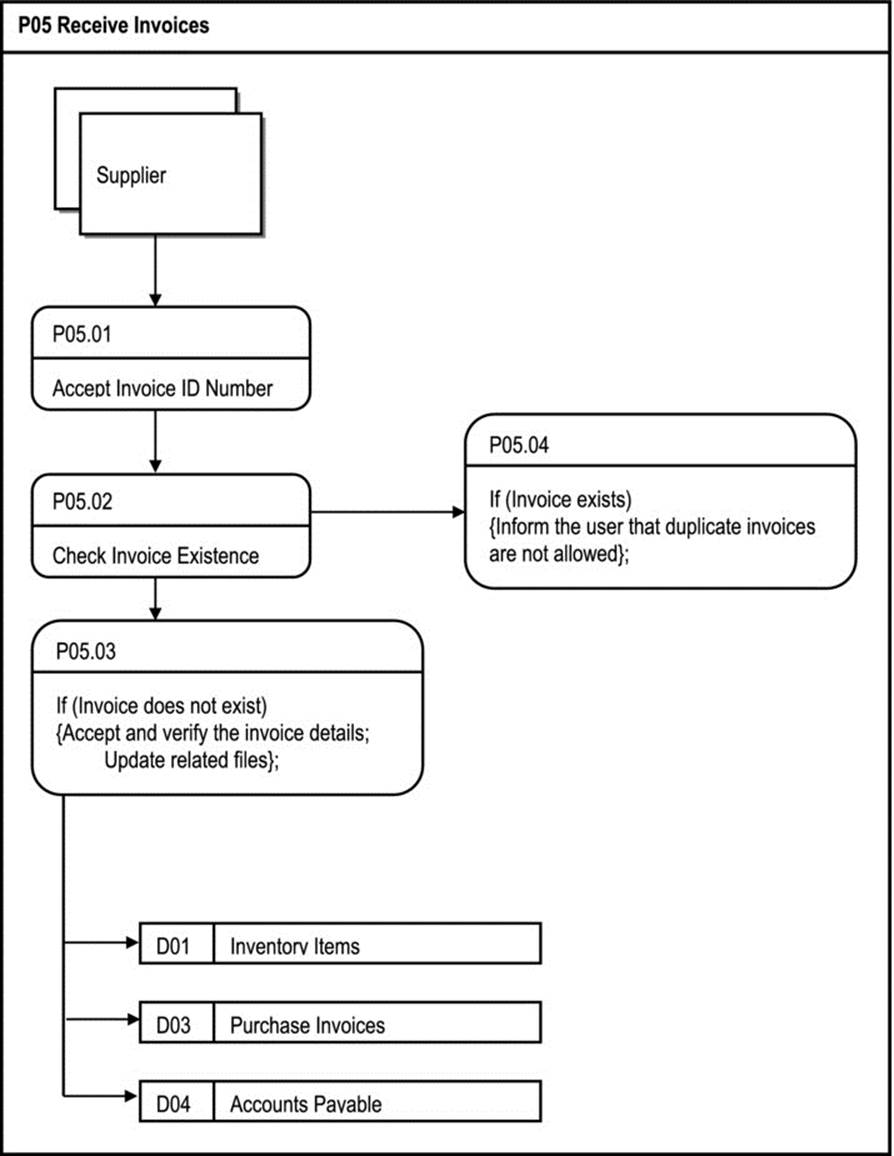
Figure 6-13. Level-2 DFD for Process P05 of the Inventory Management System
6.6 Object Flow Diagram
An object flow diagram (OFD) is typically used in OOSE to show how major software system components (super classes or subsystems) communicate with one another. It is normally used at a high level of system specification. Here, it has similarities to a DFD level-0 and an ITC at the highest level. Figure 6-14 illustrates an OFD for a financial management system. From this diagram, it is apparent that the central subsystem relates to financial transactions, and all other subsystems are related to this. For additional illustrations, see Figures 6-7, Figure 6-11 and Figure 9-7also.
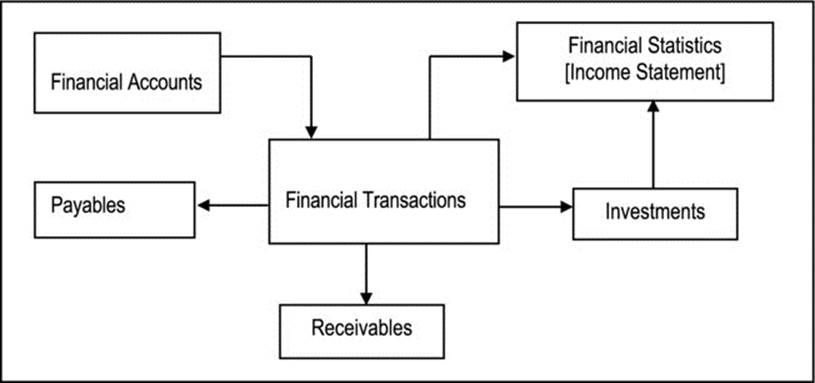
Figure 6-14. OFD for a Financial Management System
The term object flow diagram is to some extent a matter of semantics: in an OO environment it may be used, or an ITC may render it unnecessary; in a traditional (FO) environment a DFD would have been used.
6.7 Other Contemporary Diagramming Techniques
Still, other diagramming techniques abound:
· The entity-relationship diagram (ERD) will be introduced in chapter 10, but a full treatment is left for a course in database systems. The corresponding object-relationship diagram (ORD) of the OO paradigm will also be introduced in chapter 10.
· The fern diagram, event diagram and other OO techniques will also be left for your course in OOSE or OOM. However, they are discussed in appendices 4 – 6.
· The UML (Unified Modeling Language) notation includes object structure diagram (OSD), use-case diagram, ORD, activity diagram, collaboration diagram, among other techniques. These will be introduced in chapters 9, 10, and 12, with additional discussion in appendices 4 – 6. However, a full discussion is best done in a course in OOSE or OOM.
· The Warnier-Orr diagram will be discussed in chapter 12.
The remainder of this section will briefly introduce the state transition diagram and the finite state machine, while leaving the excessive details for more advanced courses.
6.7.1 State Transition Diagram
A state transition diagram is used, primarily in OOSE, to represent the allowable state transitions associated with an object. Figure 6-15 provides an illustration of a state transition diagram for an Employee object type. All instances of this object type will be subject to the transitions represented in the diagram.
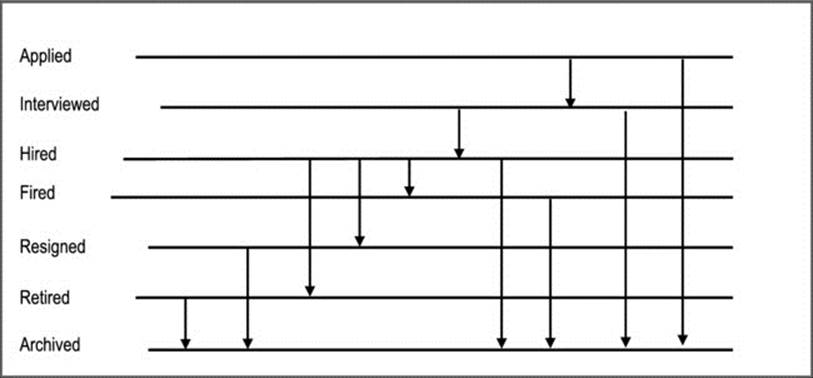
Figure 6-15. State Transition Diagram of Employee Object
6.7.2 Finite State Machine
An alternative to the state transition diagram is the finite state machine (FSM), also called the state diagram in some texts. Though existent before object technology (for instance in compiler design), FSMs find very useful application in here.
In an FSM (also referred to as state diagram) nodes are states; arcs are transitions labeled by event names (the label on a transition arc is the event name causing the transition). The state-name is written inside the node. Figure 6-16 illustrates an FSM for the state transition diagram ofFigure 6-15.
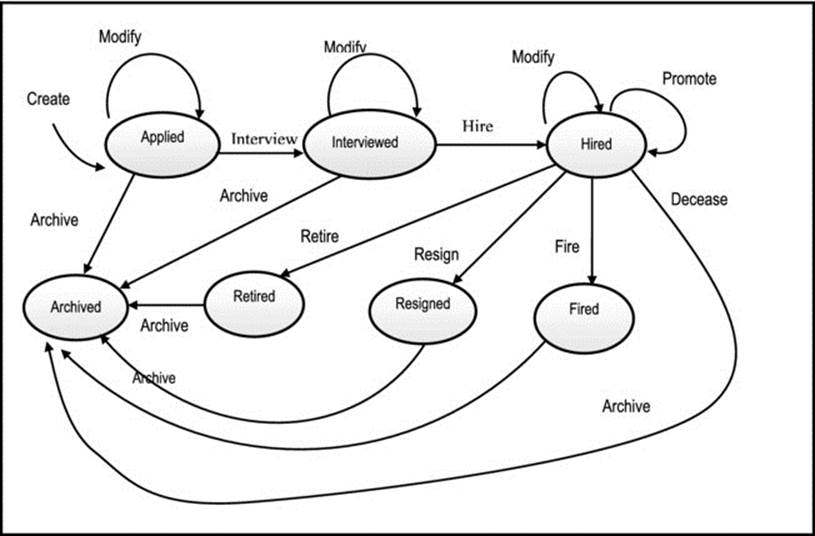
Figure 6-16. FSM for Employee
As you can see, a significant advantage of the FSM over the state transition diagram is that you can show operations that cause change of state as well as those that do not cause change of state.
6.8 Program Flowchart
The program flowchart is a traditional technique of the FO paradigm that represents functional logic. Its use in contemporary software design has been overtaken by other techniques such as algorithms (in pseudo-code), Warnier-Orr diagrams, and activity diagrams. It is assumed that from your earlier courses, you have gained mastery of algorithm development; as for Warnier-Orr diagrams, and activity diagrams, these will be covered later in the course (chapter 12). The symbols used for program flowcharting are shown in Figure 6-17. The main structures (simple sequence, selection, and iteration) are also illustrated in the Figure 6-18.
The main advantages of programming flow chart are easy debugging, economy in writing and easy tractability. The main flaw is its limitation to non-parallel logic.
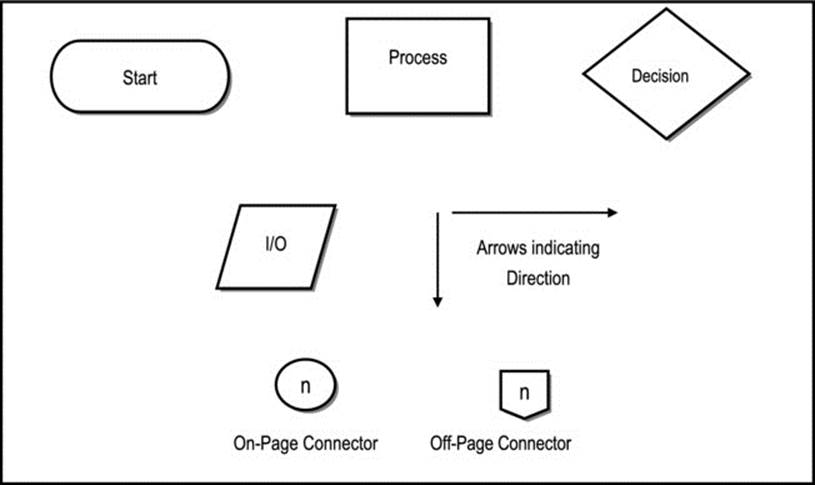
Figure 6-17. Symbols Used in Program Flow Chart
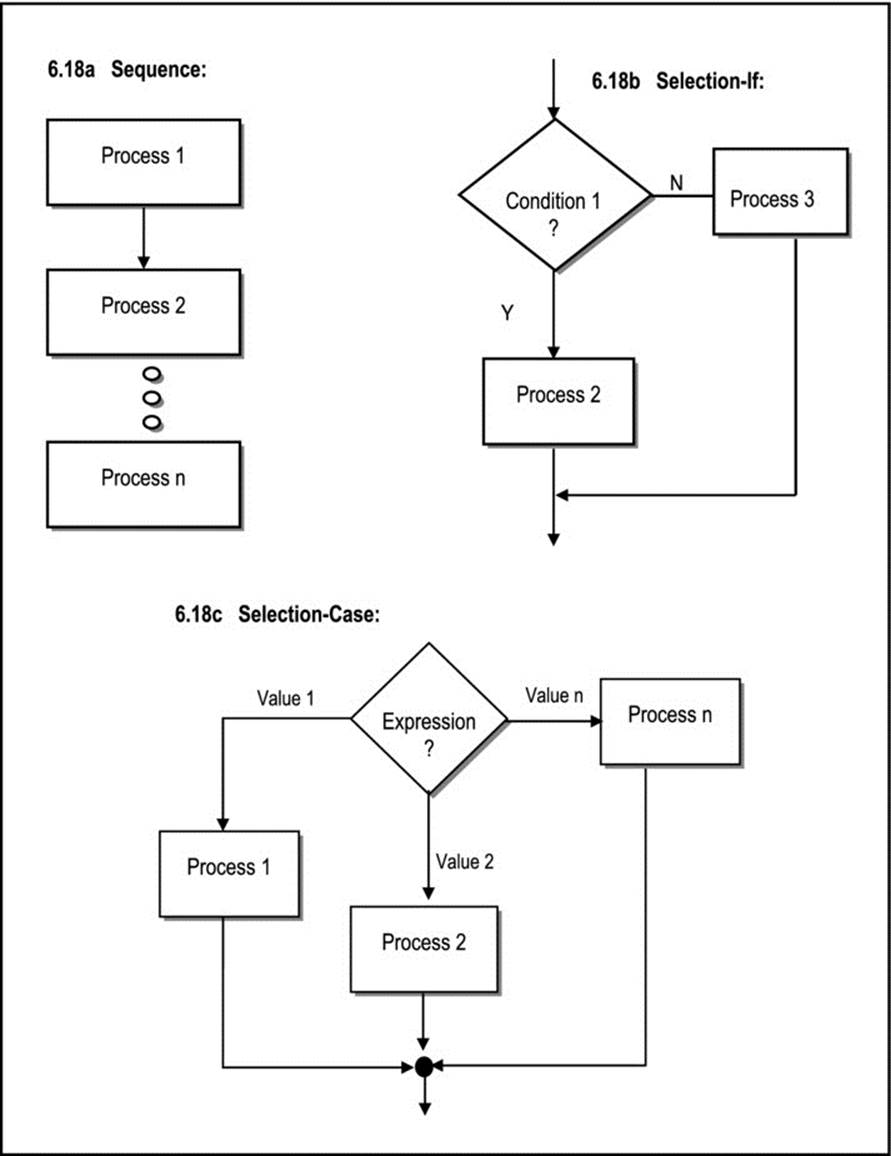
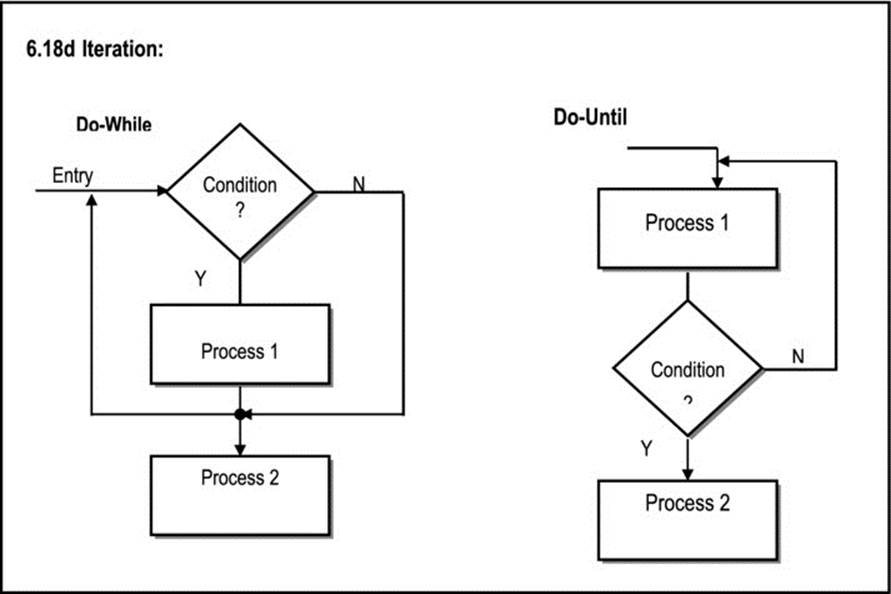
Figure 6-18. Control Structures for Program Flow Chart
6.9 Summary and Concluding Remarks
It is time once again to summarize what we have covered in this chapter:
· The software engineer relies on diagrams to document and communicate information concerning the requirements of a software system.
· Traditional system flow charts include information-oriented flowcharts, process oriented flow charts, HIPO charts, and data flow diagrams (DFDs).
· Traditional logic charts include decision tables, decision trees, and program flow charts.
· The procedure analysis chart (PAC) is useful in both FO and OO paradigms, particularly for business process reengineering (BPR).
· OO system diagrams include object flow diagrams (OFDs), O-R diagrams, state transition diagrams, finite state machine (FSMs), information topology charts (ITCs), and user interface topology charts (UITCs), fern diagrams, object structure diagrams, and UML diagrams.
· OO logic diagrams include event diagrams and activity diagrams.
· Diagrams that apply to both FO and OO paradigms include Warnier-Orr diagrams, E-R diagrams, finite state machine (FSMs), information topology charts (ITCs), and user interface topology charts (UITCs), procedure analysis charts (PACs), decision tables and decision trees.
There is only one way to gain mastery of these techniques — by applying them to problems. Take the time to review appendix 8 and appendix 9 once more; you will see some applications of some of the techniques. The next chapter will continue the discussion of some techniques not covered in this chapter.
6.10 Review Questions
1. What are the advantages of using diagrams?
2. What information is conveyed by the following diagrams?
· Information oriented flowchart
· Process oriented flowchart
· Hierarchy input process output chart
· Procedure analysis chart
· Information topology chart
· User interface topology chart
· Data flow diagram
· Object flow diagram
· State transition diagram
· Finite state machine
· Program flowchart
3. Compare the following diagrams:
· Information topology chart versus hierarchy input process output chart
· Process oriented flow chart versus data flow diagram
· State transition diagram versus finite state machine
4. A supermarket wishes to computerize its operation. The main issues to address are as follows:
· Purchases from external vendors are represented by invoices
· Purchases affect the Purchase Log (file), as well as Accounts Payable (file) and the Inventory (file)
· Inventory Management is affected by purchases and sales
· Every inventory item belongs to a category
· Sale of goods to customers (credit sales) as well as cash sales affects the Sales Log (file), the Accounts Receivable, as well as the Inventory
From the information given, propose the following:
f. A POF or DFD of the system
g. An ITC and UITC
5. A Library Management System (LMS) is being constructed. The software engineer is focusing on the information entity called Book. It was discovered that a Book object could be in any of the following states: ordered, invoiced, loaned, shelved, archived, lost,stolen.
· Propose a finite state machine and state transition diagram for the Book object type.
· Compare the information conveyed by both diagrams.
6.11 References and/or Recommended Readings
[Foster, 1999] Foster, Elvis C. Labour Market Information System: Thesis. Mona, Jamaica: Department of Mathematics and Computer Science, University of the West Indies, 1999. See section 4.4.1.
[Harris, 1995] Harris, David. Systems Analysis and Design: A Project Approach. Fort Worth, TX: Dryden Press, 1995. See chapter 4.
[Kendall, 2005] Kendall, Kenneth E. and Julia E. Kendall. Systems Analysis and Design 6th ed. Upper Saddle River, NJ: Prentice Hall, 2005. See chapter 7.
[Long, 1989] Long, Larry. Management Information Systems. Eaglewood Cliffs, NJ: Prentice Hall, 1989. See chapter 12.
[Pfleeger, 2006] Pfleeger, Shari Lawrence. Software Engineering Theory and Practice 3rd ed. Upper Saddle River, NJ: Prentice Hall, 2006. Chapter 4.
[Schach, 2005] Schach, Stephen R. Object-Oriented and Classical Software Engineering 6th ed. Boston, MA: McGraw-Hill, 2005. See chapters 11 and 12.
[Sommerville, 2006] Sommerville, Ian. Software Engineering 8th ed. Reading, MA: Addison-Wesley, 2006. See chapter 8.
All materials on the site are licensed Creative Commons Attribution-Sharealike 3.0 Unported CC BY-SA 3.0 & GNU Free Documentation License (GFDL)
If you are the copyright holder of any material contained on our site and intend to remove it, please contact our site administrator for approval.
© 2016-2026 All site design rights belong to S.Y.A.