Software Engineering: A Methodical Approach (2014)
PART B. Software Investigation and Analysis
Chapter 8. Project Management Aids
In this chapter, we examine three project management aids — PERT/CPM, Gantt charts, and project management software. The techniques are useful for managing resources, as well as monitoring of targets and expenditure during a software engineering project. The techniques are also useful in planning the software engineering project — a process which commences with the initial software requirement (ISR), is refined in the requirements specification, and further refined in the design specification. The chapter proceeds under the following captions:
· PERT and CPM
· The Gantt Chart
· Project Management Software
· Summary and Concluding Remarks
8.1 PERT and CPM
PERT is an acronym for Program Evaluation and Review Technique; CPM is an acronym for Critical Path Method. Developed in the 1950's by the US Navy, the two techniques are normally used together; they constitute the most popular methodology for managing projects.
Projects managed with PERT/CPM need not be related to information systems or software engineering; the technique is applicable to all disciplines.
Among the advantages of PERT/CPM are the following:
· The project is represented graphically, showing important events in some form of chronology.
· The critical path is identified (no delay is allowed along the critical path).
· The technique (CPM) allows for analysis and management of resource scheduling.
· The technique shows areas where tradeoffs in time or resources might increase the possibility of meeting major schedule targets.
In planning and preparing the PERT/CPM model for a project, the following steps are required:
1. Itemize activities in a tabular form showing for each activity its immediate predecessor, description, estimated time (duration).
2. Draw PERT Diagram using either the activity-on-arrow (AOA) approach or the activity-on-node (AON) approach.
3. For each activity (event), calculate the earliest start time (ES), the earliest finish time (EF), the latest start time (LS), and the latest finish time (LF). Also indicate the activity’s duration (D).
4. Determine the critical path — the path through the network that has activities that cannot be delayed without delaying the entire project.
5. Conduct a sensitivity analysis to aid and inform the resource management process.
These steps are best illustrated by an example, so we will proceed with one.
Example 1: Let us suppose that we are involved in a software engineering project to design, construct, and implement a software product. We will construct an activity table and then refine it into a PERT diagram.
8.1.1 Step 1: Tabulate the Project Activities
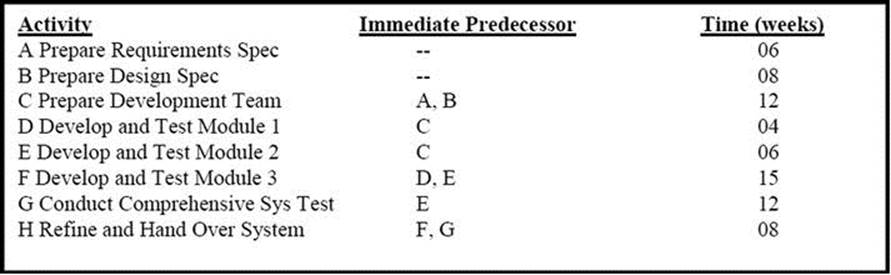
Figure 8-1 shows the schedule for our software engineering project. Notice that except for the starting activity, each activity has a predecessor. Each activity also has an estimated duration (typically expressed in days, but any unit of time may be used).
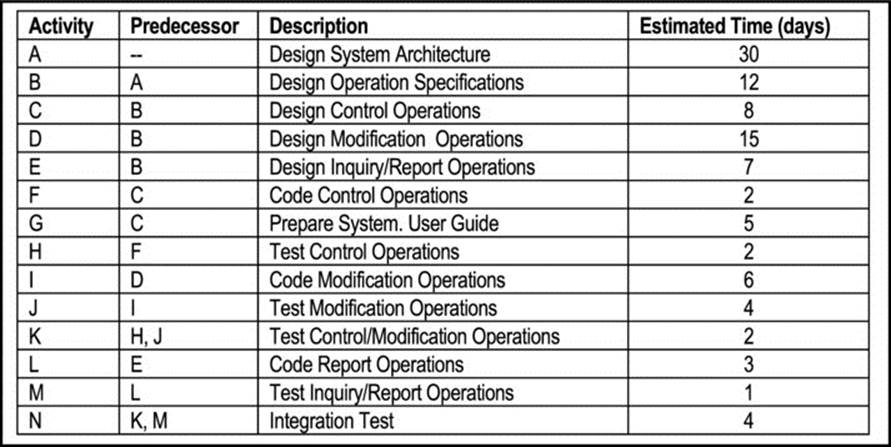
Figure 8-1. Schedule of Activities for a Project
8.1.2 Step 2: Draw the PERT Diagram
The PERT Diagram is shown in Figure 8-2. Note that the AON convention is followed. Note also the use of dummy nodes (activities) to improve the clarity and readability of the diagram.
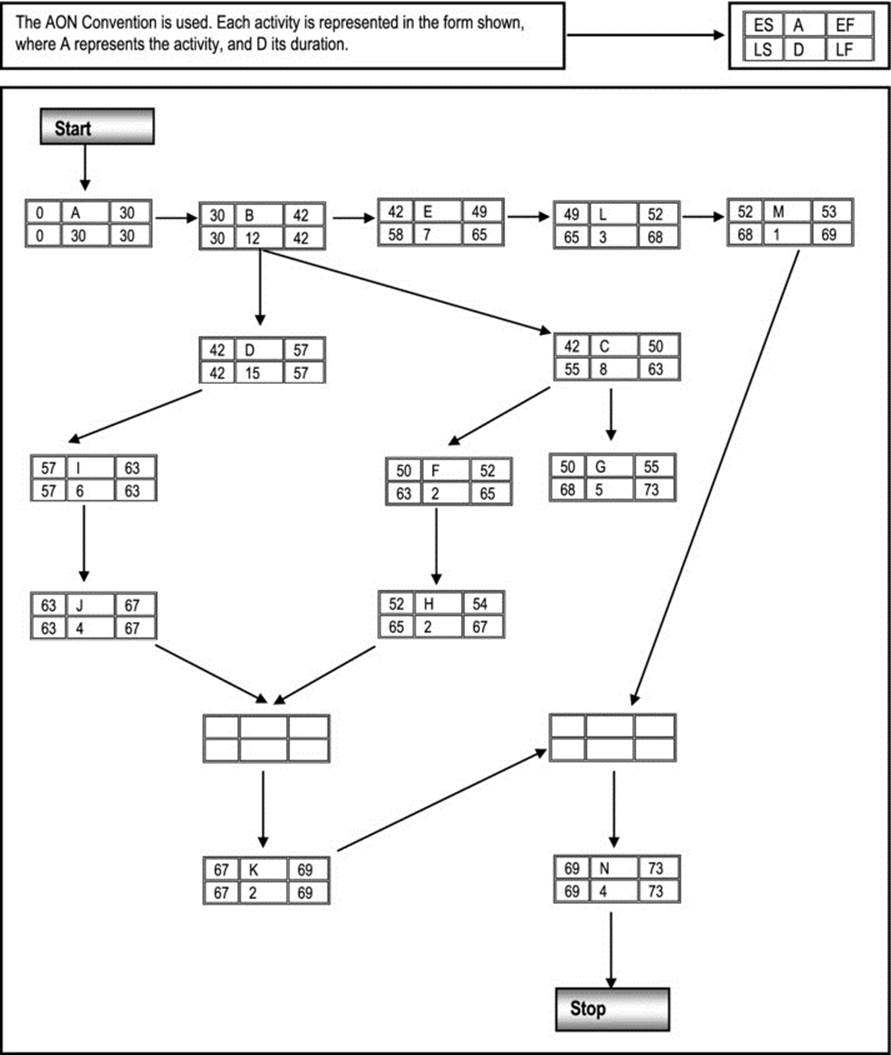
Figure 8-2. PERT Diagram for the Project
In keeping with convention, a start node and a stop node have been introduced. They are dummy nodes that have no duration.
8.1.3 Step 3: Determine ES, EF, LS and LF for each Activity
The ES, EF, LS, LF values for each activity is shown in Figure 8-2. These values are to be calculated base on the formulae and rules shown in Figure 8-3:
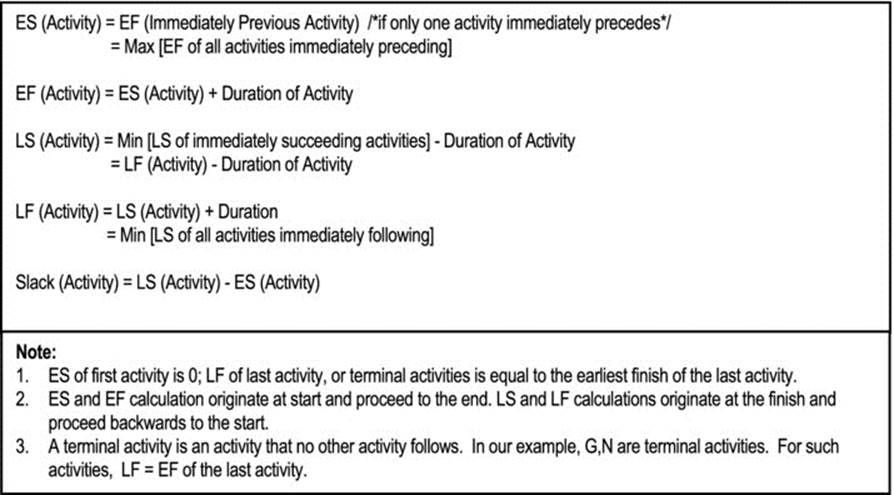
Figure 8-3. Basic PERT Diagram Calculations
8.1.4 Step 4: Determine the Critical Path
The critical path is the path with zero slack. No delay can be allowed on the critical path. In the example, the critical path is A B D I J K N. The project should not be allowed to overrun the critical path time.
8.1.5 Step 5: Conduct a Sensitivity Analysis
PERT sensitivity analysis relates to two main matters: determination of the estimated time for each activity, and analysis of the prospect of crashing the project.
Determination of estimated time is usually done using the formulae shown in Figure 8-4. It must be stated however, that in many cases, rather than calculating the estimated time on each activity, and experienced software engineer will place an estimated time period on each activity, based on the rigor of that activity, the talents and skills of the software engineering team, and comparative knowledge of the duration of similar activities on other project(s).
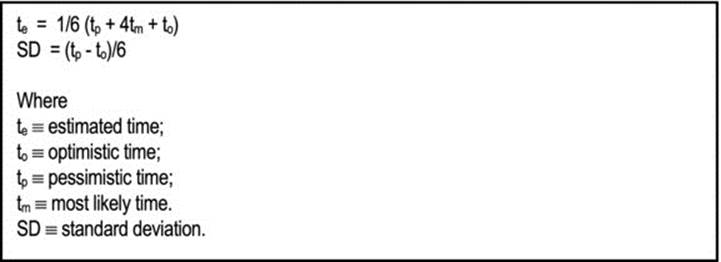
Figure 8-4. Calculating Estimated Time for an Activity
Crashing is the process of shortening the project at increased cost. The cost of crashing is evaluated and weighed against the cost of missing the project deadline. A final decision is then made.
Note:
· Only activities on the critical path must be crashed.
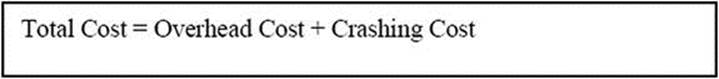
· Crashing may be considered when the cost of crashing is less than the overhead cost for the crash period contemplated. The total cost of the project would then be reduced.
The critical path can be also used as a guide in resource planning and management, as well as cost management.
Example 2: Let us use the project of Example 1 to carry out a basic sensitivity analysis.
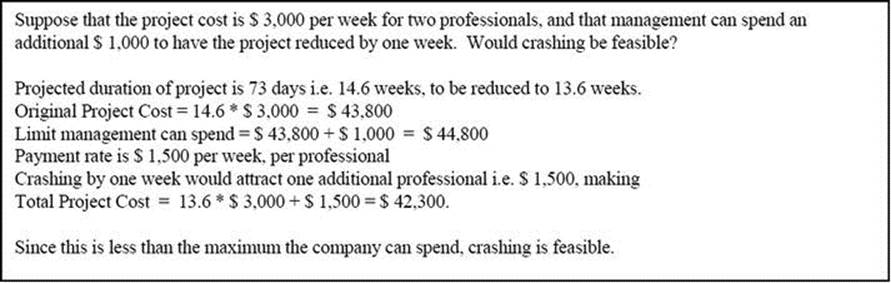
![]()
8.2 The Gantt Chart
The Gantt chart was devised by Henry Gantt (1920's). The project is represented on a bar chart based on the following guidelines:
· Tasks are listed vertically.
· A horizontal time scale is used to indicate time duration.
· A bar is used to depict activities.
· Some indication is given of the percentage completion of each activity (for e.g. by color code).
With the advance of PERT / CPM, the Gantt chart is best used to emphasize the critical path activities. The main advantages are:
· The chart is simple and easy to read.
· The chart can be used to manage the progress of activities on a software engineering project.
Figure 8-5 illustrates the Gantt chart for the project discussed in the previous section. On the diagram, the critical path activities are represented by grey bars, while non-critical-path activities are represented by bars that are not shaded. A third color code is often used to indicate the level of completion of certain activities.
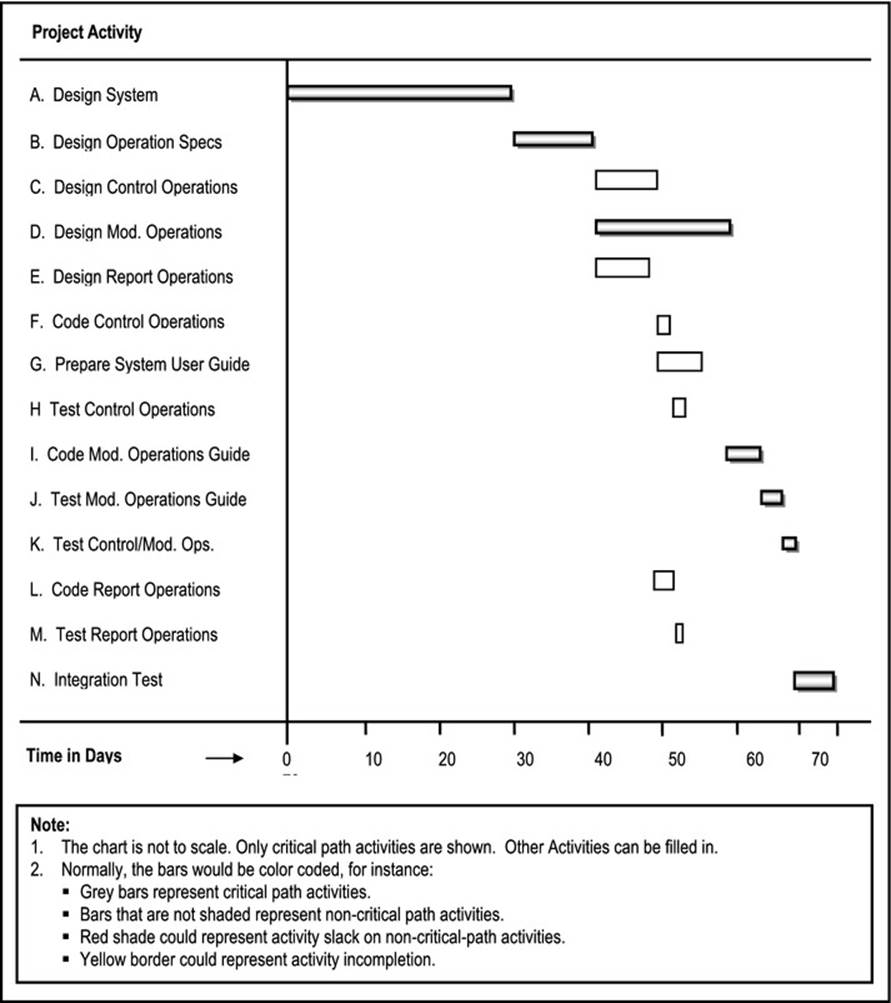
Figure 8-5. Gantt Chart for the Sample Project Showing Critical Path Activities
The Gant chart, combined with the PERT diagram constitutes a powerful project management tool. Following are some ways the two techniques may be employed:
· The lead software engineer can make informed decisions about assigning certain responsibilities to members of the software engineering team. Since critical path activities cannot be delayed, such activities are usually assigned to stronger members of the team. Conversely, non-critical activities with longer slack times can be assigned to weaker members of the team.
· The project manager may use the techniques to assist in monitoring the progress of the project on a day-to-day basis.
· Should this become necessary, informed decisions about crashing can be made by identifying the critical path activities.
8.3 Project Management Software
You might be wondering, am I required to draw these PERT diagrams and Gant charts from scratch? The honest answer to this question is yes, you should know how to draw these diagrams from scratch. However, I believe what you want to know is whether there are software systems that can assist you in using these techniques. The answer to this inquiry is also a resounding yes. There is a wide range of project management software systems that are available in the marketplace. Reference [Capterra, 2008] provides a comprehensive list of several such software alternatives that you can peruse.
In choosing a project management software system, here are some desirable features that should be facilitated:
· Maintenance of a calendar of important dates
· Management of multiple projects
· Specification of project activities for each project
· Choice from techniques such as PERT diagram, Gantt chart, and any other technique available
· Automated generation of the desired diagram
· Ability to print diagrams or save them in different formats
· Management of other resources such as budget, as well as physical resources
· Management of project requirements
· Project estimations
· Scheduling of activities for team members
· Progress tracking for overall project
· Progress tracking for team members
· Cost-to-completion tracking for each project
· Risk assessment and management
· Ability to probe what-if scenarios
In addition to project management software products, some of the more sophisticated software planning and development tools that are available (as discussed in section 2.4.5) have project management facilities incorporated in them. Thus, the software engineer does not have to do all the hard work from scratch; you can use technology to make an otherwise very challenging job exciting and enjoyable.
8.4 Summary and Concluding Remarks
Here is a summary of what has been discussed in this chapter:
· A PERT diagram is a graphical representation of a project schedule that facilitates easy management of the project.
· Each node on the PERT diagram must have its name, duration (D), earliest start time (ES), earliest finish time (EF), latest start time (LS), and latest finish time (LF) clearly indicated.
· ES and EF calculations originate at the start point and proceed to the final point of the project. LS and LF calculations originate at the final point and work backwards to the starting point.
· The critical path through a PERT diagram is the path that has zero slack on all its activities.
· Crashing is the process of shortening a project at increased cost. If the sum of the cost of crashing and the overhead cost is within the limit that the organization is prepared to spend, then crashing is feasible.
· The Gantt chart is best used to emphasize the critical path activities.
· A project management software is a software system that facilitates easy management of a project. These products are readily available in the marketplace.
Armed with this knowledge, you can now incorporate an impressive project schedule in your RS, and thus complete your second major deliverable. The next section of the course discuses software design issues.
8.5 Review Questions
1. Clearly outline the steps involved in conducting a PERT-CPM analysis.
2. Explain how a PERT diagram and a Gantt chart may be used to assist in the management of a software engineering project.
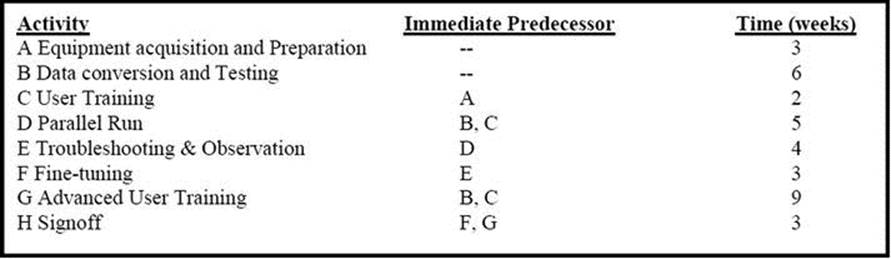
3. A project involving the installation of a computer system consists of eight activities as shown in the activity table below:
a. Draw the PERT network for this project.
b. Identify the critical path.
c. What is the expected completion time for the project?
d. Identify three activities that can be delayed and for each, determine the slack.
4. LMX Software considering developing a new software product. The project activities identified so far are shown below:
a. Develop a PERT network for the project
b. Identify the critical path.
c. Determine the total project duration.
d. Identify three activities that can be delayed and for each, determine the slack.
8.6 References and/or Recommended Readings
[Anderson, 1994] Anderson, David, Denis Sweeney and Thomas Williams. Introduction to Management Science: Quantitative Approaches to Decision Making 7th ed. New York, NY: West Publishing, 1994. See chapter 10.
[Capterra, 2008] Project Management Software Directory. http://www.capterra.com/project-management-solutions (accessed June 2008).
[Harris, 1995] Harris, David. Systems Analysis and Design: A Project Approach. Forth Worth, TX: Dryden Press, 1995. See chapters 5 and 6.
[Peters, 2000] Peters, James F. and Witold Pedrycz. Software Engineering: An Engineering Approach. New York, NY: John Wiley & Sons, 2000. See chapter 4.
[Pfleeger, 2006] Pfleeger, Shari Lawrence. Software Engineering Theory and Practice 3rd ed. Upper Saddle River, NJ: Prentice Hall, 2006. See chapter 3.
[Sommerville, 2006] Sommerville, Ian. Software Engineering 8th ed Reading, MA: Addison Wesley, 2006. See chapter 5.
[Taha, 1987] Taha, Hamdy A. Operations Research: An Introduction 4th ed. New York, NY: McMillan, 1987. See chapter 13.
All materials on the site are licensed Creative Commons Attribution-Sharealike 3.0 Unported CC BY-SA 3.0 & GNU Free Documentation License (GFDL)
If you are the copyright holder of any material contained on our site and intend to remove it, please contact our site administrator for approval.
© 2016-2025 All site design rights belong to S.Y.A.