Product Details Lean Enterprise: How High Performance Organizations Innovate at Scale (2015)
Part II. Explore
Chapter 5. Evaluate the Product/Market Fit
The Edge…there is no honest way to explain it because the only people who really know where it is are the ones who have gone over it.
Hunter S. Thompson
In this chapter we will discuss how to identify when a product/market fit has been achieved and how to exit the explore stage and start exploiting our product with its identified market. We’ll show how to use customized metrics to understand whether we are achieving measurable business outcomes while continuing to solve our customers’ problems by engaging them throughout our development process.
We will cover how organizations set themselves up for success with the right strategy, structure, and support, and how they find internal and external customers to provide valuable feedback and insight as they grow their product. We will address how to leverage existing capabilities, services, and practices to scale our product while seeking internal advocates within the organization to collaborate with. Finally, we’ll describe the metrics and the engines of growth that help us manage the transition between business model horizons as we begin to scale our solution.
Innovation Accounting
It is not enough to do your best; you must know what to do, and then do your best.
W. Edwards Deming
We live in a world of data overload, where any argument can find supporting data if we are not careful to validate our assumptions. Finding information to support a theory is never a problem, but testing the theory and then taking the correct action is still hard.
As discussed in Chapter 3, the second largest risk to any new product is building the wrong thing. Therefore, it is imperative that we don’t overinvest in unproven opportunities by doing the wrong thing the right way. We must begin with confidence that we are actually doing the right thing.How do we test if our intuition is correct, especially when operating in conditions of extreme uncertainty?
Eric Ries introduced the term innovation accounting to refer to the rigorous process of defining, experimenting, measuring, and communicating the true progress of innovation for new products, business models, or initiatives. To understand whether our product is valuable and hold ourselves to account, we focus on obtaining admissible evidence and plotting a reasonable trajectory while exploring new domains.
Traditional financial accounting measures such as operating performance, cash flow, or profitability indicator ratios like return on investment (ROI)—which are not designed for innovation—often have the effect of stifling or killing new products or initiatives. They are optimized, and more effective, for exploiting well-understood domains or established business models and products. By definition, new innovations have a limited operating history, minimal to no revenue, and require investment to start up, as shown in Figure 5-1. In this context, return on investment, financial ratio analysis, cash flow analysis, and similar practices provide little insight into the value of a new innovation nor enable its investment evaluation against the performance of well-established products through financial data comparison alone.
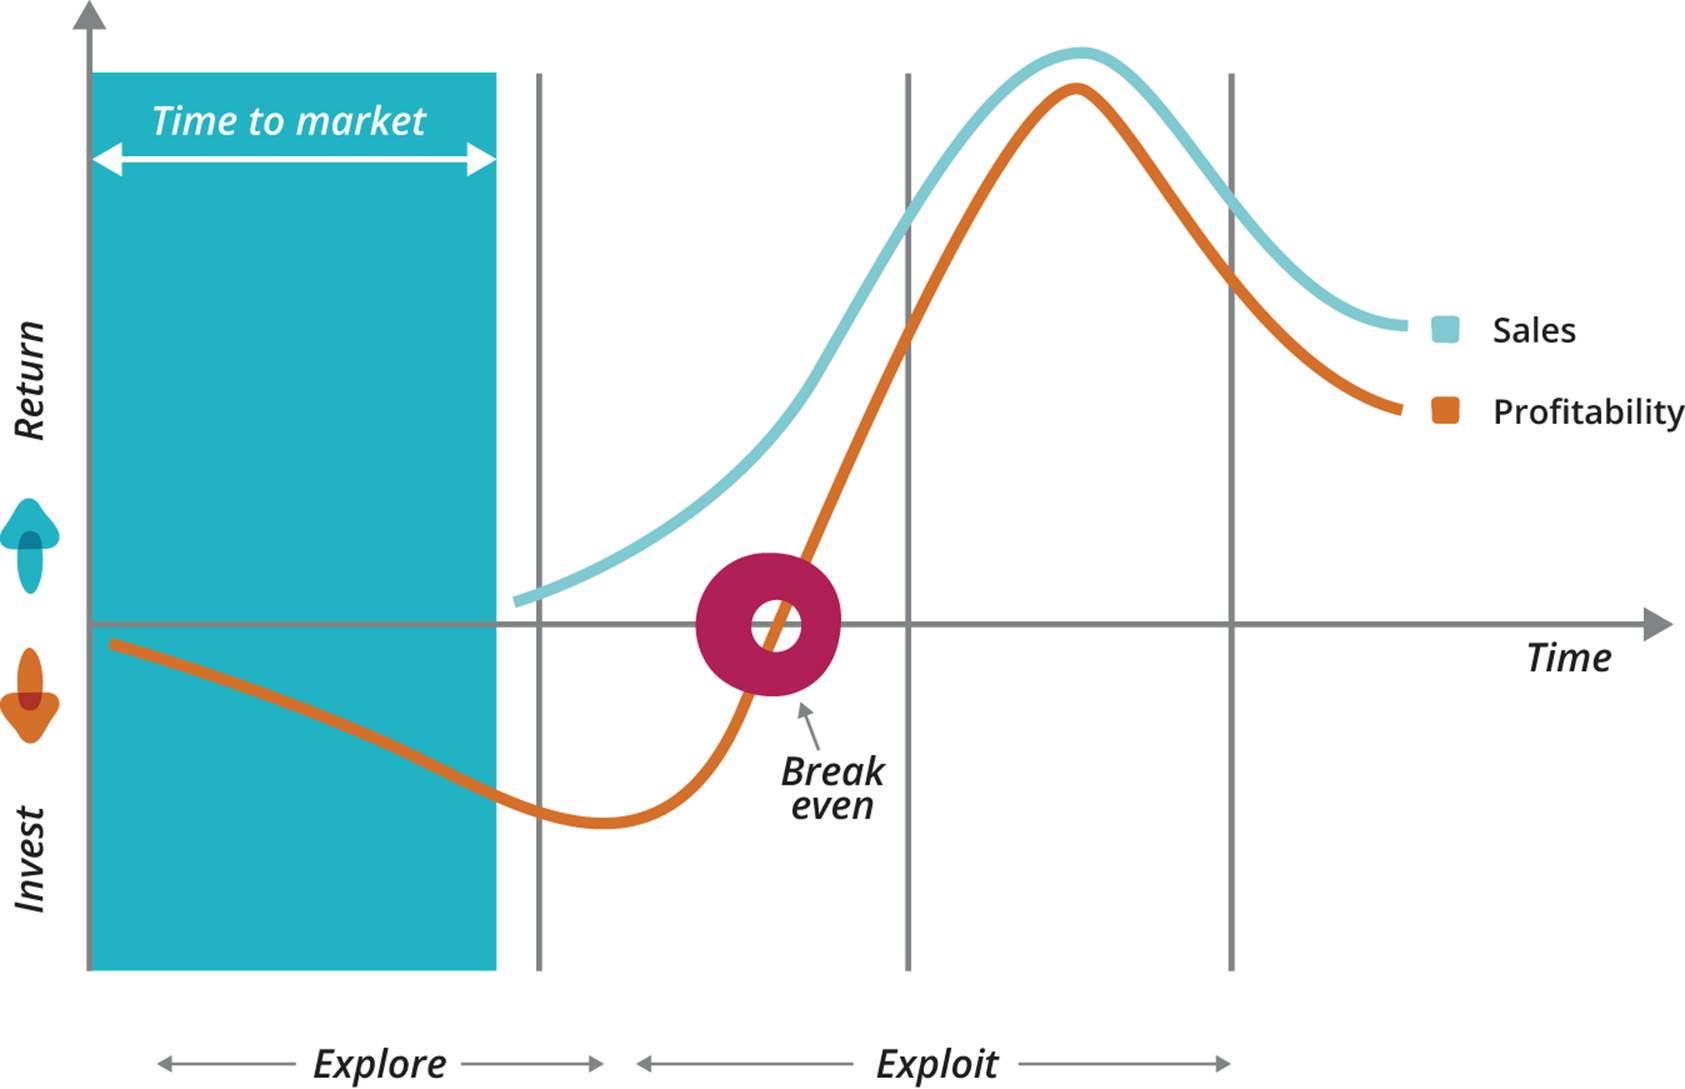
Figure 5-1. Profitability-to-sales ratios for early-stage innovations
When exploring, accounting must not be ignored or deemed irrelevant. It simply needs to be interpreted differently to measure the outcomes of innovation and early-stage initiatives. Our principles of accounting and measurement for innovation must address the following goals:
§ Establish accountability for decisions and evaluation criteria
§ Manage the risks associated with uncertainty
§ Signal emerging opportunities and errors
§ Provide accurate data for investment analysis and risk management
§ Accept that we will, at times, need to move forward with imperfect information
§ Identify ways to continuously improve our organization’s innovation capability
MEASUREMENT FALLACY
“What you measure is what you get”—Kaplan and Norton.90
One of the key ideas of Eric Ries’ The Lean Startup is the use of actionable metrics. He advocates that we should invest energy in collecting the metrics that help us make decisions. Unfortunately, often what we tend to see collected and socialized in organizations are vanity metrics designed to make us feel good but offering no clear guidance on what action to take.
In Lean Analytics, Alistair Croll and Benjamin Yoskovitz note, “If you have a piece of data on which you cannot act, it’s a vanity metric…A good metric changes the way you behave. This is by far the most important criterion for a metric: what will you do differently based on changes in the metric?”91 Some examples of vanity metrics and corresponding actionable metrics are shown in Table 5-1.92 93 94
|
Vanity |
Actionable |
|
Number of visits. Is this one person who visits a hundred times, or a hundred people visiting once? |
Funnel metrics, cohort analysis. We define the steps of our conversion funnel, then group users and track their usage lifecycle over time. |
|
Time on site, number of pages. These are a poor substitute for actual engagement or activity unless your business is tied to this behavior. They address volumes, but give no indication if customers can find the information they need. |
Number of sessions per user. We define an overall evaluation criterion for how long it should take for a session (or action) to complete on the site, then measure how often users perform it successfully. |
|
Emails collected. A big email list of people interested in a new product may be exciting until we know how many will open our emails (and act on what’s inside). |
Email action. Send test emails to a number of registered subscribers and see if they do what we tell them to do. |
|
Number of downloads. While it sometimes affects your ranking in app stores, downloads alone don’t lead to real value. |
User activations. Identify how many people have downloaded the application and used it. Account creations and referrals provide more evidence of customer engagement. |
|
Tool usage reflects the level of standardization and reuse in the enterprise tool chain. |
Tooling effect is the cycle time from check-in to release in production for a new line of code. |
|
Number of trained people counts those who have been through Kanban training and successfully obtained certification. |
Higher throughput measures that high-value work gets completed faster leading to increased customer satisfaction. |
|
Table 5-1. Examples of vanity versus actionable metrics |
|
In How to Measure Anything, Douglas Hubbard recommends a good technique for deciding on a given measure: “If you can define the outcome you really want, give examples of it, and identify how those consequences are observable, then you can design measurements that will measure the outcomes that matter. The problem is that, if anything, managers were simply measuring what seemed simplest to measure (i.e., just what they currently knew how to measure), not what mattered most.”95
By combining the principle of actionable metrics with Hubbard’s recommendation for how to create the measures that matter most, we can go beyond traditional internal efficiency and financial measurement to focus on value from the perspective of the stakeholders that matter most—our customers.
Dan McClure’s “pirate metrics”96 are an elegant way to model any service-oriented business, as shown in Table 5-2 (we have followed Ash Maurya in putting revenue before referral). Note that in order to use pirate metrics effectively, we must always measure them by cohort. A cohort is a group of people who share a common characteristic—typically, the date they first used your service. Thus when displaying funnel metrics like McClure’s, we filter out results that aren’t part of the cohort we care about.
|
Name |
Purpose |
|
Acquisition |
Number of people who visit your service |
|
Activation |
Number of people who have a good initial experience |
|
Retention |
Number of people who come back for more |
|
Revenue |
Number of people from the cohort who engage in revenue-creating activity |
|
Referral |
Number of people from the cohort who refer other users |
|
Table 5-2. Pirate metrics: AARRR! |
|
Measuring pirate metrics for each cohort allows you to measure the effect of changes to your product or business model, if you are pivoting. Activation and retention are the metrics you care about for your problem/solution fit. Revenue, retention, and referral are examples of love metrics—the kind of thing you care about for evaluating a product/market fit.97 In Table 5-3 we reproduce the effect on pirate metrics of both incremental change and pivoting for Votizen’s product.98 Note that the order and meaning of the metrics are subtly different from Table 5-2. It’s important to choose metrics suitable for your product (particularly if it’s not a service). Stick to actionable ones!
|
Metric |
Interpretation |
v.1 |
v.1.1 |
v.2 |
v.3 |
v.4 |
|
Acquisition |
Created account |
5% |
17% |
42% |
43% |
51% |
|
Activation |
Certified authenticity |
17% |
90% |
83% |
85% |
92% |
|
Referrals |
Forwarded to friends |
— |
4% |
54% |
52% |
64% |
|
Retention |
Used system at least thrice |
— |
5% |
21% |
24% |
28% |
|
Revenue |
Supported causes |
— |
— |
1% |
0% |
11% |
|
Table 5-3. Effect of incremental change and pivots on Votizen’s pirate metrics |
||||||
In order to determine a product/market fit, we will also need to gather other business metrics, such as those shown in Table 5-4. As always, it’s important not to aim for unnecessary precision when gathering these metrics. Many of these growth metrics should be measured on a per-cohort basis, even if it’s just by week.
|
Measure |
Purpose |
Example calculation |
|
Customer acquisition cost |
How much does it cost to acquire a new customer or user? |
Total sales and marketing expenses divided by number of customers or users acquired |
|
Viral coefficient (K) |
A quantitative measure of the virality of a product |
Average number of invitations each user sends multiplied by conversion rate of each invitation |
|
Customer lifetime value (CLV) |
Predicts the total net profit we will receive from a customer |
The present value of the future cash flows attributed to the customer during his/her entire relationship with the company99 |
|
Monthly burn rate |
The amount of money required to run the team, a runway for how long we can operate |
Total cost of personnel and resources consumed |
|
Table 5-4. Horizon 3 growth metrics |
||
Which metrics we care about at any given time will depend on the nature of our business model and which assumptions we are trying to validate. We can combine the metrics we care about into a scorecard, as shown in Figure 5-2.100
Customer success metrics provide insight into whether customers believe our product to be valuable. Business metrics, on the other hand, focus on the success of our own business model. As we noted before, collecting data is never an issue for new initiatives; the difficulties lie in getting actionable ones, achieving the right level of precision, and not getting lost in all the noise.
To help us improve, our dashboard should only show metrics that will trigger a change in behavior, are customer focused, and present targets for improvement. If we are not inspired to take action based on the information on our dashboard, we are measuring the wrong thing, or have not drilled down enough to the appropriate level of actionable data.
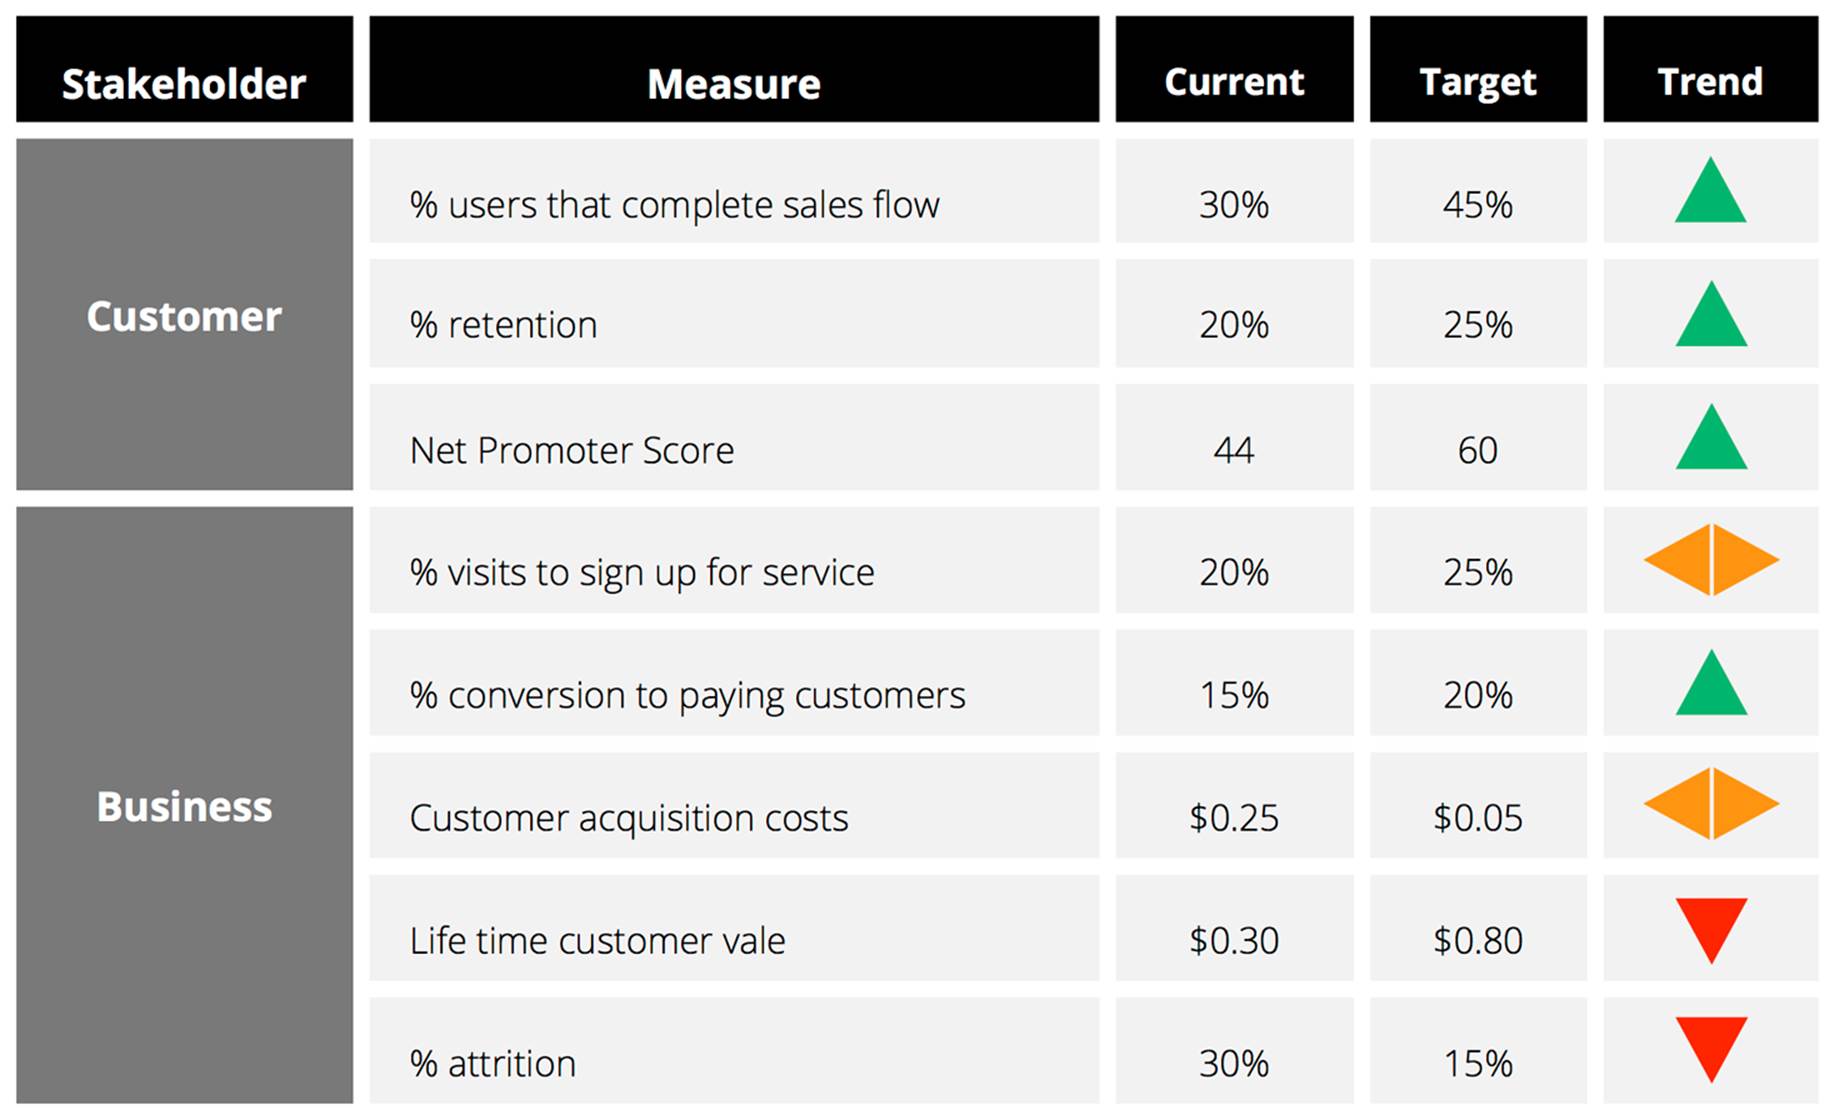
Figure 5-2. Example innovation scorecard
In terms of governance, the most important thing to do is have a regular weekly or fortnightly meeting which includes the product and engineering leads within the team, along with some key stakeholders from outside the team (such as a leader in charge of the Horizon 3 portfolio and its senior product and engineering representatives). During the meeting we will assess the state of the chosen metrics, and perhaps update on which metrics we choose to focus on (including the One Metric That Matters). The goal of the meeting is to decide whether the team should persevere or pivot, and ultimately to decide if the team has discovered a product/market fit—or, indeed, if it should stop and focus on something more valuable. Stakeholders outside the team need to ask tough questions in order to keep the team honest about its progress.
ENERGIZING INTERNAL ADVOCATES IN THE ENTERPRISE
Innovation in large, bureaucratic organizations is challenging because they are inherently designed to support stability, compliance, and precedence over risk taking. Leaders that have risen to the top could do it because they have worked the system as it has existed to date. Therefore, we need to be careful that any critiques do not become focused on individuals or their behavior within the system. We need to seek out collaborators and co-creators across the organization without causing alienation, to gain further support for our efforts, and to cross the chasm to the next stage of the adoption curve within the organization. Ultimately, we will need to identify change agents in the areas where we need change to be successful. The best ammunition here is demonstrable evidencethat our efforts are achieving measurable business outcomes.
Without doubt there are people in our organization who are frustrated and curious for change. However, they seek safety, context, and cover to act before they are willing to become champions of an initiative. Energizing and engaging these people is key. As they become early adopters of our ideas and initiatives, they will provide a feedback loop enabling us to iterate and improve our product. They are also our sponsors within the wider organization. In bureaucratic environments, people tend to protect their personal brand and not back the losing horse. Our goal is to give them the confidence, resources, and evidence that encourages them to be advocates for our initiative throughout the organization.
Do Things That Don’t Scale
Even when we have validated the most risky assumptions of our business model, it is important that we continue to focus on the same principles of simplicity and experimentation. We must continue to optimize for learning and not fall into simply delivering features. The temptation, once we achieve traction, is to seek to automate, implement, and scale everything identified as “requirements” to grow our solution. However, this should not be our focus.
In the early stages, we must spend less time worrying about growth and focus on significant customer interaction. We may go so as far as to only acquire customers individually—too many customers too early can lead to a lack of focus and slow us down. We need to focus on finding passionate early adopters to continue to experiment and learn with. Then, we seek to engage similar customer segments to eventually “cross the chasm” to wider customer acquisition and adoption.
This is counterintuitive to the majority of initiatives in organizations. We are programmed to aim for explosive growth, and doing things that don’t scale doesn’t fit with what we have been trained to do. Also, we tend to measure our required level of service, expenses, and success in relation to the revenue, size, and scope of more mature products in our environment or competitive domain.
We must remember that we are still in the formative stage of our discovery process, and don’t want to overinvest and commit to a solution too early. We continually test and validate the assumptions from our business model through market experiments at every step. If we have identified one key customer with a problem and can act on that need, we have a viable opportunity to build something many people want. We don’t need to engage every department, customer segment, or market to start. We just need a focused customer to co-create with.
Once leaders see evidence of rampant growth with us operating with unscalable processes, we’ll easily be able to secure people, funding, and support to build robust solutions to handle the flow of demand. Our goal should to be to create a pull system for customers that want our product, service, or tools, not push a mandated, planned, and baked solution upon people that we must “sell” or require them to use.
Customer Intimacy
By deliberately narrowing our market to prioritize quality of engagement and feedback from customers, we can build intimacy, relationships, and loyalty with our early adopters. People like to feel part of something unique and special.
DEVELOPING EMPATHY WITH CUSTOMERS: SOMETIMES THE ANSWER IS INSIDE THE BUILDING
The Royal Pharmaceutical Society knew that their clinical drug database was the best in the world. They also knew that there must be many more uses for it than just a stack of printed books. But where should they start? Instead of guessing, or building an expensive platform for products, or trying to sign a deal without a product, they used their other major asset: a building full of pharmacists. Through rapid prototyping, user testing with pharmacists working for the society, and product research with nearby pharmacies, they were quickly able to focus on an app to check for potential interactions between prescribed drugs. There are huge opportunities in licensing the data for international use. By starting with an app that they themselves would use, they were able to understand what international customers might want and to build a great marketing tool.
By keeping our initial customer base small—not chasing vanity numbers to get too big too fast—we force ourselves to keep it simple and maintain close contact with our customers every step of the way. This allows teams more time with customers to listen, build trust, and ensure early adopters that we’re ready to help. Remember, reaching big numbers is not a big win; meeting unmet needs and delighting customers is.
Build a Runway of Questions, Not Requirements
The instinct of product teams, once a problem or solution validation is achieved, is to start building all the requirements for a scalable, fully functioning, and complete solution based on the gaps in their MVPs. The danger with this approach is that it prevents us from evolving the product based on feedback from customers.
In the early stage we are still learning, not earning. Therefore it is important that we do not limit our options by committing time, people, and investment to building features that may not produce the desired customer outcomes. We must accept that everything is an assumption to be tested, continually seek to identify our area of most uncertainty, and formulate experiments to learn more. To hedge our bets with this approach, leverage things that don’t scale—build a runway with scenarios for how we may continue to build out our product.
Our runway should be a list of hypotheses to test, not a list of requirements to build. When we reward our teams for their ability to deliver requirements, it’s easy to rapidly bloat our products with unnecessary features—leading to increased complexity, higher maintenance costs, and limited ability to change. Features delivered are not a measure of success, business outcomes are. Our runway is a series of questions that we need to test to reduce uncertainty and improve our understanding of growth opportunities.
CREATE A STORY MAP TO TELL THE NARRATIVE OF THE RUNWAY OF OUR VISION
Story maps are tool developed by Jeff Patton, explained in his book, User Story Mapping. As Patton states, “Your software has a backbone and a skeleton—and your map shows it.”
Story maps help with planning and prioritizing by visualizing the solution as a whole (see Figure 5-3). Story mapping is not designed to generate stories or create a release plan—it is about understanding customers’ objectives and jobs-to-be-done. Story maps provide an effective means to communicate the narrative of our solution to engage the team and wider stakeholders and get their feedback. By going through story maps and telling the story of the solution, we ensure that we have not missed any major components. At the same time, we maximize learning by identifying the next riskiest hypothesis to test while minimizing waste and overengineered solutions that do not fit customer needs as defined in our MVP.
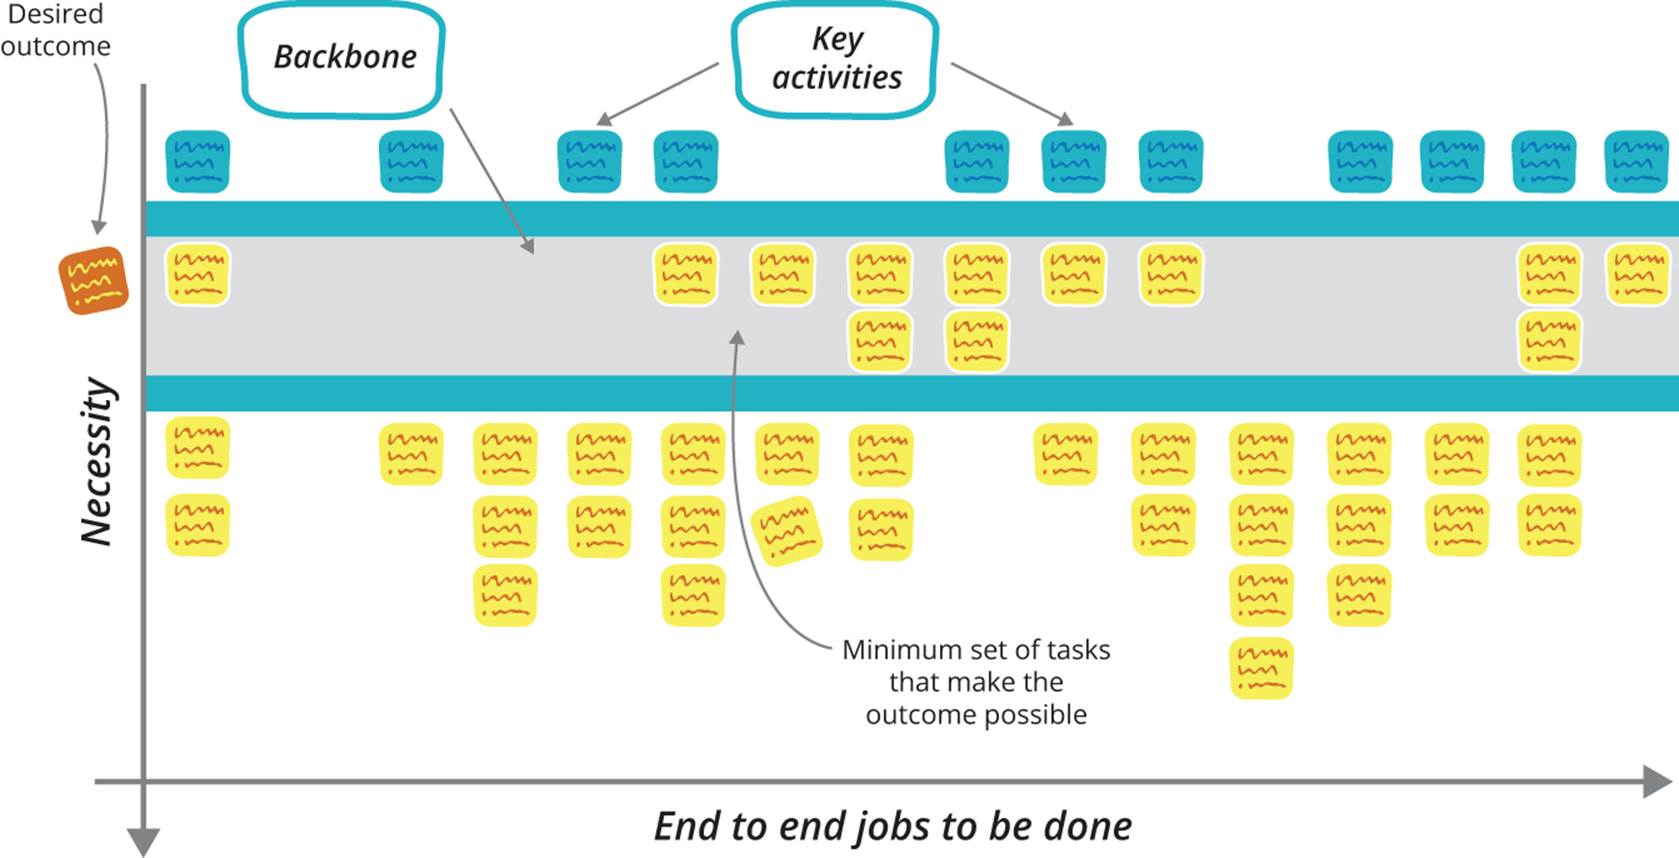
Figure 5-3. A user story map
When we start to harden, integrate, and automate our product, it impacts our ability to rapidly adapt to what we are discovering, often limiting our responsiveness and ability to change. Within Horizon 3, we must continuously work to avoid product bloat by leveraging existing services, capabilities, or manual processes to deliver value to users. Our aim is not to remove ourselves from users. We want to ensure that we are constantly interacting. If we optimize only for building without constantly testing our assumptions with our customers, we can miss key pain points, experiences, and successes—and that is often where the real insights are.
If we want to learn, we must have empathy for our users and experience their pain. When we find a customer with a problem that we can solve manually, we do so for as long as possible. When our customers’ quality of service is compromised or we cannot handle the level of demand, we consider introducing features to address the bottlenecks that have emerged through increased use of the product.
LEVERAGE FRUGAL INNOVATION
Unscalable techniques and practices are not only a necessity—they can be a catalyst for change in an organization’s culture. Proving it is possible to test our ideas quickly, cheaply, and safely gives others in the organization encouragement and confidence that experimentation is possible, the result being a lasting change for the better in our culture.
Engineering Practices for Exploring
In general, we favor the principles of The Toyota Production System by “building quality into” software, discussed at length in Chapter 8. However, when exploring, there is a tension between the need to experiment by building MVPs, and building at high levels of quality through practices such as test automation.
When we start working on validating a new product idea or a new feature in an existing product, we want to try out as many ideas as fast as possible. Ideally we will do this without writing any software at all. But for the software we do write, we don’t want to spend a ton of time building acceptance tests and refactoring our code. We will (as Martin Fowler puts it) deliberately and prudently accumulate technical debt in order to run experiments and get validation.101
However, if our product is successful, we will hit a brick wall with this approach. Perhaps a year or two in (depending on our pain threshold), changes will become onerous and time consuming and the product will become infested with defects and suffer from poor performance. We may even get to the stage where we consider a Big Rewrite.
Our advice is this. There are two practices that should be adhered to from the beginning that will allow us to pay down technical debt later on: continuous integration and a small number of basic unit and user-journey tests. The moment a product (if we are in Horizon 3) or feature (in Horizon 2) goes from being an experiment to validated, we need to start aggressively paying down technical debt. Typically that means adding more user-journey tests, employing good architectural practices such as modularization, and making sure all new code written on the feature uses test-driven development (good engineers will already use TDD).
Having forced ourselves to do something that should be unnatural to engineers—hack out embarrassingly crappy code and get out of the building to get validation from early on—we must then pull the lever hard in the other direction, kill the momentum, and transition our focus from building the right thing to building the thing right. Needless to say, this requires extreme discipline.
Choosing at what point in the lifecycle of our product or feature to pay down our technical debt is an art. If you find (as many do) that you’ve gone too far down the path of accumulating technical debt, consider the alternatives to the Big Rewrite described in Chapter 10.
Engines of Growth
In The Lean Startup, Eric Ries argues that there are three key strategies for growth—choose one:
Viral
Includes any product that causes new customers to sign up as a necessary side effect of existing customers’ normal usage: Facebook, MySpace, AIM/ICQ, Hotmail, Paypal. Key metrics are acquisition and referral, combined into the now-famous viral coefficient.
Pay
Is when we use a fraction of the lifetime value of each customer and flow that back into paid acquisition through search engine marketing, banner ads, public relations, affiliates, etc. The spread between your customer lifetime value and blended customer acquisition cost determines either your profitability or your rate of growth, and a high valuation depends on balancing these two factors. Retention is the key goal in this model. Examples are Amazon and Netflix.
Sticky
Means something causes customers to become addicted to the product, and no matter how we acquire a new customer, we tend to keep them. The metric for sticky is the “churn rate”—the fraction of customers in any period who fail to remain engaged with our product or service. This can lead to exponential growth. For eBay, stickiness is the result of the incredible network effects of their business.
For enterprises, however, there are further growth options to consider:
Expand
Is building an adaptive initial business model that we could simply evolve and expand further by opening up new geographies, categories, and adjacencies. Amazon has executed this strategy excellently, moving from selling books to an e-commerce store offering new retail categories. With this growth strategy, the initial targeted market should be large enough to support multiple phases of growth over time.
Platform
Once we have a successful core product, we transform it into a platform around which an “ecosystem” of complementary products and services is developed by both internal and external providers. Microsoft did this with Windows by creating MS Office, Money, and other support packages, including those developed by external vendors. Other platform examples include Apple’s AppStore, Salesforce’s Force.com, and Amazon’s Marketplace and Web Services offerings.
Great products, tools, and practices, both internal and external, have always spread by word of mouth due to their truly compelling value proposition and a brand that customers are proud to advocate. If our growth is derived from our customers, then it will happen without us having to invest. If not, we will be limited by the effort required to manually discover, convert, and service our customers.
Ultimately, our product is the key driver of growth. If we build a truly compelling solution that addresses a customer need and that they really love, they will use it. More impressively, they will become advocates and encourage others to use it—creating the best sales team we could wish to hope for to enable success.
Transitioning Between Horizons to Grow and Transform
In Chapter 2, we mentioned that organizations must manage all three horizons concurrently. The ability to recognize, transition, and convert initiatives through these cycles, as shown in Figure 5-4, holds the key for the future success, relevance, and longevity of the organization.
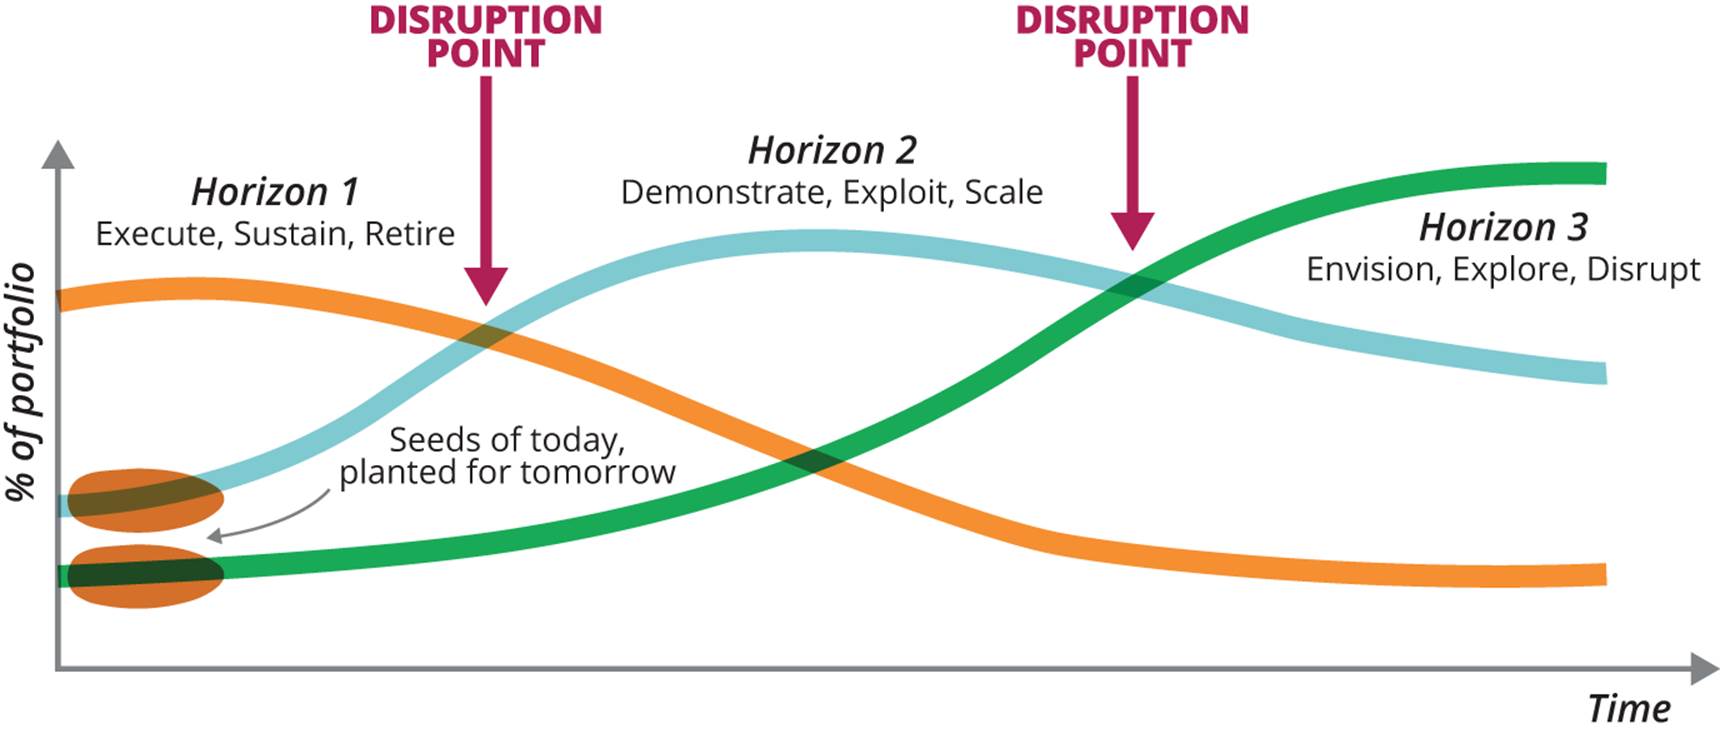
Figure 5-4. Percentage of product portfolio for the three innovation horizons over time
As we describe in Chapter 3, it is Horizons 2 and 3 that need the most leadership support. These horizons contain much more uncertainty and lower revenue, so they can be easily crushed if not managed independently of Horizon 1. We must be aware of the pitfalls at each stage, including transitioning at a wrong time and selecting a wrong strategy for each horizon.
LEAN DEVELOPMENT AND LEAN OPERATIONS, BY STEVE BELL
Lean thinking is usually associated with operations, as it originated with the Toyota Production System (TPS) and has been widely adopted in manufacturing settings.102 But Toyota’s long-term success is equally due to their application of lean principles to quickly and efficiently develop desirable new products of high quality and a reasonable cost. Toyota has demonstrated that an enterprise that adopts lean thinking seamlessly across development and operations can gain a lasting competitive advantage.
Lean development and operations are interrelated and complementary, but very different in nature. Lean operations emphasizes standardization and reduction of waste, uncertainty, and variation in order to create efficient processes that produce consistent, quality products. In contrast, lean development utilizes uncertainty and variation early in the design process to learn from experiments, especially from failures—which is the most effective way to solve problems and drive innovation.
Yet here is the paradox: lean development, which requires variation and uncertainty, relies on standardized work methods to formulate hypothesis for innovation and run consistent and repeatable experiments that minimize waste and time, while maximizing creativity and value.
For example, lean development rigorously and continuously engages the Voice of the Customer at the gemba (the place, both physical and virtual, where the work is done) utilizing iterative, often set-based design to accelerate learning and quickly create a product with a valid value hypothesis. Other standardized lean practices like A3 problem solving, visual management, and value stream mapping are useful in a development setting, improving speed to market while reducing R&D cost and enterprise risk.
Once there is a viable new product or service, the enterprise may utilize its lean operations capabilities to quickly and efficiently bring it to market, validating the growth hypothesis. This is where many lean startups either lose the market to fast followers or are acquired by larger enterprises with lean operations capability to rapidly reach the market, exploit early profits, and achieve brand domination. While acquiring startups as a source of innovation is certainly a viable strategy for larger enterprises, most would also like to enhance their internal innovation capability as well.
Lean development thus creates innovative products and services that flow through lean operations and into the hands of the customer as a continuous value stream, in the same spirit as continuous delivery (DevOps) does in a software context. When an enterprise is able to integrate and exploit this rapid flow of ideas to value, profits from mature products can fund continuous innovation, creating a virtuous cycle illustrated in Figure 5-5.
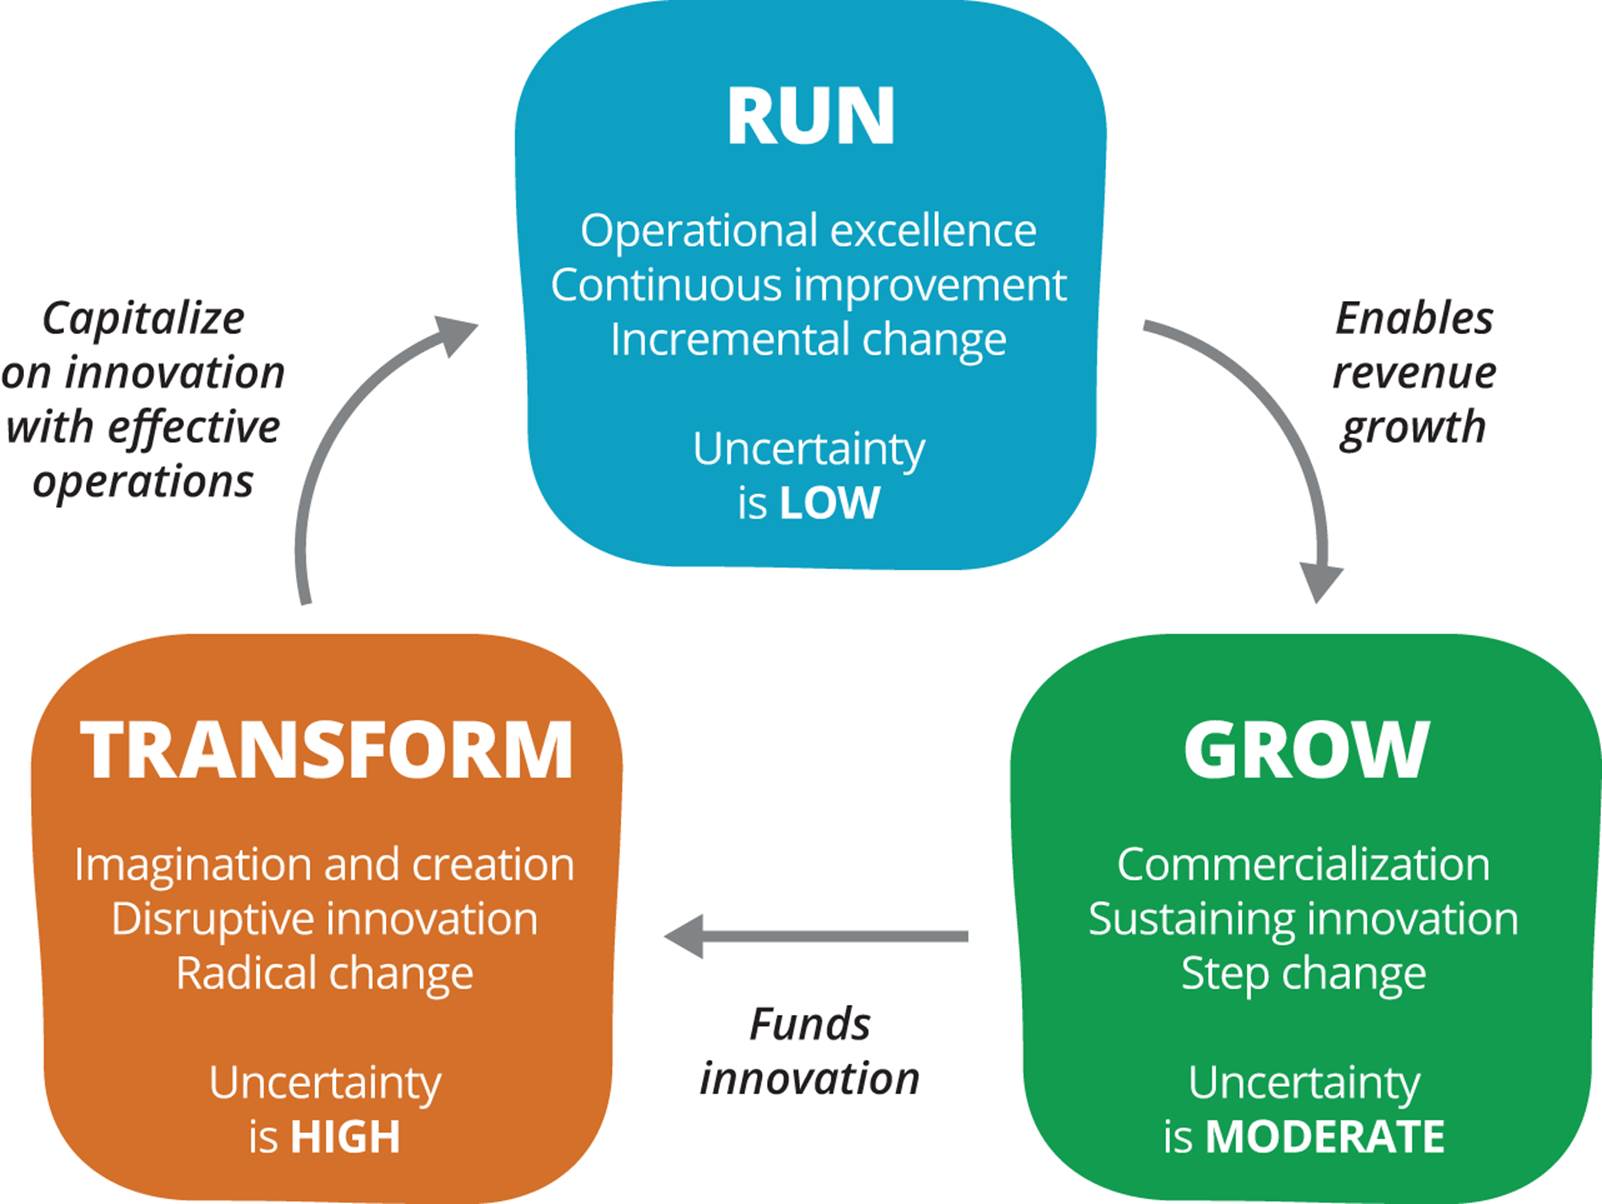
Figure 5-5. The virtuous cycle of innovation, by Steve Bell
When attempting to cross Horizon 3, indicators of customer satisfaction and continued engagement are important signals to monitor for future growth. Once we have found customers, learned how to address their needs, and are confident of meeting their demand, we should seek to expand the customer market by geography, channel, or offerings.
While exploring, we are testing a fit between product and market, typically through bespoke solutions for our initial customers. Exploiting is about finding an offering and business model that appeals to a broader customer set.
The five critical enablers of growth when transitioning from explore to exploit are:
Market
It is imperative to select the right market. Ideally, there are plenty of potential customers that will support our growth aspirations; we must identify the elements that made us successful with our early adopters, and then seek to find similar but larger groups to engage with. The insights we have learned by working with our early adopters are key to informing this decision. Early adopters are also likely to spread their experiences with our product by word of mouth, eventually driving the product to “cross the chasm” to wider adoption.
Monetization model
We must decide what is the best way to capture the value created by our offering, as it essentially defines what will drive revenue for our business model. It is also difficult to change later.
Customer adoption
How will we get customers on board with the product? We must be careful not to make major product or pricing concessions to any individual group to win over a large account. We must remain true to our product vision and manage the tension and demands of any single customer group that could limit further growth.
Forget “big bang” launches
Play it safe: continue to test and validate the product, contain the fire, work with smaller samples of customers. Build momentum through alpha and beta product launches with targeted customer segments. As we gain more confidence, understanding, and success, we broaden our customer base. Ideally, we want customers to come to us with problems to solve so we don’t have to push new products on them.
Team engagement
We must do all we can to keep the team together to protect culture, learning speed, and acquired knowledge. We do not want to build a wall between innovation and operation teams. Collaboration, directed towards organization learning and development, is key to making an innovation culture stick as we start to scale and hire new team members.
When considering process improvements and tool selection, similar principles apply to identifying target users, evaluation and capture of benefit, user adoption, avoiding “big bang” rollouts, and team engagement.
INNOVATION TAKES TIME: FROM AUCTION TO MARKETPLACE
Amazon auctions (later known as zShops) were launched in March 1999 in response to the success of eBay. The site was promoted heavily from the home, category, and individual product pages. Despite the promotion, one year after launch it had only achieved a 3.2% share of the online auction market compared to 58% for eBay, and subsequently declined.
In November 2000, zShops was renamed to “Amazon Marketplace,” offering competitive prices on products available through third-party sellers alongside the standard product listings. The strategy, initially driven by the need to compete with eBay, was adjusted to align to Amazon’s strategic focus on low pricing.
Extending the model further, Amazon introduced selling used products through the seller marketplace, providing another revenue stream without any impact to its supply chain. Advertising, packing, and shipping are handled exclusively by sellers, with Amazon taking a cut of the transaction for providing the sales channel with minimal cost.
In 2012, Amazon’s Marketplace service produced 12% of revenues103 with total unit sales increasing 32% from the previous year.104
By reconsidering how we define and measure validated learning, we can start to test and communicate if and when our initiatives are getting traction. By continually experimenting with our customers and moving our One Metric That Matters as cheaply and quickly as possible, we can limit our investment, reduce associated risks, and maximize learning. An evidence-based approach to product development provides safety, context, and cover to act for stakeholders—and is a catalyst for change in the larger organization.
Conclusion
Innovation accounting provides a framework to measure progress in the context of Horizon 3—that is, under conditions of extreme uncertainty. It is designed to gather leading indicators of the future growth of the idea, so that we can eliminate those that will not succeed in Horizon 2.
We have identified the three key areas to consider during this stage. First, we must find customers to act as co-creators of value. We use their feedback to experiment and refine our value proposition before aiming for a wider market. Second, we focus on learning rather than revenue by taking a narrow customer focus and validating each assumption our solution makes. We do not need to build requirements; we need to answer questions about the desired functionality of our product. Finally, we focus on user engagement over quick financial gain—with more satisfied users there will come revenue (or whatever value we hope to create for our organization). As we improve our understanding of our users and the product opportunity, we can decide on a monetization model to ensure the ongoing success for the product.
Most ideas will not achieve a product/market fit. For those that do, a metamorphosis is required. The behaviors and management principles required to succeed in Horizon 2 are fundamentally different from those that govern Horizon 3. Part III presents how to grow an organization focused on building the product right, now that we have confidence that we are building the right product.
Questions for readers:
§ What customer and business metrics would be on your innovation scorecard?
§ Who are the key stakeholders, and what is their influence for each stage of the adoption curve for your product? How do you plan to engage them and create alignment?
§ What experiments do you plan to run to test and validate your business model hypothesis with customers? How will you visualize and prioritize them?
§ How can you gather data to test with your identified market as cheaply and quickly as possible?
§ What are your criteria for moving a product from Horizon 3 to Horizon 2?
90 “The Balanced Scorecard—Measures That Drive Performance,” p. 70, http://bit.ly/1vt3X2Q
91 [croll], p. 13.
92 Ash Maurya, http://bit.ly/1v6ZG4L
93 Dan McClure, http://bit.ly/1vt4925
94 Ronny Kohavi, http://bit.ly/1v6ZHpn
95 [hubbard], p. 37.
96 Pirate Metrics, http://slidesha.re/1v6ZL8B
97 Ash Maurya has a good blog post on pirate metrics, cohorts, and problem/solution fits: http://bit.ly/1v6ZG4L.
98 By David Binetti, http://slidesha.re/1v6ZQZZ
99 The standard definition of CLV and many other sales and marketing metrics are given in [farris].
100 Thanks to Aaron Severs, founder of hirefrederick.com, for inspiration and permission to use this diagram.
101 http://martinfowler.com/bliki/TechnicalDebtQuadrant.html
102 Although Lean originated in manufacturing, it has evolved into most sectors, including healthcare, financial services, transportation, construction, education, and the public sector.
103 http://bit.ly/1v700QY
104 http://bit.ly/1v701og