UX Strategy: How to Devise Innovative Digital Products That People Want (2015)
Chapter 5. Conducting Competitive Analysis
“[Analysis is] the skilled application of scientific and non-scientific methods and processes by which individuals interpret data or information to produce insightful intelligence findings and actionable recommendations for decision makers.”[34]
— BABETTE BENSOUSSAN AND CRAIG FLEISHER, BUSINESS AND COMPETITIVE ANALYSIS
THE DEVIL IS IN THE DETAILS THAT YOU HAVE JUST COLLECTED BY doing a thorough investigation of the marketplace. In this chapter, I’m going to cover the basics for tackling the analysis section of the Competitive Analysis Matrix. By the end of the chapter, you’ll know several useful techniques that will help you to easily convert the mounds of raw data in your grid into actionable learnings. My goal is to prepare you to take a stance on the viability of your product and to make recommendations about how to move forward — in other words, Tenet 1, Business Strategy (Figure 5-1).

Figure 5-1. Tenet 1: Business Strategy
The Blockbuster Value Proposition, Part 2
Let’s return to the unfolding drama we left in Chapter 3, in which our UX strategist, Jaime, talks to Paul, a big-time movie producer, on a Hollywood backlot about his idea for a shopping site for the wealthy Busy Man. He’s just revealed how his value proposition also solves his personal problem.
INT. BUNGALOW – MORNING
The shot frames JAIME and PAUL. Paul is cocksure.
JAIME is inquisitive.
JAIME
Do you know if there are any competitors
already in the space? Is anyone already
doing this?
PAUL throws up his hands. He's super amped about
his idea.
PAUL
My wife and I have looked around, but we
haven't found anything that really nails it.
DISSOLVE TO:
INT. BUNGALOW — MORNING
It's two weeks later, and Jaime is back in the
bungalow. Paul is staring at hard copies of the
Competitive Analysis Finding's brief. He seems
baffled and annoyed.
JAIME
As you can see from my research and analy-
sis, there are actually several competitors
with significant funding already delivering
your product idea in the marketplace.
PAUL
I have never heard of these companies. So
you think it's risky to try to directly com-
pete against them?
JAIME
Well actually, I think we should consider
doing more research about the customer you
want to target. And explore how they cur-
rently solve their problem.
PAUL
I already know there are lots of guys like
me who hate shopping.
JAIME
How about we interview them and run some
experiments to test variations on your value
proposition?
PAUL
I feel like we can just start building out a
website and see how things go.
JAIME
Why don't you take a closer look at all the
sites from the market research and see how
they work. Or have your wife look at them?
I also made some other recommendations on
other ways to attack the problem with an
ecommerce business model.
PAUL
I still think my original idea has legs.
END SCENE.
Paul obviously wasn’t happy with the market analysis, but guess who was? His wife! She sensed that this idea could be a money pit and was glad to have a strong second opinion to back up her instincts. In the end, Paul the movie producer dumped this idea and went back to making movies. I never heard from him again.
LESSONS LEARNED
§ You must question your stakeholders and clients about their understanding of the competition and ensure that whatever statements they make are thoroughly backed by empirical research.
§ The analysis should also recommend alternatives, especially if the initial product vision and business model have risks. After all, you do want to help clients convert their dreams into an executable strategy.
§ Sometimes, people have fixed ideas, and no amount of research will change their minds. That’s when the strategist has to ask a personal and ethical question of herself: will I help this person make the product regardless of the research, or do I walk away?
What Is an Analysis?
When analyzing things, you are essentially trying to convert a lot of information into smaller actionable bites. You are trying to find relationships among different inputs to make inferences about why certain things are happening. By breaking larger problems into smaller problems, you and your team can more easily tackle big-picture outcomes.
Converting information into meaningful intelligence is actually one step in a larger process called competitive intelligence (see Figure 5-2). Business author Jim Underwood writes, “Competitive intelligence is the process of legally and ethically gathering, analyzing, and acting on information about an organization’s market environment, competition, and other forces that may impact its future success.”[35] What Underwood is saying is that the impartial research should lead to impartial decisions. And that’s one reason why clients hire consultants — to help them to avoid emotionally fueled judgments.
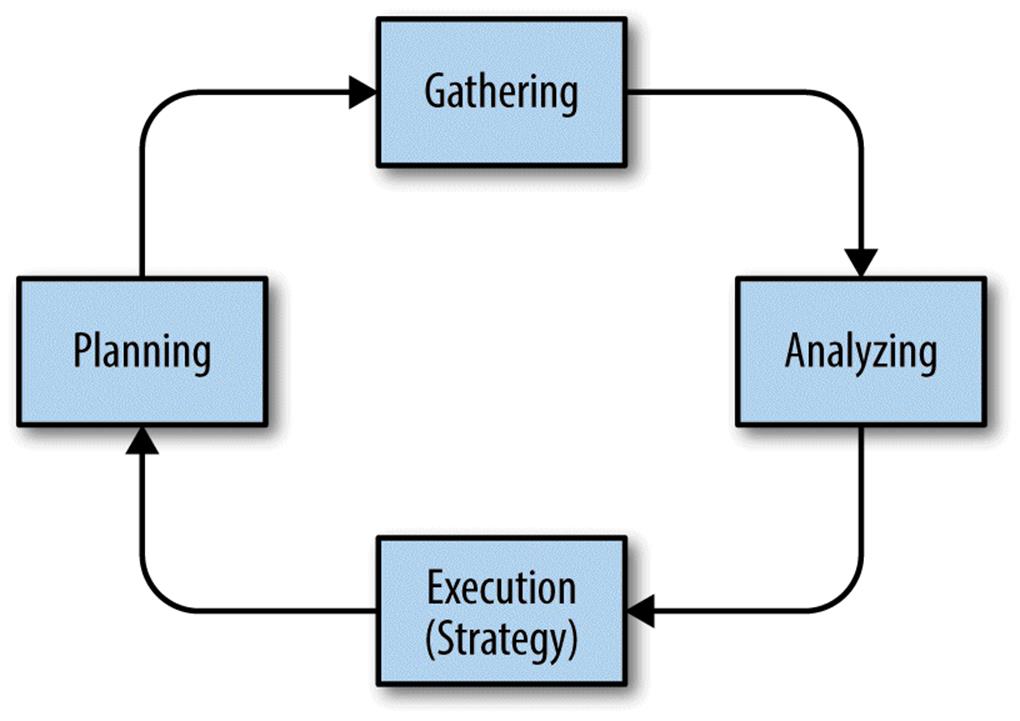
Figure 5-2. Gaining competitive intelligence is a four-step process
This analytical approach also ties into the Build-Measure-Learn loop from Lean Startup. It should continuously inform the strategic and tactical business decisions of your product. What’s true today might not be true tomorrow. If your team plans to build an innovative product, you must always keep gathering data, analyzing it, and acting on it to be successful. Your gathered intelligence should strive to remain competitive.
Because you’ve already looked closely at your digital competitors, you’re now ready to develop the intelligence about what’s working, why it is working, and what opportunities are available for your product in the evolving marketplace. After all, you don’t want to just launch a product that copies all your competitors’ features as is. You also don’t want your ultimate analysis to just be a side-by-side feature comparison of them. (For example, “This is how all the competitors use a Subscribe button.” Or, “All of our competitors have these features, so we should, too!”) My hero Steve Blank wrote a “Death by Competitive Analysis” rant[36] in which he argues that making a “my features versus their features” document will ultimately sink the ship. Simply offering as many features as you can overlooks the holistic UX and business model, and it doesn’t address what features the customers actually want or need to accomplish their primary goal. It’s your job to analyze everything and ultimately cherry-pick and recommend to the team the crucial features and opportunities that will create value innovation (Tenet 2). To make the competition irrelevant, you will have to offer something unique that radically improves on their current options, and you’ll figure this out by diving into the spreadsheet and analyzing the raw data.
The Four Steps to a Competitive Analysis and Market Opportunities
Just follow these four steps, which I will walk you through in detail:
1. Scan, skim, and color-code each column for highs and lows.
2. Creating logical groupings for comparison.
3. Analyze each competitor by benchmarking product attributes and best practices (this goes in the last column of the spreadsheet).
4. Writing the Competitive Analysis Findings Brief.
It’s that easy! We just need to be methodical in our process.
You’re going to use these steps to turn your market research into meaningful competitive intelligence. When you’re done with the entire labor-intensive process, you’ll use the major takeaways to create a Competitive Analysis Findings Brief with recommended action plans.
Step 1: Scan, skim, and color-code each column for highs and lows
The end goal of the spreadsheet analysis is to distill your learnings into a form, brief, or presentation that explains the rationale behind your recommendations. To do that, you need to do what is called systems thinking to organize information and processes. (See the interview with Milana Sobol in Chapter 10 for more on systems thinking.) So, let’s begin doing that by looking at the heap of raw data in your spreadsheet.
Scanning and skimming the data
After inputting all the data into the spreadsheet, it’s probably a good idea to reacquaint yourself with all rows (competitors) and columns (attributes) before analyzing them. To do that, I use two speed-reading techniques: skimming and scanning. Skimming means moving your eyes rapidly over text to get the basic meaning of it. Scanning is rapidly covering a lot of material while searching for a specific thing. I skim and scan a lot during a data analysis but not to be sloppy or to cut corners. Instead, I want to quickly discern how simple or complicated the task at hand is. Is my spreadsheet 5 rows by 5 columns or 12 rows by 24 columns with lots of missing data? Estimate the density and completeness of the content you are about to analyze so that you’ll know how long it will take. This matters because you probably have a fixed amount of time to do this task, and you don’t want to waste precious project hours going down a rabbit hole on just one row of analysis. For instance, if you have 20 competitors to analyze and 20 hours in which to complete this task, you have 1 hour to analyze each competitor. Time blocking for both research and analysis is essential because you want to have a balanced perspective — no blind spots.
Also notice if something looks incomplete or missing. Did you or whoever it was who did the research overlook an obvious competitor that really needs to be considered? Is the column with the monthly traffic or apps downloaded blank? That attribute could be quite important to know, and it’s a colossal distraction to have to stop an analysis to switch gears back into research mode.
Measuring raw data points
A data point is a discrete unit of information. Any single fact or observation is a data point. In our analysis, data points can help us illuminate whether something is a failure or success. There are two kinds of data points to keep an eye out for in our columns: quantitative data and qualitative data.
Quantitative data is numbers and statistics. How much traffic did a site get? How many transactions happened on the site? How many SKUs are on the site? Numbers can be metrics, transactions, and/or a finite set of options. Unlike qualitative data, these numbers have logic or order applied to them. For example, the quantitative data points of a Starbuck’s latte might be the size of the cup, the temperature of the coffee, the price, or the time it took the barista to make it.
Qualitative data is descriptive and subjective. It’s the stuff that makes up interesting content such as opinions, reactions, emotions, aesthetics, physical traits, and so on, but in most cases it’s not quantifiable. These data points can’t be easily measured or ordered. The qualitative aspects of a Starbucks latte are its taste, the aroma, how frothy the cream is, the aesthetics of the environment in which it is made, or the service.
|
Quantitative Data |
Qualitative Data |
|
Numbers (metrics, data sets) |
Descriptive |
|
Can be measured |
Can be observed, but not measured |
|
Length, area, volume, speed, time, and so on |
Opinions, reactions, tastes, appearance |
|
Objective |
Subjective |
|
Structured |
Unstructured |
Sometimes, the difference between quantitative and qualitative data isn’t obvious at first glance. So make sure that you’re careful. For example, on a dating site, you might think “men with brown eyes” is a qualitative attribute. It’s a color after all and could imply how people perceive the man’s attractiveness. However, what if the site makes male users choose an eye color when they sign up, and they only have five options to choose from — brown, blue, hazel, gray, and green. This is actually information that could be measured. The data point is objective; you have a number to quantify it.
Fun with color-coding
You can color-code the spreadsheet to keep track of meaningful data points, trends, and other patterns, as shown in Figure 5-3. For example, use yellow to highlight the most telling information (for instance, all competitors struggle with a feature). Use green to highlight positive attributes (highest monthly traffic). Just remember to keep it simple and use colors effectively. Creating a complex code in this initial pass won’t help your analysis, and it can confuse other team members who are also popping into check out or add to the raw data. The color code should be used sparingly to highlight things that are crucial to remember.
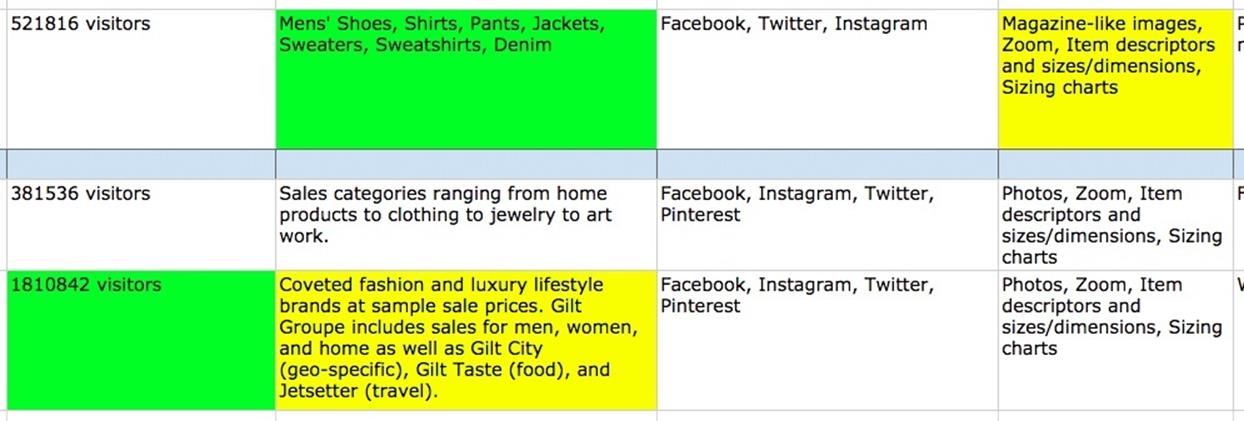
Figure 5-3. Highlighted cells showing color-coding of meaningful attributes
Step 2: Creating logical groupings for comparison
Now that you have an overall sense of your data, you need to do a little housekeeping to make the process of analysis very efficient. You want to compare the sites and apps in your analysis that have things in common. You want to compare apples to apples, oranges to oranges, and mobile apps for fresh produce delivery against mobile apps for fresh produce delivery. Thus, you need to manually sort and filter the competitors in the list into subgroups that you can compare practically.
Using logical groupings, you can place competitors that have common traits into “buckets.” You already have two of them: direct and indirect competitors. If you don’t have any groupings to make beyond those two, you might want to reorganize the rows at the very least. It doesn’t need to be very complicated. For example, you could do something as simple as rank your direct competitors from most threatening to least threatening to the value proposition.
Here are examples of potential subgroups:
|
Logical Subgroup Examples |
|
Desktop versus mobile platform |
|
Content type (for example, ecommerce, publishers, or aggregators) |
|
Horizontal markets (Craig’s List to Amazon to eBay or Target to Walmart) |
|
Vertical markets (clothing, health, banking, and so on) |
|
Business models |
Here are examples of different ways in which you can order the list of competitive products:
§ Highest traffic or most downloads (I always put the most popular competitors at the top)
§ Alphabetically
§ Newest to oldest in the market
§ Numerous features to minimal features
§ Largest to smallest in terms of SKUs, articles, or listings (this should be tied to traffic)
Remember your goal is to make it easier to identify which factors give other products their competitive advantage. You are looking for commonalities and differences so that you and your team can truly understand why certain products are more successful than others.
Step 3: Analyze each competitor by benchmarking product attributes and best practices
The term benchmark originates from the chiseled horizontal marks that surveyors made in stone structures to ensure that a leveling rod could be accurately repositioned in the same place in the future. These marks were usually indicated with a chiseled arrow below the horizontal line, as demonstrated in Figure 5-4.[37]

Figure 5-4. An Ordinance Survey cut mark in the United Kingdom. “BmEd” licensed under Creative Commons.
Benchmarking in the business world helps organizations identify and examine key facets of another identity so that comparisons can be made. This analysis leads to reducing costs, optimizing the sales funnel, and improving the product so that it delivers more value to the target customer. In this similar vein, when you analyze your data, you’re going to benchmark by comparing the entire collection of products (sites or apps) in the matrix to one another, and you’re going to do this on an attribute-by-attribute basis.
Each column on the spreadsheet represents a different attribute, and you’ve collected data points about each one, whether it’s downloads of an app or a specialized content category. These quantitative and qualitative data points give you the ability to measure, score, and identify best practices versus lame practices.
When you benchmark direct competitors, you want to find a competitive parity among their products. You’re looking for a baseline that defines the bottom-line criteria that future customers will expect when your team delivers on the value proposition. Do customers expect that a product detail page will have photos, videos, and reviews? Does the most popular site have the most merchandise and/or the widest selection? Does the company behind the most innovative and downloaded app have lots of funding?
When you benchmark the indirect competitors, you’re analyzing how these digital products offer alternative ways to solve a problem. For example, in the Busy Man’s Shopping Site competitive analysis, I benchmarked the monthly traffic of the indirect competitors. The website Gilt had monthly traffic of 1.8 million users, but Fab — a direct competitor of Gilt — only had 380,000 users. This data point really seemed important to me because it made me wonder: why was the disparity between their monthly traffic so huge? What was Gilt doing better?
You are looking for trends, patterns, gaps, and an overall sense of the look of the landscape. Often, you will notice common patterns being repeated across many sites within a vertical market. You might wonder why they’re all broken in the same way. You might realize that they are all overlooking an especially useful capability that could be the secret sauce you use in your value innovation. (See Chapter 6 for more.) Are most of the losers missing on content, traffic, stickiness, personalization, a bad browse or search experience? Determine the causes. By benchmarking the competition, you’ll find opportunities to create value by either innovating or optimizing on the best UX and business model practices of other competing products. You’ll also want to extract these golden nuggets as recommendations to put in your brief.
The analysis column of each competitor
The reason you waited until now to do the analysis column in the Competitive Analysis Matrix template is that you needed to collect as much data as possible about the entire competitive landscape of your value proposition. But now, you’re finally ready to fill it out.
At this point, you should see nuances among competitors. You’ve benchmarked attributes. You can gauge which competitors are a success or failure. You can say which competitor is number one, number two, and who’s doing something impressive even if they’re farther behind in the marketplace race than others. You have a sense of the diversity of business models in play.
Use your analysis to answer the following questions about each competitor in a brief paragraph:
§ How is it competing against your value proposition?
§ If it’s a direct competitor, what is it doing great or particularly badly?
§ If it’s an indirect competitor, is it competing with a similar solution or is it going after a similar customer segment?
§ What are the big takeaways the stakeholder should know if she only reads this cell?
You can see how I answered those questions in the Busy Man’s Shopping Site Competitive Analysis Matrix in Figure 5-5 and Figure 5-6. There’s an example for a direct and an indirect competitor.
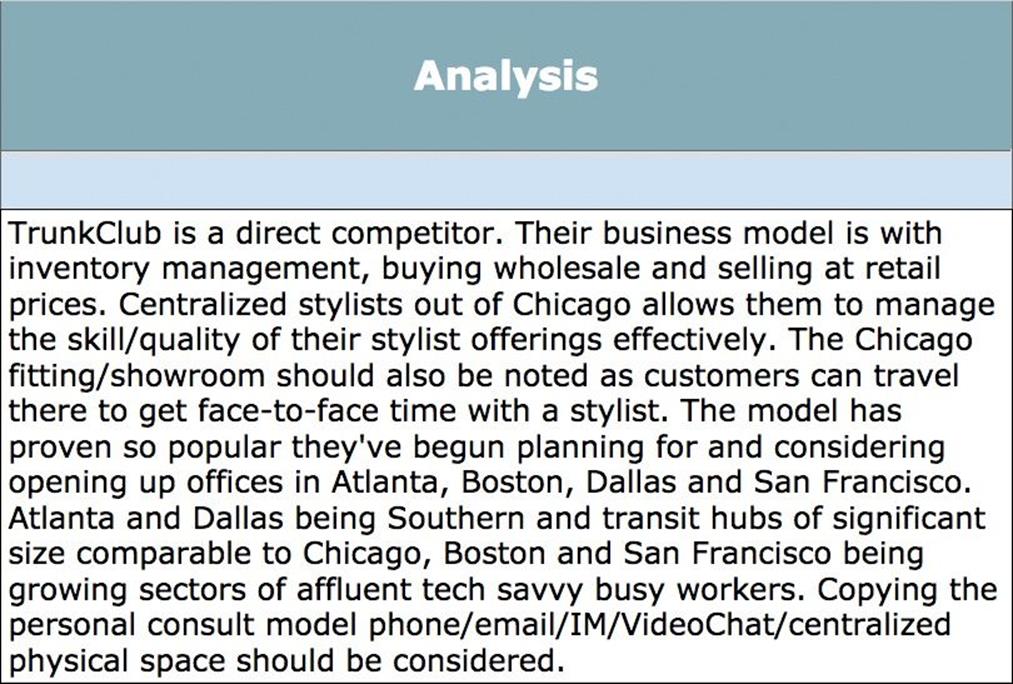
Figure 5-5. Direct competitor analysis sample
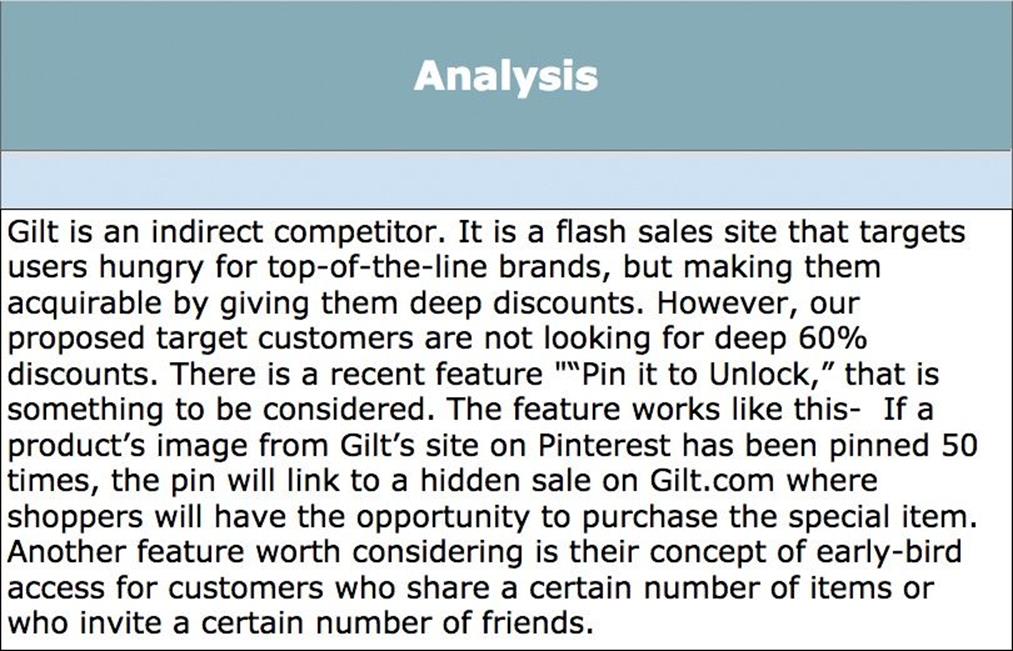
Figure 5-6. Indirect competitor analysis sample
Notice how the analysis cell imparts a picture of the competitor. This is really important because if your team and stakeholders have access to your raw data, you should assume that they might not necessarily look at all the other cells; they might only read this column. But that’s your job anyway. The analysis cell is where you’re going to sum up everything they should understand even if they never read the entire spreadsheet.
Step 4: Writing the Competitive Analysis Findings Brief
Abductive reasoning is a form of logical inference that goes from observation to a hypothesis. It accounts for the reliable data (observation) and seeks to explain relevant evidence.[38] It shapes your rationale for making recommendations, and making recommendations is the purpose of the Competitive Analysis Findings Brief. The findings brief is an easy-to-read summary of your competitive analysis along with your recommendations about how to move forward. This is your final judgment after doing your deep dive into the competitive landscape. It’s about articulating your final, unbiased view of the marketplace in as user-friendly a way as a face-to-face conversation. This document will be what your client takes away from your research.
Before you begin writing the findings brief, however, take a moment to step away from your spreadsheet. Zoom out from the details and think hard about the big picture. First, you should be able to answer the following questions about the marketplace:
§ Which competitors are closest to delivering a similar value proposition (that is, an online shopping site featuring high-end brands)? Are their products failing? Why? Or are their products succeeding so well that there’s no room for your product?
§ Which competitors directly appeal to your customer segment (wealthy men)?
§ Of those competitors, how do you think customers discover them (perhaps paid advertising)?
§ What products offer the best user experiences and business models? Who is doing something unique? What is working well for them? What do they have that your users like?
Second, you need to address in the brief if there’s room in the market for your product. What opportunities exist for it? What gaps could it fill? Perhaps your market research and analysis have shown you that your team has hit the entrepreneurial jackpot. Perhaps your product is one or all of the following:
§ First-to-market with something unique (such as Pinterest)
§ Offers users a better method to use or save time or finances (Amazon Prime saves customers from having to waste time running errands.)
§ Creates value simultaneously for two different customer segments (Airbnb does so for hosts and guests; Eventbrite for event planners and attendees.)
This is a blue ocean, which was discussed in Chapter 2. The thesis of the book Blue Ocean Strategy by W. Chan Kim and Renée Mauborgne[39] is of the uncontested marketplace in which the competition becomes irrelevant because there is none. A blue ocean is full of customers with unmet needs. A red ocean is a market full of sharks fighting for the fish. In writing your brief, you must be able to say with certainty whether your product is in a blue, red, or somewhere-in-between purple ocean (such as the lovely vista in Figure 5-7).

Figure 5-7. A purple ocean
If you have found a blue or at least purple ocean, you can suggest specific ways that a killer UX and/or business model could help knock a product idea out of the park. That’s when we, as UX strategists, can provide real value that could determine success or failure.
In short, your goal is to determine if there’s room to win, and that’s when you need to address the opportunities based on the research. Now, I’m not aware of any specific guideline for how to create a Findings Brief. But based on what I’ve seen and delivered over the years, I’ve noticed some primary components. I’m going to walk you through a sample Findings Brief so you can get a sense of what they are. (You can also learn what Geoff Katz puts in his Creative Briefs in Chapter 10.)
Findings Brief, Section 1: Introduction/Goals
The introduction presents the goals of the brief and tries to hook the stakeholder into, a) reading it, and b) reviewing it with an open mind. You might find that you need to rewrite this page several times to get it right. Don’t be too afraid to draft a quick summary of what you think this page should be, and then return to edit it after you’ve pulled the rest of your data together.
Here are some elements to include on this page (see also Figure 5-8):
State your purpose.
[Your team] conducted a competitive analysis on [market or markets] to see what other products do [client’s value prop]. Be sure to state the client’s value proposition clearly so that there is no confusion as to what you were focusing on. Include the month and year in which the study was conducted, because the analysis is truly a snapshot in time that will become outdated as the competitive landscape evolves.
Make a general statement about the current marketplace.
You could say something like, “There are tons of sites that allow trading.” Or, “The market is splintered into these core groups....” You might also include an introduction to the distinct competitor subgroups from your deep dive into the spreadsheet or overview of the business models at play. At the very least, list all the competitors you looked at, broken out by direct competitor and indirect competitor.
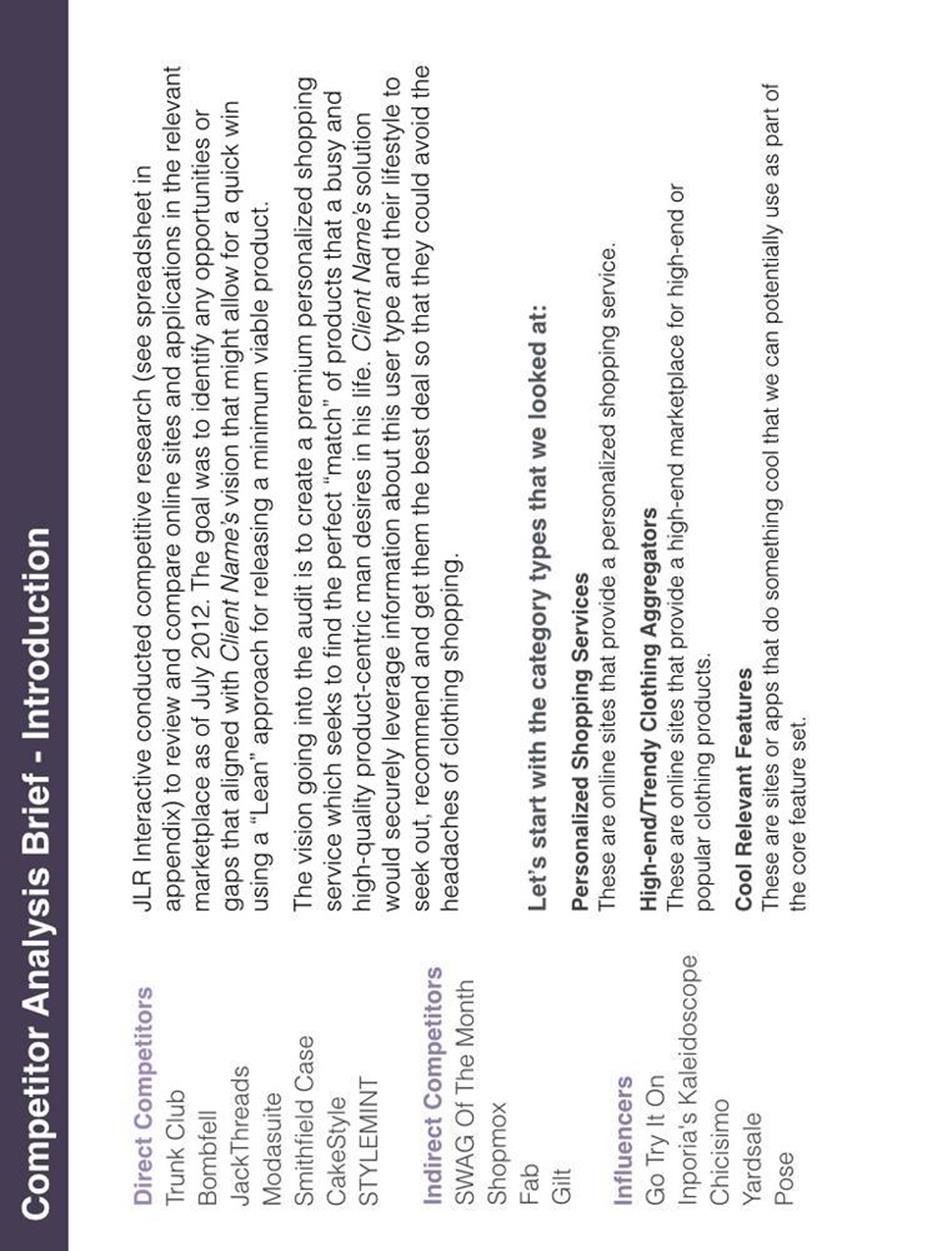
Figure 5-8. Introduction to Competitive Analysis Findings Brief slide
Findings Brief, Section 2: Direct Competitors
In this section, you should highlight at least two or three of the top direct competitors and why their value propositions are relevant to yours. How you choose to showcase them depends on what showcase will best support your recommendations at the end of the brief (see Figure 5-9). Be sure to include screenshots of home pages or features that you want to point out, especially if they offer a visually appealing design, a solid UX, or insight into the viability of the business model. For example, there are many astrology sites. They all have a “Here’s your horoscope” feature, but some of them have better personalization or superior content, and therefore they deliver a more powerful experience.
You can also discuss each direct competitor, mentioning specific things that give them a competitive advantage (see Figure 5-10 and Figure 5-11). You can use arrows to point to aspects of the UX that you want to call out to your team and stakeholders. Call out a competitor if it’s a serious threat — if it has a large market share, if it caters to your intended customers, if its product is solid, if it has copious financing to scale quickly. Point out features or layouts that you believe should be replicated. Also discuss any of the competitors’ weaknesses. What features should be avoided? Which competitor did something particularly badly? Or can this negative aspect of its UX be an opportunity for your product?
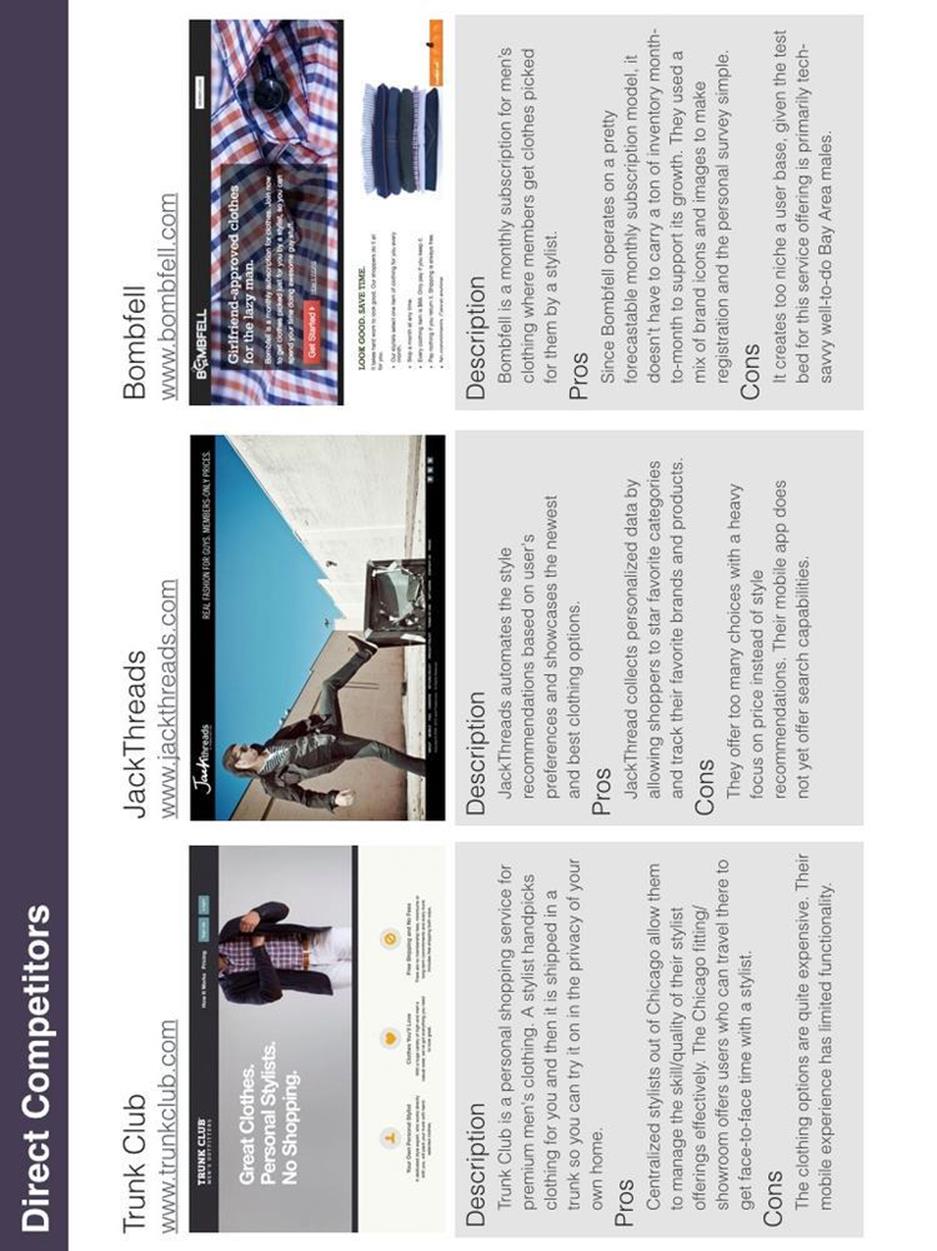
Figure 5-9. Direct competitors high-level view slide
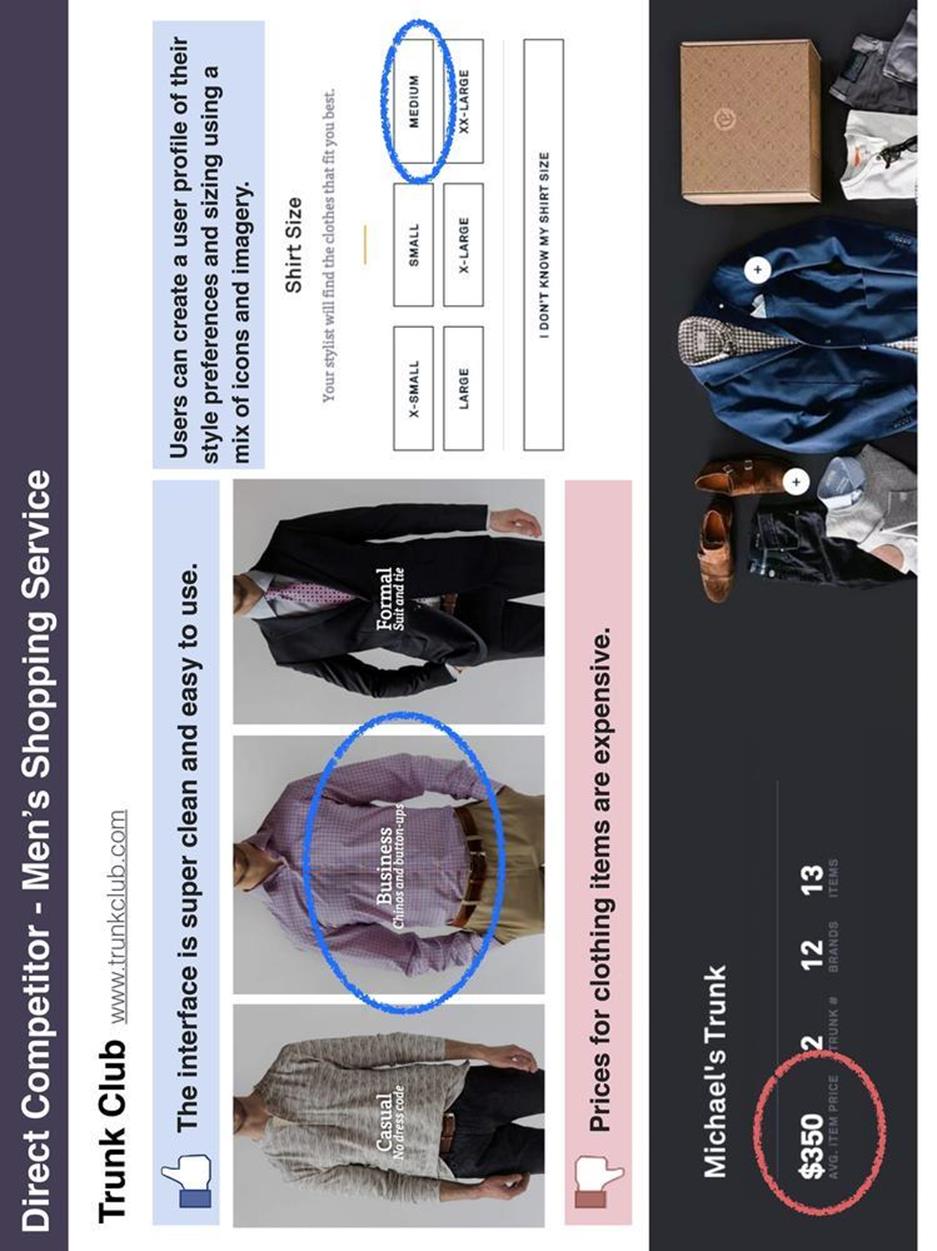
Figure 5-10. Calling out relevant aspects of the direct competitor’s product
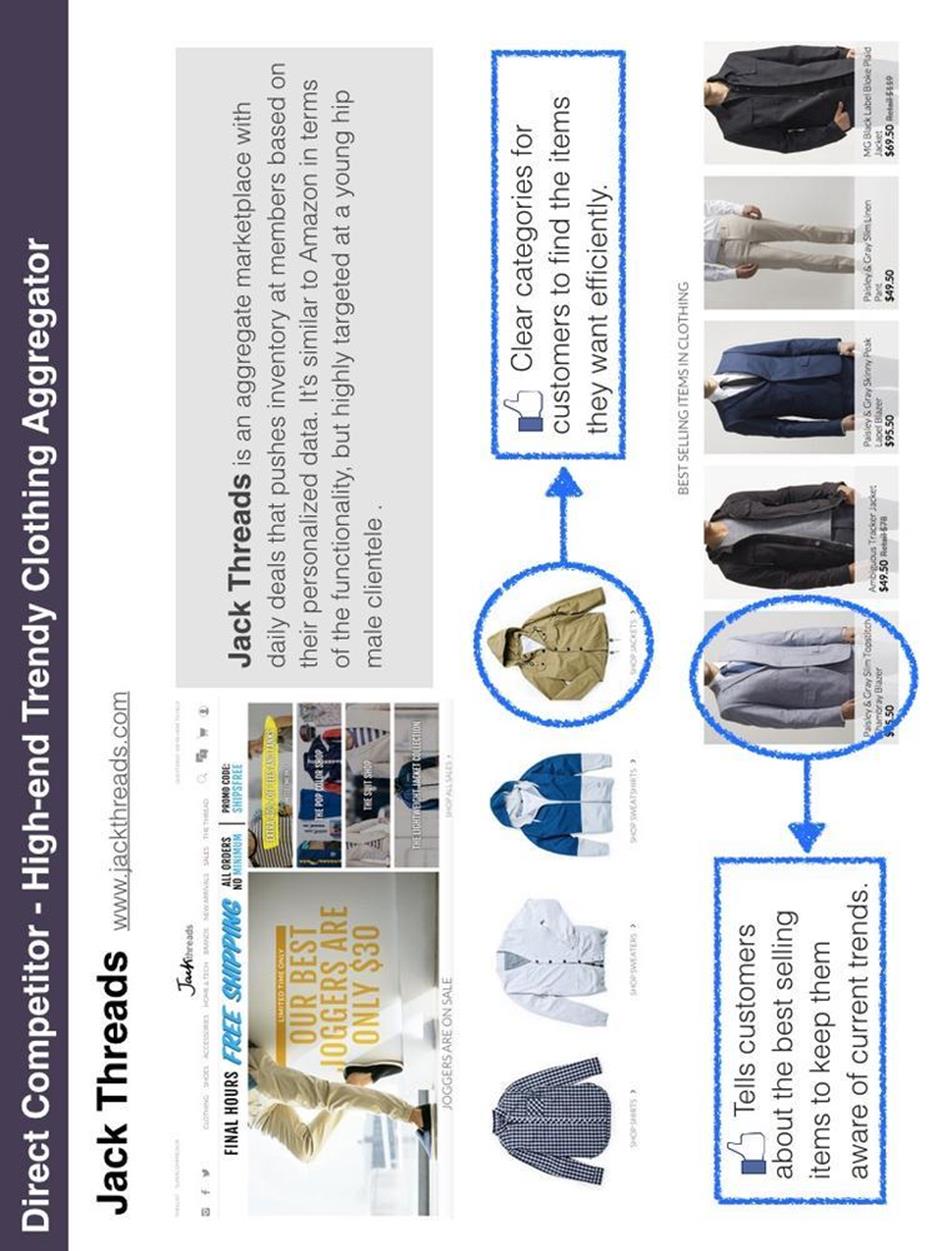
Figure 5-11. Calling out relevant aspects of the direct competitor’s product
Findings Brief, Section 3: Indirect Competitors
With indirect competitors, you want to demonstrate what they’re doing right with respect to your value proposition (see Figure 5-12). The negative aspects are less consequential because they are not direct competitors.
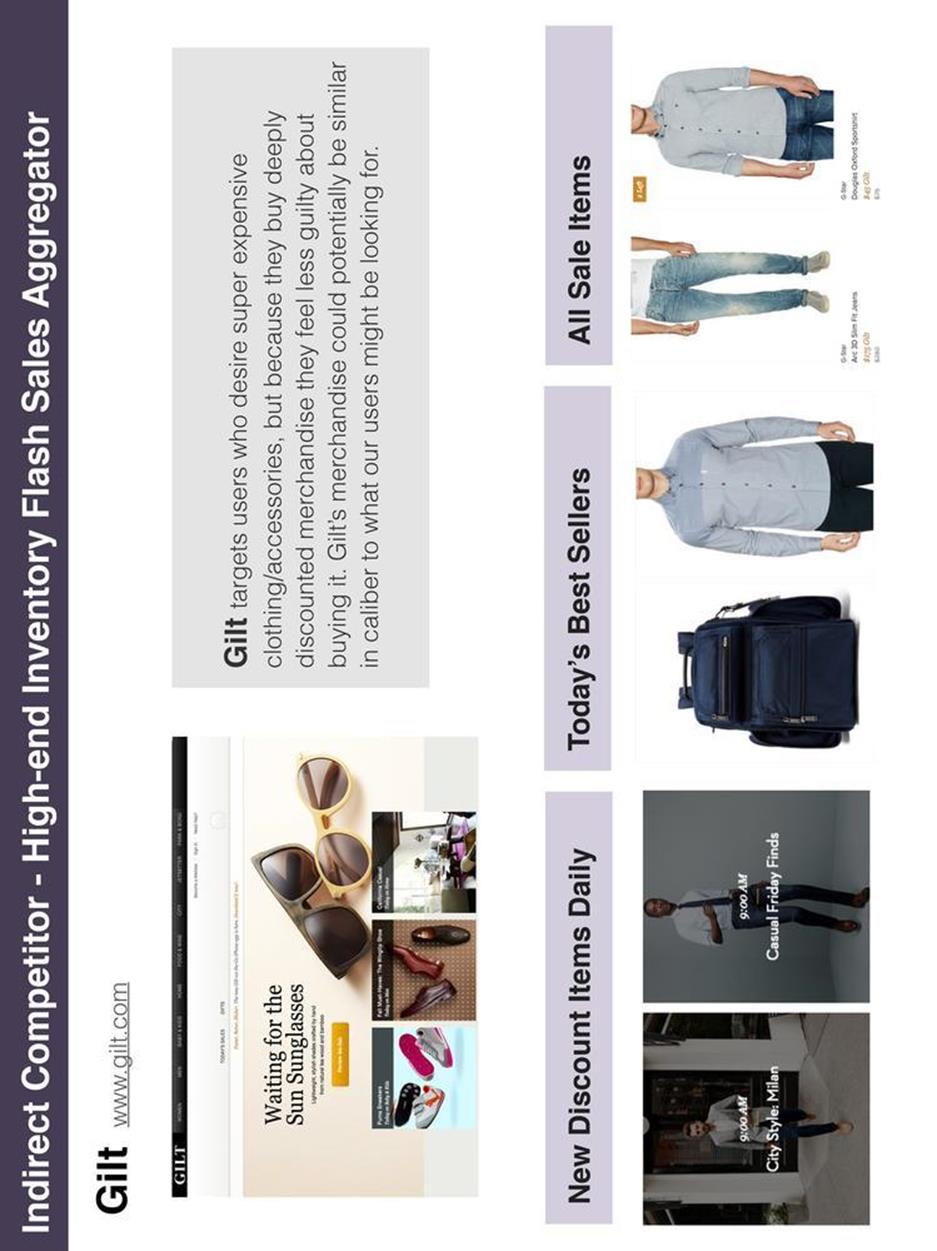
Figure 5-12. Indirect competitor slide
Look for clues in these areas:
§ Revenue streams for monetization
§ Mental model for the navigation system or transaction flow
§ Features that simplify the experience
§ New and interesting visual treatments and animations
§ Improved messaging and content strategy
Use arrows to point out aspects of the UX that are relevant to the solution that your team is pursuing. Explain why you’re pointing them out and what insight they offer into market opportunities. You will organize these points based on what you want the stakeholder or team to understand by the end of the brief.
Findings Brief, Section 4: Cool Features from Influencers
In this section, write about any cool or relevant UX features or findings about the marketplace that might not come from competitors (see Figure 5-13 and Figure 5-14). I call these types of products “influencers” because they are not in your product’s competitive landscape but could offer insight into your product’s value innovation. An influencer doesn’t even have to be an online product. As long as it has an interaction, transaction, or capability you’re trying to accomplish, it’s an influencer.
Often, an influencer might have a very cool feature that could be the differentiator your product is looking for. A good example of this is how Airbnb utilized the Yelp map functionality. Yelp is not a direct or indirect competitor for Airbnb, but Airbnb saw how refining a user’s results set by zooming in and out of a map might be a useful differentiator for its subletting service. It allowed the influence, and that map feature is now a very distinctive feature of Airbnb!
In the course of your research and analysis, it’s probable that you’ve already identified or noted influencers. Maybe you sighed to yourself and thought, “If only this product was more like [insert product name].” That product is most likely a good influencer. It’s also possible that an influencer inspired your original value proposition. For example, Paul the movie producer was originally inspired by Amazon’s Wish List feature. Even though Amazon.com itself would have been neither a direct nor indirect competitor to his product, the UX of Amazon could definitely influence the product in a positive direction and distinguish it from the competition. Therefore, it should be presented here in the brief in a way that is similar to the direct and indirect competition.

Figure 5-13. UX influencers from the mobile space slide
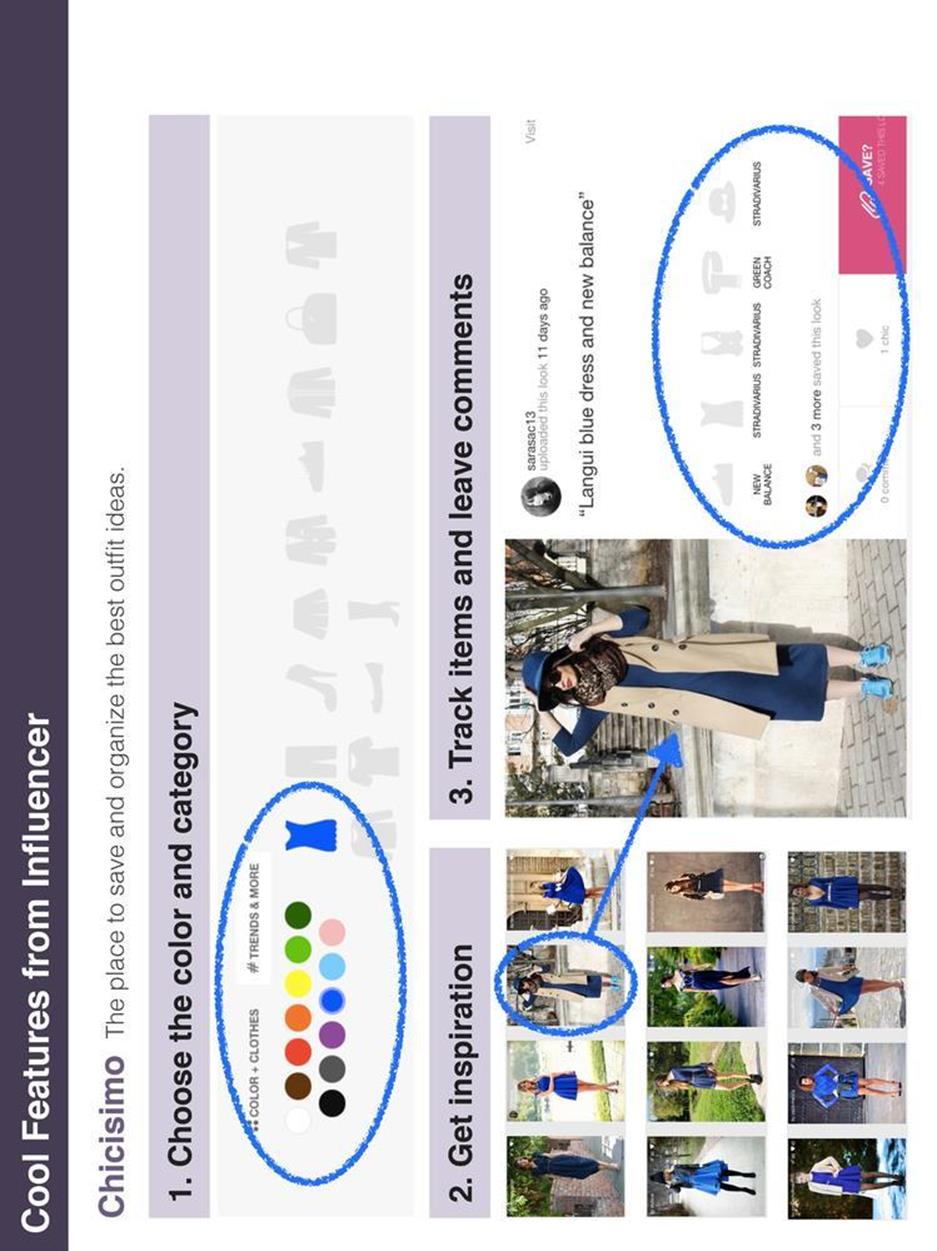
Figure 5-14. UX Influencer slide
Findings Brief, Section 5: Taking a stand/Your Recommendations
This is the most important section. You need to voice your opinion in a strong, authoritative way. This summary should be an honest and balanced assessment about what the current competitive landscape looks like (see Figure 5-15). However, you don’t want to leave your client with nowhere to go. Think about what the client’s original vision was for the product and what aspect of that vision can be realized no matter if the market is blue, red, or purple.
If your analysis supports the value proposition, your recommendations will probably suggest specific ways to capitalize on market opportunities and gaps through the user experience. Your recommendations might answer these questions:
§ Can a specific function such as the Browse or Search capability be improved to help customers discover or find something that currently takes a lot of work to find? (See Chapter 6.)
§ How can you make the product experience more personalized? (See Chapter 6, Chapter 8, and Chapter 9.)
§ How can your team create or optimize a funnel to increase engagement? (See Chapter 9.)
§ How can your team take advantage of something like social networks to drive people to your funnel? (See Chapter 9.)
If your analysis reveals that the value proposition is facing certain risks, your recommendations need to pivot on the targeted customer segment or the specific problem. You would need to recommend that your team or stakeholder pursue a different version of the value proposition and/or business model. As such, your comments might try to address these scenarios:
§ Is this an expensive endeavor to take on or are there ways to de-risk the vision by experimenting with Minimum Viable Products (MVPs)? (See Chapter 7 and Chapter 8.)
§ Do you see another possible angle that addresses aspects of the stakeholder’s vision, or do you recommend that the team pivot on the customer or its problem? (See Chapter 3 and Chapter 8.)
§ Does more research need to be conducted to really know if the value proposition is viable, such as with Guerrilla User Research (see Chapter 8) or using landing page A/B tests? (See Chapter 9.)
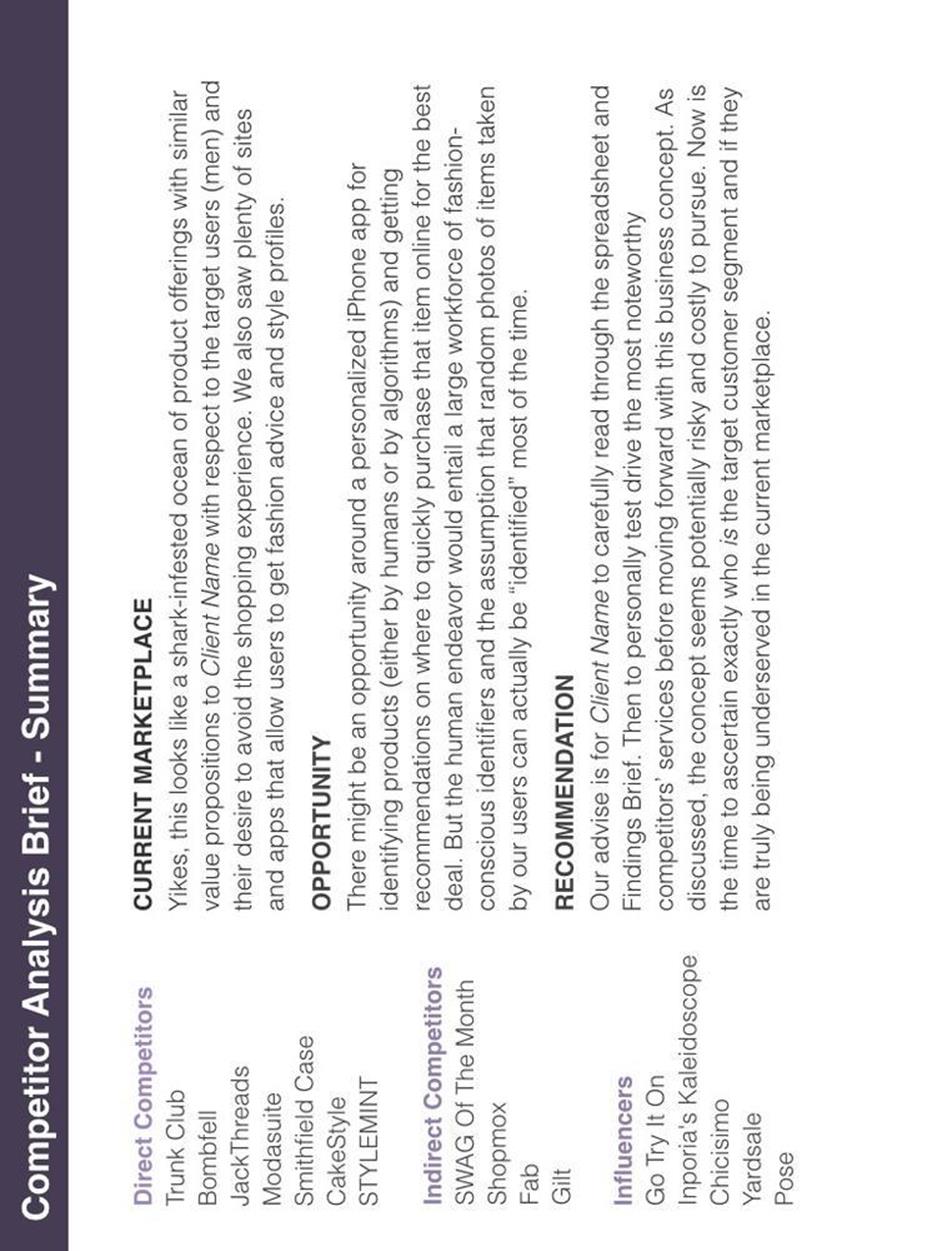
Figure 5-15. Summary slide
Whether your recommendations are positive or negative, you are required to take a stand about the viability of the product you’re researching. Sometimes, as in the case of Paul the movie producer, your recommendations aren’t what the client wants to hear. It’s just reality, and sometimes that’s just how it plays out. Yet, the reason you conduct research and analyze data is to learn about the real potential of the product so that you can make empirical calls about how people will spend their time and energy. You might learn that the client’s initial vision faces a lot of challenges. You might also learn that there are better alternatives to the product. It’s your job to analyze the data and to present these insights with solid supporting evidence.
You are now at the end of the Competitive Analysis Findings Brief, and you understand with absolute certainty what kind of marketplace your product is facing. You are now at a crossroads:
§ If you’re in a red ocean, you need to ask, “Why am I creating something in a saturated marketplace?” You might need to go back to the earlier chapters to reassess your customer segment, customer problem, or competitive landscape.
§ If you’re in a purple or blue ocean, move on to Chapter 6. You’re at the threshold of possibility — to build an innovative product! Now, you just need to resolve how to capitalize on the opportunity.
PRESENTATION AND TAKEAWAYS
It’s not uncommon for the client to only glance at the spreadsheet and appreciate that the UX strategist has done his homework. Thus, include the spreadsheet as an appendix, so the client can reference the raw data as needed and when convenient. I recommend downloading an Excel version of the Google spreadsheet so that the client can look at it offline or share it with others without having to link to the cloud version. You can also include the link to the cloud version if you expect this exercise to continue and potentially become collaborative.
Recap
A thorough competitive analysis requires an organized effort to gather information about the competition. In this chapter, you learned that the competitive analysis helps you gain insight into current trends as to what is or is not working. Knowing the unknowns helps your team to not repeat mistakes but instead make good ideas better. A good analysis also exposes gaps and opportunities for your product to take advantage of in the marketplace.
In Chapter 6, you will use what you’ve learned to create new value through differentiation and innovation focused specifically on the UX and/or business model.
[34] Bensoussan, Babette E. and Craig S. Fleisher. Business and Competitive Analysis. Pearson Education, 2007.
[35] Underwood, Jim. Competitive Intelligence for Dummies. John Wiley & Sons, 2013.
[36] http://steveblank.com/2010/03/01/death-by-analysis/
[37] http://en.wikipedia.org/wiki/Benchmark_(surveying)
[38] http://en.wikipedia.org/wiki/Abductive_reasoning
[39] Kim, W. Chan and Renée Mauborgne. Blue Ocean Strategy. Harvard Business School Press, 2005.
All materials on the site are licensed Creative Commons Attribution-Sharealike 3.0 Unported CC BY-SA 3.0 & GNU Free Documentation License (GFDL)
If you are the copyright holder of any material contained on our site and intend to remove it, please contact our site administrator for approval.
© 2016-2026 All site design rights belong to S.Y.A.