C++ All-in-One For Dummies (2009)
Book II
Understanding Objects and Classes
Chapter 4: Demonstrating Behavior with UML
In This Chapter
Drawing out objects in UML
Expanding use cases into use case diagrams
Ordering steps with sequence diagrams
Showing how objects collaborate
Noting the flow of activities
Stating the different states of an object
In this chapter, we take you through the five dynamic diagrams in UML. These are the diagrams that show how objects work together and change over time. Some of them you may find more useful than others, and that’s fine — you don’t have to use all the diagrams you see in this chapter. You are free to use those that you find the most useful.
Drawing Objects
In UML, you can draw class diagrams that show the classes in your system, or you can get right down to it and draw an object diagram, which contains actual instances or objects. Because you are drawing instances, you might have multiple objects of a single class on a single object diagram.
 When you draw objects on a UML diagram, they look pretty much the same as class diagrams, but with one important difference: For an object, the name at the top of the rectangle is underlined. With classes, the name is not underlined. Be sure to remember this difference so your diagrams don’t confuse other people. Probably the best way to explore an object diagram is to see it compared to a class diagram. Take a peek at Figure 4-1, and you can see a class diagram at the top and an object diagram at the bottom.
Two classes are in the diagram. The names are not underlined and the two classes are related by composition. The composition is one-to-many — one Pasture instance to multiple Cow instances. In effect, instances of the Pasture class contain 0 or more instances of Cow. We included some attributes for each class.
Figure 4-1: Class diagrams and object diagrams are similar.
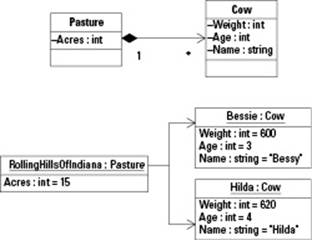
The lower half of the diagram shows instances of the classes. When you program, you sometimes give a name to an instance in the way of a variable name. Or you may be using a language that allows its objects to be named. (C++ does not allow this; you have to use a variable name.) In the object diagram, we named the instances. At the top of each rectangle is an underlined name, a colon, and the class type. Thus, RollingHillsOfIndiana is an instance of type Pasture. Bessie is an instance of type Cow, and Hilda is also an instance of type Cow. Inside the object boxes, we also gave values to the member variables (or attributes). For these, the name goes first, then a colon, then the type, just as in the class symbols. But then you see an equal sign and a value. (Because these are actual instances of the class, they can have values for the member variables.)
Look carefully at the line connecting the RollingHillsOfIndiana object to the Bessie and Hilda objects (as well as the line connecting the two classes). You can see an arrow pointing to each of the Cow instances but not to the Pasture instance. Thus, the Pasture instance contains a pointer to each Cow instance but not vice versa. That means the Cow instances don’t know about the Pasture instances. That is, the Cow instance does not contain a member variable that points to the Pasture instance. You can see this is the case also with the class diagram, because an arrow is pointing to the Cow class.
If you want both instances to know about each other, you simply remove the arrows and use just lines. This change is called a bidirectional association. When you have an arrow, the arrow means that the relationship is unidirectional. In the case of Pasture and Cow, the arrow means that the Pasture instance can call methods in the Cow instance but not vice versa. The Cow instances are not aware of the Pasture instance.
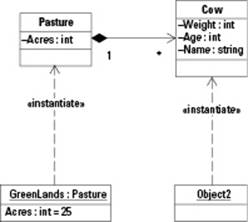
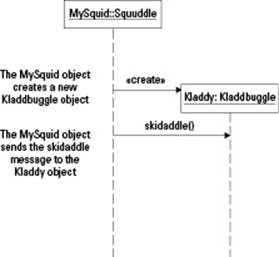
Sometimes, people really like to show that the objects are instances of the class by drawing a dashed arrow from the instance to the class and adding the <<instantiate>> stereotype. When you have lots of instances, this technique can make for a messy diagram, but if you have only one instance per class, you can easily show it in the diagram. We did just that in Figure 4-2. Notice that the word <<instantiate>> is present and the arrow points to the class. To us, this setup seems a little backward, but lots of stuff seems backwards in the world of computers, so we’re not surprised.
Figure 4-2: You can show that an object is an instance of a class.
Casing Out the Use Cases
Talk about disagreement. People have argued and bickered about use cases for years. The term use case (pronounced with a soft s, as in use, because use is a noun here) refers to one single case or instance of functionality in your program. Most programs have many, many things you can do with them; for example, a Web browser enables you to click the Go button to go to a Web address that you typed into a box; or it enables you to click a link to go to a page. These two things are each a single use case.
Use cases have become an important aspect in modeling software. So why the contention? Because use cases focus on the functions (that is, verbs!) of a software package, while objects focus on the things, or nouns. So it would make sense by that argument that use cases have no big place in object-oriented analysis and design. However, the flaw in this argument is in saying that object-oriented means you focus only on the nouns. It’s true that it’s oriented to the objects, but that doesn’t mean you ignore or have a disdain for verbs. Personally, we like verbs. Life without verbs boring. Talking difficult with no verbs. Me car grocery store.
And the same is true with object-oriented programming. Although we focus our building around the objects, we still have functions, which are verbs. And we still have functionality. And we can organize and group the functionality, such as through menus or through dialog boxes.
And so, when we design software, one thing we do is go through and list all the use cases we can think of for the software. This often takes place in the analysis phase.
Figure 4-3 shows an example of a use case diagram. The actual use cases are the oval shapes. And you certainly noticed the other goofy symbol: The stick man figure! The stick man figure is called an actor because it represents the user interacting with the application similar to the way an actor interacts with the audience. Yes, this is one time when we, the software engineers of the world, get to revert to our childhood roots and draw pretty pictures. In this case, we get to draw stick figures. Now, just to be crystal clear, please realize that this a unisex stick figure. It is neither a man nor a woman, or both a man and a woman. Thus, we don’t need to draw a skirt to show a woman as so many other fields do. Here, we believe all people are, at heart, all the same. Thus, we draw our stick figures all the same.
Figure 4-3: A use case diagram shows the functionality of a system.
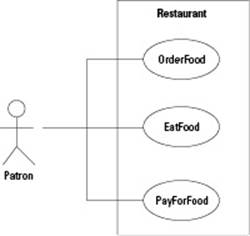
Now, if you look at Figure 4-3, you can see that the use cases each have names. These are the things that the user can do with the system. (We use the word system to mean a collection of software that you’re building.) The system in this example is called Restaurant.
Use case: Order food
Ordering food is a handy and tasty example of how events flow in a use case:
ID: UC1000
Actors: Patron
Preconditions: Patron must be seated at the table with a napkin covering the shirt. Hands must be clean.
Flow of events:
1. The patron waits for the server to arrive.
2. When the server arrives, the patron orders the food.
3. The server takes the order to the kitchen.
4. The cook prepares the food.
5. The server delivers the food to the table.
6. The patron eats the food.
Postconditions: The patron has a full stomach and is ready to pay for the food.
For some steps, you may have what amounts to an if-then-else block in your code. You can notate this in different ways, but here’s a handy one: The flow of events goes beyond Step 6, like this:
7. The server asks the patron whether he or she will be having dessert.
8. If the patron wants dessert.
8.1. The patron looks at the dessert menu.
8.2. The patron chooses a dessert.
8.3. The server fetches the dessert.
8.4 The patron eats the dessert.
9. else
9.1 The server relaxes for a moment, dreaming about what life could have been like if he or she had only had dessert.
Steps 1 through 9 can easily be a function or an algorithm. You can also use for loops and while loops by putting the for or while condition and following it with steps:
9.2 For each dessert on the menu the patron imagines.
9.2.1 Eating one single bite.
9.2.2 Contemplating the flavor.
9.2.3 Devouring the rest.
The stick figure guy (or gal) represents the user of the system. In the case of a word processor, that could be you sitting there using it, or it could be another human. Either way, it represents a user, a human being. The lines point to the different use cases the user has access to.
Expanding use cases
After you draw your use cases on the diagrams, you can define what they do on paper. The way you do this is to write the information in a single-column table, with each row specifying different information about the use case. This information includes:
♦ Name: The name of the use case as you described it in the diagram.
♦ Unique Identifier: Some people like to include a special code, such as UC (which stands for use case), followed by a number, as in UC1000.
♦ Actors: The actors involved with the use case.
♦ Preconditions: The situation that must exist before the use case can begin to operate.
♦ Flow of events: A step-by-step flow of the events that take place when the use case runs.
♦ Postconditions: The situation that will exist after the use case runs.
A sample use case makes an exclusive guest appearance in a nearby sidebar.
Matching use cases and requirements
When you are designing software, making sure that every requirement has at least one use case associated with it is a good idea. Remember: The requirements describe what the software does.
Table 4-1 shows an example of how to ensure that each requirement has at least one associated use case. Remember that you normally give each use case an identifier (the need for the identifier increases as project complexity increases). You can do the same with the requirements.
|
Table 4-1 Sample Requirements |
||||
|
UC1 |
UC2 |
UC3 |
UC4 |
|
|
REQ1 |
✓ |
✓ |
||
|
REQ2 |
✓ |
|||
|
REQ3 |
✓ |
|||
|
REQ4 |
✓ |
✓ |
||
In this grid, each requirement has at least one use case associated with it. Further, each use case satisfies at least one requirement. If a requirement was missing, you would need to add a use case. If you have a use case that does not satisfy a requirement, you must make a decision: Either you discovered a new use case and, therefore, a new requirement, and you need to add that requirement; or you went overboard and added an unnecessary feature, in which case you can eliminate the use case.
Sequence Diagrams
When you are working with objects, showing a time sequence of how objects interact with each other is helpful. You can do this by using a sequence diagram. A sequence diagram can be a little mind-boggling when you first look at it (at least it was for us), but after you understand the layout, a sequence diagram makes more sense. In a sequence diagram
♦ Time moves from top to bottom. In effect, things positioned higher on the diagram happen earlier; things positioned lower happen later.
♦ Objects are drawn side by side, left to right.
♦ When one object sends a message to (calls a member function of) another object, you show this as a solid arrow with a filled-in arrowhead. Above the arrow, you put the name of the function (or the name of the message if you prefer that jargon).
Refer to Figure 4-3 for a moment, and you can see how this sequencing business works. We took the use case shown in that figure and built a sequence diagram from it. Note, however, that we did not include the added part about the dessert. We will add that shortly, because the process of adding it is a bit more complex. Also, note that to build this sequence diagram, we first had to come up with some classes. They are as follows:
♦ Server: This is a class whose instances receive an order, send it to a Cook instance for preparation, and then take the order and deliver it to the patron.
♦ Cook: This is a class that can receive an order and prepare it.
♦ Food: This is a class that represents, well, food!
Notice that we did not create a class for the Patron. That’s because the Patron is outside the system and not a part of it. The Patron, instead, uses the system.
Figure 4-4 is an example of a sequence diagram. Remember, the stuff at the top takes place earlier in time, and as you move your eyes down the diagram, you are advancing forward in time. And you can even move your eyes up on the diagram, although be careful because you don’t want to go back in time and relive your past!
Figure 4-4: A sequence diagram shows activity over a range of time.
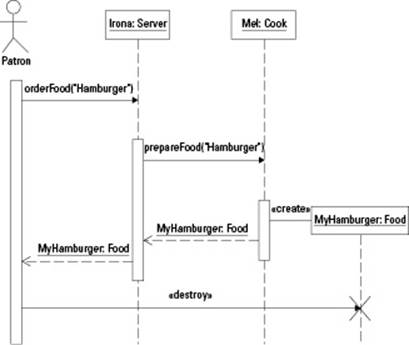
Here’s how this diagram works. The objects are listed at the top, along with the user who initiates the use case. Below the objects are dashed lines that represent the lifeline of the object. The top of the lifeline represents the time the object is created. For example, if you create an object in the middle of a use case, you would begin the object at that time position (that is, vertical position) on the use case. Here, most of our objects existed before the use case (because they’re at the top of the diagram) and their lifeline stretches to the bottom of the diagram; it does not end. That means the objects are around for the full duration of the use case. However, one object, the Food instance, comes to life in the middle of the use case.
Now, notice that a bar (a tall, thin rectangle) replaces the lifeline in some places. This is where the object has focus in the use case. Or you can say the object is active. Before and after, the object is sitting there, but this use case isn’t actually using the object. Although the bar is present, the use case is using the object.
Finally, look at the horizontal arrows. This is where an object to the left calls a member function in an object to the right. The first arrow has a label orderFood(“Hamburger”). This arrow starts on the bar for the user (called Patron) and points to the Server object called Irona. In effect, the user calls the orderFood member function in the Server object. Then right under that, the Server lifeline becomes a bar, which means it’s active. The Server then calls prepareFood(“Hamburger”) for the Cook object called Mel.
When the Mel object receives the prepareFood(“Hamburger”) message, it creates a new instance of Food. Notice that the arrow to the right of the Mel lifeline calls a function in the Food object, but this is not a typical function. Instead, it’s a stereotype with the word create in double angle brackets. This means that the Mel object creates a new instance of Food and calls it MyHamburger. Because the object was just created, its lifeline begins midway down the diagram.
Then the returns follow: The Cook object returns an object called MyHamburger (which is of class Food). The Server object receives this and returns it back to the user.
Now think about this: How can the user call a function? A user can do it through a user interface, such as a window on the screen with buttons on it or perhaps a menu item. That is, the user interface is the part that you see on the screen! And the name makes sense: It’s the interface to the program for the user. Thus, you have a deeply philosophical concept here: Through the screen, keyboard, and mouse, you are interfacing with the computer program, calling member functions. Pretty good!
And finally, notice that the user deletes the object. How can this be? Remember that this use case has a function that the user called. That function then calls destroy. The object’s lifeline ends with the deletion, and you see a big X to show that the line ends.
When an object on a sequence diagram calls a member function of an object to the right, a common term for this process is that the first object is sending a message to the second object. If you are using a tool to help you draw UML diagrams, the arrows might be called something like message arrows.
Notating sequence diagrams
When you create a sequence diagram, you are free to put some notes to the left of the sequence diagram. These notes on the left describe what the thing does. Figure 4-5 shows an example of this.
Figure 4-5: You can notate a sequence diagram by putting text along the left side.
Looping and comparing in sequence diagrams
To show a loop (such as a for loop or a while loop) in a sequence diagram, you enclose part of your sequence diagram in a rectangle and put the loop condition immediately below the rectangle. You can see this in Figure 4-6, where we put the rectangle around the point when the Serverobject calls the payBill method on the CashRegister object.
Figure 4-6: To show a loop, use a rectangle with a loop expression following it.
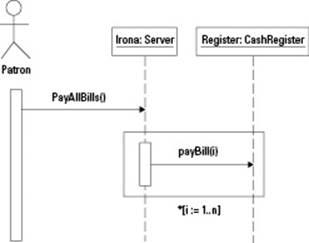
 Believe it or not, UML does not have a standard syntax for specifying a loop condition beyond the fact that you must start it with an asterisk. However, a common approach is to use notation, such as i := 1..5, which means the loop counter i increases from 1 to 5. Thus, there are five iterations; in the first, i is 1; in the second, i is 2; and so on; and in the final i is 5. So you can see in Figure 4-6 that Patron sends a message to the Server to pay for all the meals in the restaurant. (Apparently this Patron just won the lottery or something.) TheServer then goes to the CashRegister object and processes all the orders.
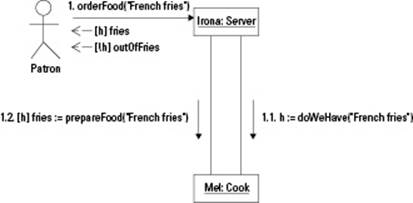
Now suppose in our little restaurant model that the restaurant is out of a particular food, such as french fries. In that case, the Server object might go back and ask the cook if any french fries are still available. If they are, the Server will request that they be included in the order. TheServer will then return the order of fries to the Patron; otherwise the Server will send a message back to the Patron (that is, return a message, in computerese) that there are no more fries. You can show this as we did in Figure 4-7.
Figure 4-7: To show conditions and comparisons, use brackets.
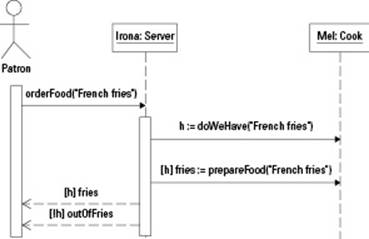
Look at how this works. First, the Server object sends the message doWeHave(“French fries”) to the Cook object. (We simplified this part of the diagram by not showing how the Cook object does this.) The result of this comes back as either true or false, which we store in theh symbol. Then, in the next step, the Server calls prepareFood only if h is true. That’s what the brackets with the h in them mean.
Colons in assignment statements?
In UML, you often see an assignment statement with a colon, rather than just an equals sign. For example, you might see index := 10. Why the colon? Well, it turns out that this syntax is borrowed from some languages other than C and C++. Lucky us. C++ is probably the single most popular language on the planet, and the designers of UML used another language for some of its syntax. In the two languages, Pascal (which is the underlying language for a programming tool called Delphi) and Ada (which is supposedly used a lot by the military), the colon always precedes the equals sign in an assignment statement. And to make matters more complicated, these two languages also use a single equals sign for comparison. C++, of course, uses two equals signs for a comparison. Maybe someday we’ll have a standard computer programming language. Until then, life is messy in the programming world. But we’ll survive.
Finally, if h is true, the Server object returns the order of fries in the form of a new Food object. This is the return line that starts with [h], which means that h is true. (We didn’t show the process of the Cook creating the Food object; you can see that kind of thing in Figure 4-3.) But if h is not true, the Server object returns a symbol that represents there are no more french fries. (You will probably make this symbol an enum in C++, or perhaps a 0.)
At this point, we’re actually getting into some local variable names, such as the value of whether there are french fries. However, most CASE tools aren’t sophisticated enough to take a sequence diagram such as this and generate C++ code that works. Most can generate some basic code, and some let you type the code through the CASE tool. You will most likely take this diagram and use it as a guide to write your own code. Designing it through the diagram is a lot easier than with the code. And other people — those who don’t program — can get a basic idea of the flow of events by looking at the sequence diagram. It’s less likely that they would understand code. That way, the people called stakeholders (those who run the company and eat lots of steak) can look at the diagram and tell you if you’re building what they want you to build.
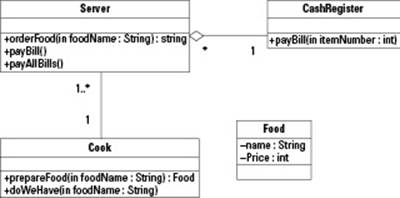
As you refine your sequence diagrams, you may discover member functions that you didn’t include in a class, or you might even discover new classes. As we built the sequence diagrams in this section, we discovered that we didn’t have methods for paying the bills. And so we ended up adding a CashRegister object and some methods in various objects for paying the bills. We also discovered that we needed some methods for finding out whether a certain food item existed. As you can see, we refined the software system as we worked on these diagrams. And that’s the goal of UML: To refine it and get it all right! If you’re curious, check out Figure 4-8, which is the updated class diagram we created as we were working on these sequence diagrams.
Figure 4-8: Your class diagrams will evolve over time.
Collaboration Diagrams
Collaboration diagrams are similar to sequence diagrams, but they don’t show the time ordering. The idea is that they give an overview of the interactions between the diagrams. Frankly, we always opt for sequence diagrams and tend to skip the collaboration diagram; in many ways, a sequence diagram is a type of collaboration diagram that has the benefit of showing a time sequence. However, if you don’t want to show time sequence and instead want to focus on interactions between the objects, you can use a collaboration diagram.
If you look back at Figure 4-7, earlier in this chapter, you can see an example of a sequence diagram. Now in Figure 4-9, we have the same information, but it is in the form of a collaboration diagram.
Figure 4-9: A collaboration diagram shows information similar to that in a sequence diagram but focuses on object interactions.
In Figure 4-9, no time sequence is given. The diagram focuses on the interactions between the objects and between the user and the objects. However, we did give a basic notion of steps by numbering the messages (1, 1.1, and 1.2). First, the user sends a message to the Server object; second, the Server asks the Cook if there are more fries. And third, if there are, the Server puts in the order for the fries.
We didn’t just number these things 1, 2, 3. We started with 1, then 1.1, and then 1.2. The reason is that we imagine the second and third steps as being substeps to Step 1. Ultimately, these will be inside a single function, such as this pseudocode (simplified code that illustrates the basic point):
orderFood() {
h = doWeHave(“French fries”)
if (h) {
fries = prepareFood(“French fries”)
return fries
}
else {
return outOfFries
}
}
This is almost C++ code, and it would be easy to change it to real C++ code (such as declaring the variables and making this an actual member function with a return type and a parameter list). This is partly how we envision the collaboration diagram looking in C++ code; the calls todoWeHave and prepareFood are inside the code for orderFood. And thus, they get substep numbers 1.1 and 1.2 (like an outline) rather than their own Steps 2 and 3.
Activity Diagrams
An activity diagram is essentially a flowchart. It shows a sequence of steps. Yes, so does a sequence diagram and, in some senses, a collaboration diagram. However, there’s a slight difference: You normally use a sequence diagram to show the steps in a use case. You can use an activity diagram to show individual parts of a sequence diagram, such as a single member function.
The idea behind an activity diagram is that it shows the lowest level of steps possible. In effect, the steps (activities) in an activity diagram can’t be divided into substeps. The word that computer people like here is that the activities are atomic and cannot be divided, as people once believed atoms could not be divided. (But this time the theory will stick.)
Figure 4-10 shows an example of an activity diagram. The diagram shows the starting point with a filled-in circle (in this case, at the top of the diagram). Then an arrow points to the first activity (Eat first bite), which is inside an oval. Next comes a decision. Unlike traditional flowcharting, you do not put any text inside the decision. Instead, you show arrows extending away from the diamond; beside them, you put a Boolean condition inside brackets. Or you can put the word else for all other cases. Thus, in this diagram, if the food is yummy, you can move down to the oval on the lower right (Eat another bite). Otherwise you move down to the oval on the lower left (Throw food away).
Figure 4-10: An activity chart is similar to a flowchart.
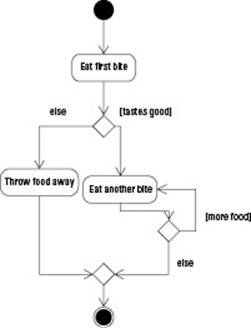
We followed the Eat another bite activity with a decision. If the condition [more food] is true, you go back to Eat another bite. Otherwise you move to the final diamond.
The final diamond shows all the steps coming together. A diamond represents a return from a decision, where the different paths come back together. We did not put any conditions around it. We show two arrows going in but only one coming out.
And then the final thing is a filled circle with a border around it. That represents the final state or, more simply put, the end of the activity diagram.
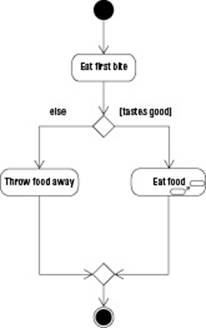
Sometimes, you might want your activity diagram to include a step that is not atomic; you might want to show that you perform a complex step next, but you just give the name of the step without showing all the steps. Such a step is called a subactivity. A subactivity is not atomic, and it can be broken up into further subactivities. In Figure 4-11, we created a subactivity called Eat Food. We don’t show the detailed steps on eating the food; we just point out that the computer must perform the function called Eat Food. To make this clear, we used a slightly different diagram. It’s an oval with two ovals inside, with one pointing up to the other.
Figure 4-11: A subactivity can contain other subactivities.
State Diagrams
A state diagram shows the different states in which an object can live. We don’t mean Nebraska or California, but a state such as this collection:
♦ The food name is Hamburger.
♦ The burger’s top bun is present (or true).
♦ The burger’s meat is present (or true).
♦ The burger’s bottom bun is present (or true).
♦ The food is accompanied by ketchup and mustard.
♦ There are ten remaining bites.
These items together all show the current state of an object. An object’s state is represented by the values in the member variables, what function the object is presently running (if any), and how it is currently associated with other objects. For example, this Hamburger object might be in the hands of the Server and not the Patron. That is one part of the object’s current state.
A state diagram is similar to an activity diagram. A state diagram shows flow from state to state. But it also shows how to get from one state to the next.
States on a diagram are rounded rectangles (rectangles with rounded corners).
We show a basic state diagram in Figure 4-12. The burger has two states: Hamburger present (meaning it’s all there) and Bottom-only Burger (meaning the top bun has been eaten away by somebody or something). These two states are shown in rounded rectangles, and their names are present.
Figure 4-12: A state diagram shows the different states an object can be in.
![]()
How does the burger transform from one state to the next? In the diagram, you can see an arrow pointing from one state, Hamburger present, to the next, Bottom-only Burger. That arrow is the only one in the diagram, which means that it’s the only possible state transition. That is, the burger can be in the Hamburger present state, and next it can move to the Bottom-only Burger state, but not back. And the burger gets there when the situation written above the arrow takes place. Here’s what that means:
1. The first portion of the text is biteTopBun. This is a process or activity or step that takes place.
2. The next portion is [didn’t miss]. That’s a condition. If the bite worked (and the assailant didn’t miss), you get to go on to the new state.
3. To go on to the new state, you do what follows: removeTopBun. Of course, the biting and the removing really are one step. But in computers, we can break it up. The biting is the process of starting to remove the bun, and it’s possible that the biting will fail (if you miss the bun, that is). But if the biting doesn’t fail, the computer must perform the activity called removeTopBun.
Finally, notice how this is all divided. First is the process that takes place. Next is the condition in brackets. Then there’s a slash, and finally the activity that puts the object in the next state appears. Thus the state diagram shows an entire transition between two states.
All materials on the site are licensed Creative Commons Attribution-Sharealike 3.0 Unported CC BY-SA 3.0 & GNU Free Documentation License (GFDL)
If you are the copyright holder of any material contained on our site and intend to remove it, please contact our site administrator for approval.
© 2016-2025 All site design rights belong to S.Y.A.