Introduction to Game Design, Prototyping, and Development (2015)
Part II: Digital Prototyping
Chapter 27. The Agile Mentality
In this chapter, you learn how to think about projects as an agile prototyper and how to weigh your options when beginning to tackle a project. You are introduced to the Agile development mindset and Scrum methodology. We also look extensively at burndown charts, which I recommend using on all your future projects.
After this chapter, you’ll have a better understanding of how to approach your own game projects, how to break them down into sprints that can be tackled in a specific amount of time, and how to prioritize tasks within those sprints.
The Manifesto for Agile Software Development
For many years, a large number of software titles, including games, tended to be developed using what was commonly known as the “waterfall” method of development. Using the waterfall method, a small preproduction team would define the entire project via a massive game design document that was expected to be followed to the letter by the production team as they developed the game. Sticking to waterfall too strictly often led to games that were not tested until they neared completion, and members of these production teams could feel more like cogs in a massive machine than actual game developers.
With the experience you’ve now gained through paper and digital prototyping in this book, I’m sure you can immediately see some issues with this approach. In 2001, the developers who formed the Agile Alliance saw these issues as well, leading to their Manifesto for Agile Software Development,1 which reads as follows:
1 Kent Beck, et al. “Manifesto for Agile Software Development,” Agile Alliance (2001).
We are uncovering better ways of developing software by doing it and helping others do it. Through this work we have come to value:
![]() Individuals and interactions over processes and tools
Individuals and interactions over processes and tools
![]() Working software over comprehensive documentation
Working software over comprehensive documentation
![]() Customer collaboration over contract negotiation
Customer collaboration over contract negotiation
![]() Responding to change over following a plan
Responding to change over following a plan
That is, while there is value in the items on the right, we value the items on the left more.
Embedded in these four core values, you can see many of the principles that I’ve tried to impress upon you throughout this book:
![]() Following your individual design sense, continually asking questions, and developing an understanding of procedural thinking is more important than following predefined rules or using a specific development framework.
Following your individual design sense, continually asking questions, and developing an understanding of procedural thinking is more important than following predefined rules or using a specific development framework.
![]() Making a simple prototype that works and iterating on it until it’s fun is more successful than waiting for months until you have the perfect game idea or solution to your problem.
Making a simple prototype that works and iterating on it until it’s fun is more successful than waiting for months until you have the perfect game idea or solution to your problem.
![]() Bouncing your ideas off of other creative people in a positive, collaborative environment is more important than worrying about who owns specific intellectual property.2
Bouncing your ideas off of other creative people in a positive, collaborative environment is more important than worrying about who owns specific intellectual property.2
2 You do, of course, want to respect other people’s ownership of their IP. My point here is that it’s more important to make something than to argue over who should own what percentage of it.
![]() Listening to and reacting to playtesters’ feedback about your game is much, much more important than following your original design vision. You must let your game evolve.
Listening to and reacting to playtesters’ feedback about your game is much, much more important than following your original design vision. You must let your game evolve.
Prior to my introduction of Agile development methodologies into my classes, students often got drastically behind schedule when developing their games. In fact, they even had trouble understanding how behind they were because they lacked the tools to manage their development process. This also meant that it was difficult to playtest student work until very late in the project.
After my introduction of Agile and its associated tools and methodologies to my classes, I found that several things occurred:
![]() Students had a much better understanding of their progress on projects and were better able to stick to their schedule.
Students had a much better understanding of their progress on projects and were better able to stick to their schedule.
![]() The games being produced by students showed a marked improvement, largely because the students’ focus on constantly having a playable build allowed them to playtest the games earlier and more frequently.
The games being produced by students showed a marked improvement, largely because the students’ focus on constantly having a playable build allowed them to playtest the games earlier and more frequently.
![]() Student understanding of both C# and Unity increased as did their confidence in their technical skills.
Student understanding of both C# and Unity increased as did their confidence in their technical skills.
Of those three points, the first two were expected. The third initially took me by surprise, but I have found it to be the case in every class that I have taught using Agile methodologies. As a result, I have continued to use Agile in all of my classes, in my own personal game development practice, and even while writing this book. I hope that you will too.3
3 Many thanks to Tom Frisina, my colleague at USC, the MDM, and Electronic Arts, for introducing me to Agile and Scrum.
Scrum Methodology
In the years since 2001, many people have developed tools and methodologies to help teams easily adapt to the Agile mentality. One of my favorites is Scrum.
Scrum actually started several years before the Agile Manifesto and was developed by various people, but its relationship to Agile was solidified in the 2001 book Agile Software Development with Scrum by Ken Schwaber and Mike Beedle.4 In it, they describe many of the common elements of the Scrum methodology that have remained popular in the years since their publication.
4 Ken Schwaber and Mike Beedle, Agile Software Development with Scrum, (Upper Saddle River, NJ: Prentice Hall, 2002).
The goal of Scrum, like most Agile methodologies, is to get to a working product or game as quickly as possible while allowing for the design to flexibly adapt to feedback from playtesters and members of the design team. The remainder of this chapter will introduce you to some of the terminology and practices used in the Scrum methodology and show you how to use a spreadsheet-based burndown chart that I have developed for my classes and this book.
The Scrum Team
A Scrum team for game prototyping is composed of one product owner, one scrum master, and an interdisciplinary development team consisting of up to ten other people who are skilled in various fields, including programming, game design, modeling, texturing, audio, etc.
![]() Product owner: The voice of the client or the voice of the future players of your game. The product owner wants to make sure that all the cool features make it into the game, and she is responsible for understanding the gestalt vision of the game.
Product owner: The voice of the client or the voice of the future players of your game. The product owner wants to make sure that all the cool features make it into the game, and she is responsible for understanding the gestalt vision of the game.
![]() Scrum master: The voice of reason. The Scrum master runs the daily Scrum meeting and wants to make sure that everyone is on-task without being overworked. The Scrum master acts as a foil for the product owner by keeping a realistic eye on how much work remains on the project and how quickly the members of the development team are completing the tasks assigned to them. If the project is behind schedule or certain features need to be cut, it’s the Scrum master’s responsibility to make sure it happens.
Scrum master: The voice of reason. The Scrum master runs the daily Scrum meeting and wants to make sure that everyone is on-task without being overworked. The Scrum master acts as a foil for the product owner by keeping a realistic eye on how much work remains on the project and how quickly the members of the development team are completing the tasks assigned to them. If the project is behind schedule or certain features need to be cut, it’s the Scrum master’s responsibility to make sure it happens.
![]() Development team: The people in the trenches. The development team is composed of everyone working on the project and can include the product owner and Scrum master who often work as standard members of the team outside of the Scrum meeting. Individuals on the development team are assigned tasks at the daily Scrum meeting and are relied upon to accomplish those tasks by the next meeting. In Scrum, individual team members are given far more agency than in other development methods, but that agency comes coupled with the accountability of daily check-ins with the rest of the team.
Development team: The people in the trenches. The development team is composed of everyone working on the project and can include the product owner and Scrum master who often work as standard members of the team outside of the Scrum meeting. Individuals on the development team are assigned tasks at the daily Scrum meeting and are relied upon to accomplish those tasks by the next meeting. In Scrum, individual team members are given far more agency than in other development methods, but that agency comes coupled with the accountability of daily check-ins with the rest of the team.
Product Backlog / Feature List
A Scrum project starts with a product backlog (a.k.a. feature list), which is a list of all the features, mechanics, art, and so on that the team expects to implement for the final game. Some of these start out pretty vague and must be broken down into more specific sub-features as development progresses.
Releases and Sprints
A product is broken down into releases and sprints. You can think of a release as a known time when you will be showing the game to others (for example, a meeting with investors, a public beta, or a formal playtest round) whereas a sprint is a step along the way to a release. At the beginning of a sprint, a sprint backlog list is created that contains of all the features that will be completed by the end of the sprint. A sprint usually takes between 1 and 4 weeks, and you need to make sure that regardless of what you choose to work on during the sprint, you have a game (or part of a game) that can be played by the end of the sprint. In fact, in the best case, from the moment when you have your first playable prototype, you should strive to never have a day that ends with the game in an unplayable state (though that’s sometimes a pretty difficult task).
The Scrum Meeting
A Scrum meeting is a daily 15-minute stand-up meeting (literally, everyone stands throughout the meeting) that keeps the whole team on-track. The meeting is run by the Scrum master, and in the meeting, each person answers three questions:
1. What did you accomplish since yesterday?
2. What do you plan to accomplish today?
3. What obstacles might get in your way?
That’s it. The Scrum meeting is meant to get everyone on the same page quickly. Questions 1 and 2 are checked against the burndown chart to see how the project is progressing. Any issues that arise as part of question 3 are marked for discussion after the meeting. When acting as a Scrum master, if an obstacle is brought up during the meeting, I ask for a volunteer to help the person with the potential obstacle but restrict further discussion of the obstacle until after the Scrum meeting is over. You want to keep the Scrum meeting as short as possible so that the creative people on your team are wasting as little time as possible in full-group meetings.
Burndown Chart
I have found the burndown chart to be one of the most useful tools in my game development process and my classes. A burndown chart starts with a list of tasks to be performed during a sprint (the sprint backlog) and estimates the amount of time it will take to complete each task (in hours, days, weeks, and so on). Throughout the project, the burndown chart tracks each team member’s progress on the goals that have been assigned to her and converts it into a chart that not only tracks the total number of hours of work remaining on the project but also the team’s burndown velocity (that is, the average number of hours of work that are being completed each day). When the burndown velocity is paired with the number of hours of work remaining, team members can quickly and easily see whether or not they are on target to complete the work on time.
There is a burndown chart template in the OpenOffice Calc spreadsheet (.ods) format at the website for this book that you can use to create charts for your own project. Go to http://book.prototools.net and look under Chapter 27, “The Agile Mentality.”
OpenOffice is the open source, free alternative to the Microsoft Office suite that was featured in Chapter 11, “Math and Game Balance.” If you have not yet downloaded it, you can acquire it at http://openoffice.org. I’ve found the OpenOffice Calc program to be very comparable to Microsoft Excel, but there are some differences. See Chapter 11 for more information.
Explaining the spreadsheet formulae used in this burndown chart is beyond the scope of this book, but if you have not yet read it, you can learn the basics of spreadsheets and how to use them to balance games from Chapter 11.
Burndown Chart Example
A Burndown Chart Example spreadsheet is available at the website for this book: http://book.prototools.net. This chart is referenced several times on the following pages, so please download it now. For consistency with the images in this chapter, I recommend downloading the version that is available for OpenOffice.
Burndown Chart: Setup Worksheet
Modern spreadsheets are broken into several worksheets, which can be selected by choosing from among the tabs at the bottom of the window (labeled Setup and Data in Figure 27.1). Once you’ve downloaded the Burndown Chart Example spreadsheet and opened it, click the leftmost worksheet tab (labeled Setup).
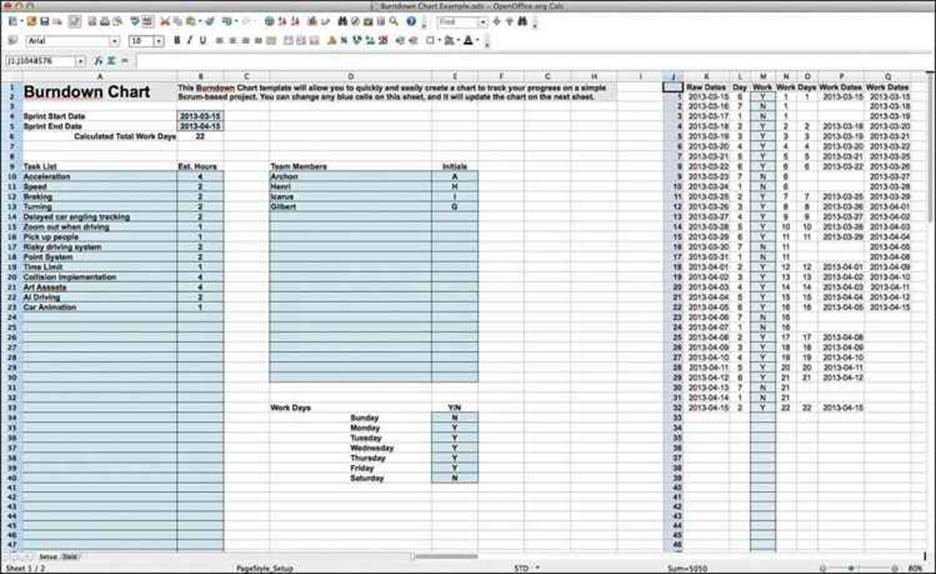
Figure 27.1 The Setup worksheet
This Setup worksheet allows you to input several important pieces of data, all of which should be put into cells with a blue background. At the top left, you can input the start and end dates for your sprint. The example project is set to start one week before today and end 31 calendar days later. Depending on what day of the week it is when you open the example document, that will give the example team between 21 and 23 working days on this sprint (because the example team plans to not work on weekends). In your real sprints, of course, you’ll have fixed start and end dates, but I wanted the example to show you some flexibility.
Below the start and end dates, the total number of working days is calculated, and below that is the task list (also known as the sprint backlog). Here you can see a list of the example tasks for this sprint as well as the number of hours that the team estimated each task would take to complete.
Tip
Estimating Hours One of the toughest tasks for programmers and other creative workers is estimating the number of hours that it will take to finish a task. Things will almost always take longer than you expect, except for that one thing that you expect will take 20 hours but is somehow complete in only 2. For now, you need to just make the best guess that you can while following some simple estimation rules, all based on the fact that as the size of a task increases, the accuracy of your estimate will necessarily decrease. If you estimate that a task will take somewhere between 4 and 8 hours, just round it up to 8.
![]() If you’re estimating in hours, stick to values of 1, 2, 4, or 8 hours.
If you’re estimating in hours, stick to values of 1, 2, 4, or 8 hours.
![]() In days: 1, 2, 3, or 5 days.
In days: 1, 2, 3, or 5 days.
![]() In weeks: 1, 2, 4 or 8 weeks.
In weeks: 1, 2, 4 or 8 weeks.
However, if you’re estimating anything in weeks for a sprint, you need to break it down into much smaller tasks!
To the right of the tasks is a list of the team members on this sprint as well as one- or two-letter identifying initials for them, which will be used to assign them tasks on the next worksheet. Below this are a list of the days of the week and information on whether each day should be considered a work day (Y) or a day off (N).
Off to the right (columns J and beyond), you will see calculations that are done to figure out which days of the month will be work days based on the weekly work days that are selected. If you set cell E39 to N (making Friday a day off), you’ll see that this is instantly reflected to the right, and it will lower the total number of work days that you have between the start and end dates of the sprint (shown in cell B6). You can also set work days directly in column M if, for instance, you have a holiday in the middle of your sprint and need to make a specific Monday a holiday where all the other ones should be work days.
Please set E39 back to Y, and continue to the Data worksheet by clicking the Data worksheet tab at the bottom of the window.
Example Burndown Chart: Data Worksheet
This is where daily progress on all of the tasks from the Setup worksheet is tracked. This spreadsheet can handle up to 100 tasks in the sprint backlog as well as 100 work days in a sprint. An actual sprint should be far shorter than this, as a standard sprint lasts about 2 to 3 weeks. If you’re dealing with a project that won’t fit on this spreadsheet, you should really consider commercial sprint tracking software.
Cell D5, which is highlighted in Figure 27.2, shows the most important element of information provided by this chart. The positive 2.4 there (in white text on a red background) tells us that at the current rate of work, there will be 2.4 hours of work remaining unfinished at the end of the sprint. In your actual work, you want this number to be negative, indicating that the sprint should be done ahead of time.
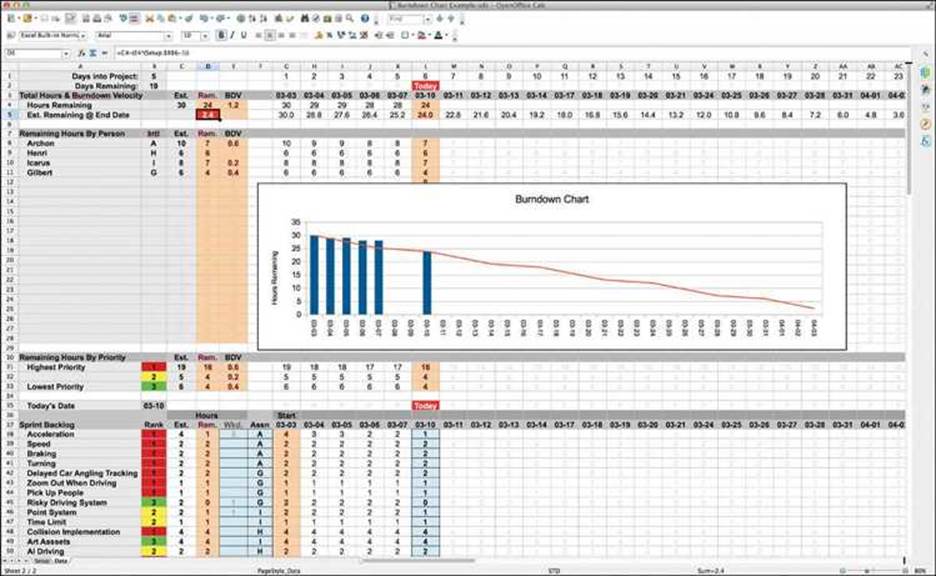
Figure 27.2 The Data worksheet
On this worksheet, as with the last, you want to edit only cells that are highlighted in blue. This includes:
![]() Assn (F38:F138 [the column from cell F38 to cell F138]): This is where you can assign tasks to individuals on your team by entering their initials as defined in the Setup worksheet.
Assn (F38:F138 [the column from cell F38 to cell F138]): This is where you can assign tasks to individuals on your team by entering their initials as defined in the Setup worksheet.
![]() Hours Rem. (L38:L138): This shows the hours remaining in each task as of the current day. As you proceed through the project, the Today label and the blue column will progress to the right. By editing the number of hours remaining on a task in the blue column, you will always be editing the correct day.
Hours Rem. (L38:L138): This shows the hours remaining in each task as of the current day. As you proceed through the project, the Today label and the blue column will progress to the right. By editing the number of hours remaining on a task in the blue column, you will always be editing the correct day.
![]() Hours Wkd. (E38:E138): This optional column allows you to accumulate the number of actual hours worked on a task, though it is just used to provide postmortem project information and is not included in any calculations.
Hours Wkd. (E38:E138): This optional column allows you to accumulate the number of actual hours worked on a task, though it is just used to provide postmortem project information and is not included in any calculations.
Estimated Hours Versus Real Hours
One of the most important concepts in a burndown chart is the difference between estimated hours and real hours. After you have estimated the number of hours for a task, the time you spend working on that task is counted not in actual hours worked but instead in terms of the percent of the task that is complete. For an example, take a look at the Acceleration task in the spreadsheet (see Figure 27.3).
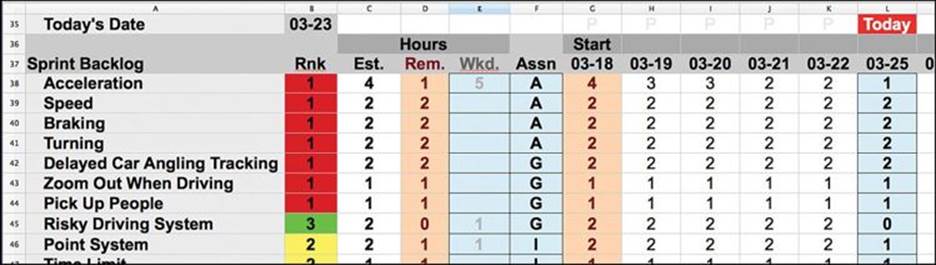
Figure 27.3 Close up of the Data worksheet showing progression of task work for the first 5 days of the project
The initial estimate of hours for the Acceleration task was 4; this comes from the Setup worksheet:
![]() 03-19 (March 19th): Archon (A) worked on Acceleration for 2 hours but only accomplished about 25% of the task. This left 75% of the work remaining on the task, so he entered a 3 into the spreadsheet (cell H38) for 03-19 because 3 is 75% of the original 4-hour estimate. He also placed a 2 into the Wkd. column to track his actual hours worked.
03-19 (March 19th): Archon (A) worked on Acceleration for 2 hours but only accomplished about 25% of the task. This left 75% of the work remaining on the task, so he entered a 3 into the spreadsheet (cell H38) for 03-19 because 3 is 75% of the original 4-hour estimate. He also placed a 2 into the Wkd. column to track his actual hours worked.
![]() 03-21: He worked another 2 hours, bringing the task to 50% complete and leaving 2 hours of the original 4-hour estimate remaining. So, he entered a 2 into the column for 03-21 (J38) and increased the hours in the Wkd. column to 4.
03-21: He worked another 2 hours, bringing the task to 50% complete and leaving 2 hours of the original 4-hour estimate remaining. So, he entered a 2 into the column for 03-21 (J38) and increased the hours in the Wkd. column to 4.
![]() 03-25 (Today): One hour of work burned down another 25% of the task (he’s working a bit faster now), and now, as of today, he has 25% or 1-hour remaining of the Acceleration task. He places a 1 in the 03-25 column (L38) and increases the Wkd. cell to 5.
03-25 (Today): One hour of work burned down another 25% of the task (he’s working a bit faster now), and now, as of today, he has 25% or 1-hour remaining of the Acceleration task. He places a 1 in the 03-25 column (L38) and increases the Wkd. cell to 5.
As you can see, the most important data is the percent of the task remaining as represented by the number of hours remaining of the original estimate. However, Archon has also recorded the 5 hours he has put in on the Acceleration task in the Wkd. column (E) to help him improve his task estimation in the future.
In Figure 27.3, you can also see that Gilbert (G) estimated 2 hours of work for the Risky Driving System yet was able to complete 100% of the task in only 1 hour on 03-25. Icarus (I) has completed 50% of the Point System task in 1 hour as expected (also on 03-25).
Burndown Velocity and the Burndown Chart
The upper part of the Data worksheet shows the actual burndown information (see Figure 27.4).
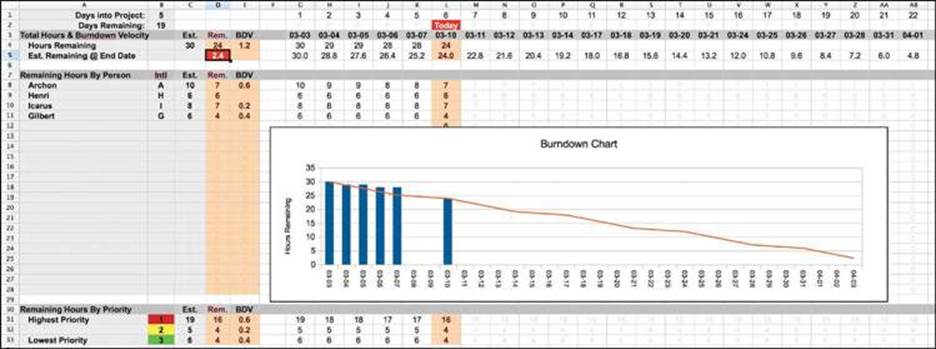
Figure 27.4 Burndown velocity (BDV) and the actual burndown chart in the Data worksheet
Here, Today is shown in orange, and the number of hours remaining on each task is used to determine the burndown velocity (BDV), which is the average rate at which work is accomplished on the project. In cell D4 of the example, you can see that, as of today, 24 hours of work remain of the initial 30-hour estimate for the sprint. Dividing the 6 hours of work completed by the 5 days that this team has spent so far on the project gives a burndown velocity of 1.2 hours/day (shown in cell E4), meaning that each day that the team works on the project, it is expected they will burn down (that is, complete) 1.2 hours of estimated work. If this BDV were maintained across the total 23 workdays of the project, 27.6 hours of work would be completed, leaving a deficit of 2.4 hours remaining (as shown in cell D5). This is a big problem for the team because it means that they will not complete the sprint on time. As mentioned earlier in the chapter, this is the key piece of knowledge that a burndown chart will give you. Your team can quickly see whether they are behind schedule and decide how to intelligently deal with the problem before it’s too late.
This information can also be seen in the burndown chart in the middle of the worksheet. The blue columns represent a daily tally of the number of work hours required to complete the tasks in the sprint, and the red line shows the anticipated progress for future days based on the history of the project so far. The red line and the blue bar will always match up for Today, and for the remainder of the project, the red line will estimate the rate at which work will be done.
Just above the burndown chart, you can also see individual burndown velocity reports for each member of the team based on their individual progress on the tasks that have been assigned to them.
Prioritizing and Assigning Tasks
The Rnk column of the Data worksheet (starting at cell B38) holds task priority information. Tasks are ranked with the numbers 1, 2, or 3, with 1 being the highest rank. This assigns a color (red, yellow, and green, respectively). It also causes the task to be tracked in the Remaining Hours By Priority section of the worksheet (rows 30-33). This section tracks hours remaining and burndown velocity for each rank of tasks. In general, you will want to burn down all of the rank 1 tasks before spending too much time on tasks that are rank 2 or 3.
The Assn column of the Data worksheet (starting at cell F38) holds information about which team member has been assigned to each task. Tasks are assigned using the initials for each person as defined in the Setup worksheet. (The example uses a single letter, but any number of letters can be used for initials.) Once a task has been assigned to a specific person, it contributes to the Remaining Hours By Person section of the Data worksheet (rows 8-28). This way, each team member’s progress can be tracked, and workload can be balanced if one team member has been assigned too much or too little work.
A Potential Burndown Velocity Pitfall
As mentioned before, I have found burndown charts to be invaluable to me in my work over the last several years; however, I have also encountered two specific situations in which the burndown chart can give you somewhat misleading information, as shown in Figure 27.5.
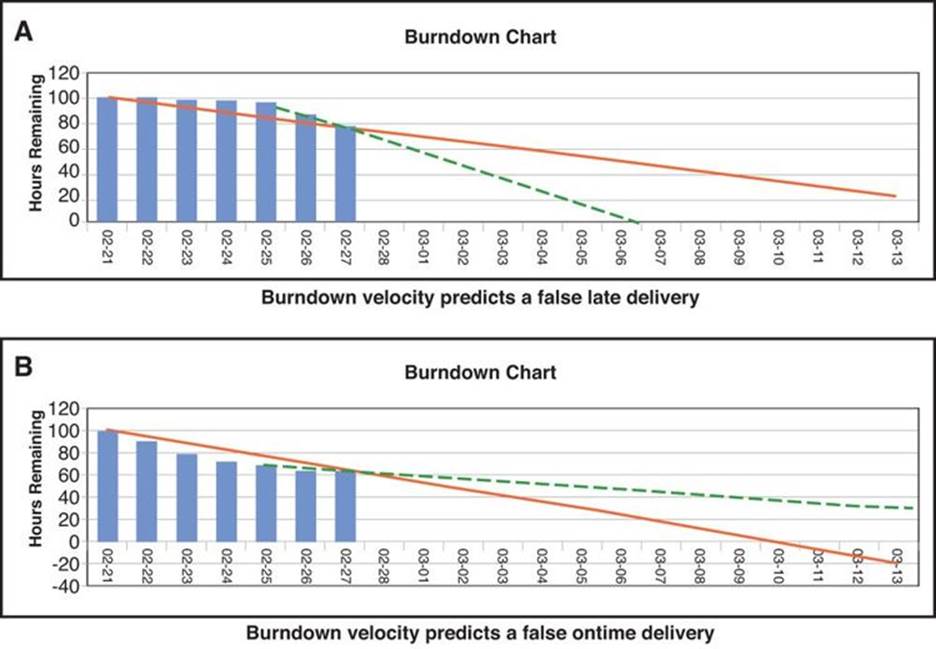
Figure 27.5 Two niche situations where burndown velocity can be misleading
In image A of Figure 27.5, the team initially had a terribly slow burndown velocity (BDV), but over the last three days, they have drastically improved their progress. Because the BDV is calculated based on total work / total time since the beginning of the project, the BDV doesn’t update to show the increased rate at which the team is now working, and so the burndown chart predicts a late finish even though (as the dashed line shows), the team will be early if they continue with the current faster rate of progress.
Image B of Figure 27.5 shows a much more serious issue. In image B, the team was initially working very quickly but has slowed drastically over the last three days. Now, the BDV still reflects the initial work, so it looks like the team is still on schedule to finish on time. However, if they continue their actual shown rate of work over the last three days, the project will be late (as shown by the dashed line)!
Either of these two niche cases will only occur if the work rate of the team changes drastically over the course of the project, but it is important to be aware that they can happen, and you need to consider not only the BDV since the beginning of the project but also the rate of work over the last few days. On most projects with a professional team, these two rates would be very close to each other because the team wouldn’t have drastic changes in productivity.
Creating Your Own Burndown Charts
Now that you’re familiar with the features of the Burndown Chart Example, you can return to the website for this book and download the burndown chart template file to make burndown charts for your own projects:
http://book.prototools.net
Summary
As you move on to designing and developing your own games, it can be very difficult to keep your development process on track. In my years as a developer and professor, I have found that the Agile mindset and Scrum methodology are two of the best tools for doing so. Of course, I can’t tell you for sure whether these tools work as well for you as they have for my students and me, but I strongly encourage you to give them a try. In the end, it’s not important whether Scrum and Agile are the perfect tools for you. The important thing is that you find tools that do work for you and that you use them to help you stay motivated and productive when working on your games.
In the next chapter, the content of this book will make a radical shift. From now on, each chapter is a self-contained tutorial for a game prototype. I do recommend working through them in numeric order because they are meant to build upon one another, but that’s up to you. Each of these tutorials should get you thinking about how a certain genre of game is built and will give you a starting point from which you can build your own games.