MySQL High Availability (2014)
Part II. Monitoring and Managing
Chapter 16. MySQL Enterprise Monitor
Joel clicked open another terminal window and read the output. He rubbed his eyes until his vision cleared. The numbers were beginning to run together as he tried to keep tabs on all of his servers spread out over three sites. His report was overdue.
He had tried using a spreadsheet to tabulate the data, which had worked when he had only a few servers, but it was getting tedious now that he had more than 30 to monitor. His friends had tried to convince him to buy an enterprise monitoring suite, but his boss had a reputation of vetoing any purchases that didn’t immediately contribute to the company’s ability to produce revenue.
“Hey, Joel.”
Joel looked up to see his friend Doug from customer support standing at his door with a stained coffee cup in hand. “Hey,” Joel replied.
“You look like you could use a break.”
“No time. I’ve got to get a report together that shows the status of all of the servers and I can’t write it until I finish checking each server.”
“Wow, that’s a real hands-on approach.”
“I know. I’ve read about these enterprise suites that make this all easier to do, but I don’t know which one to buy or even if Mr. Summerson will sign off on it.”
“Well, if you could show him how much time it takes you to do all this…” Doug said, with a dangerous wave of his mug.
Joel thought for a moment. “If only I could show him the difference between what I’ve had to slog through and what it would be like to use a good tool…”
“Good plan. Now how about a cup? My treat.”
Joel followed Doug to the break room and chatted with him about a recent Dave Matthews Band concert they’d attended.
When Joel returned to his office, he started reading about the MySQL Enterprise Edition offering from Oracle.
Monitoring a group of servers can be a lot of work. The tools needed to properly monitor a server are numerous and while most are easy to use once you understand what they do, they still require a bit of work to get going. Scripting and even some creative web hosting can help manage the execution of the various tools and the collection of the data, but as the number of servers to monitor grows, the task of collecting and analyzing all of the data can become time consuming.
The monitoring techniques discussed so far in this book can become unmanageable for installations with more than a few servers. Indeed, manual monitoring and reporting can turn into a full-time job for one or more technicians in an organization with dozens of servers.
We focus on monitoring in this chapter, but the same can be said about administration. Specifically, administrators often see time savings when they use administration tools that permit automation of common tasks, such as running scripts to populate tables or performing table maintenance.
Fortunately, this problem isn’t new, nor is it insurmountable. Indeed, there are several enterprise monitoring suites that can make life in a sea of servers much easier.
One of the most underestimated tools available for monitoring MySQL is the MySQL Enterprise Monitor (MEM), which comes with the MySQL Enterprise Edition license. The MEM tools can greatly enhance monitoring and preventive maintenance and can dramatically reduce diagnostic time and downtime. While it is a fee-based tool, the savings of having a well-maintained data center will more than cover the cost.
This chapter introduces the MySQL Enterprise Monitor version 3.0 and shows you how they will save you time while keeping your MySQL servers running at the highest levels of performance and availability. We also include an example of the monitoring tools running on a complex replication topology.
Getting Started with MySQL Enterprise Monitor
MEM is one component of the MySQL Enterprise Edition. When you purchase a commercial license for MySQL Enterprise Edition, you get all of the enterprise tools as well.
The MySQL Enterprise Edition was launched in 2006 and comprises the Enterprise MySQL server release, a set of monitoring tools, auditing, backup, and product support services. MySQL Enterprise Edition is intended for customers who use MySQL for data management. Early on, MySQL recognized the need organizations have for stability and reliability. MySQL Enterprise Edition was the answer to this need.
NOTE
If you are not ready to purchase a MySQL Enterprise Edition or you want to try it out for a while before deciding, you can get a trial license and download a copy of the software under a trial license on the Oracle Software Delivery Cloud. If you are an Oracle customer, you can also find MySQL products for download on the Oracle support site.
The following sections describe the available options for purchasing commercial versions of MySQL. We also include an overview of the installation process. Later sections describe the features and benefits in more detail.
Commercial Offerings
MySQL is available for purchase in one of four editions. At the top of the heap is the full featured MySQL Enterprise Edition which includes a host of tools and products designed to help organizations manage large installations of MySQL. You can also purchase commercial licenses of the MySQL server, called the MySQL Standard Edition which provides the MySQL server as well as professional support. For specialized needs, Oracle offers two solutions. The MySQL Cluster Carrier Grade Edition for organizations that require large, redundant, high speed in memory database solutions. The MySQL Classic Edition is configured and licensed for use by ISVs/OEMs.
With so many options to choose from, you can add more support as your business grows. For more information about purchasing licenses for your MySQL servers or if you want to obtain professional support as well as advanced tools such as MEM, contact the Oracle MySQL Sales Team. Visit the MySQL Products and Services site for more information about contacting the sales team either by phone or electronically.
Anatomy of MySQL Enterprise Monitor
MySQL Enterprise Monitor includes a web-based MEM application hosted by its own web server (Tomcat), along with a separate MySQL server instance to be a repository for the metrics collected by other applications installed on your MySQL servers, called agents. MEM combines the metrics into reports that you can enhance with heuristics called advisors that help you enforce best practices based on MySQL research and expertise. The reports are displayed on a web page called a dashboard. We’ll discuss later in this chapter how to install and use these components.
Thus, MEM is made up of two components. The web server and MySQL server instance is called the MEM Service Manager (sometimes referred to as the MySQL Enterprise Monitor or simply monitor). The component you install on the MySQL server to monitor the MySQL instances and collect data is called the MEM Agent (or simply MySQL Agent). Although not part of MEM specifically (but is a prerequisite) is one or more MySQL server instances. A pictorial representation of these components and the flow of information is shown in Figure 16-1. We discuss each of these components in more detail in a later section.
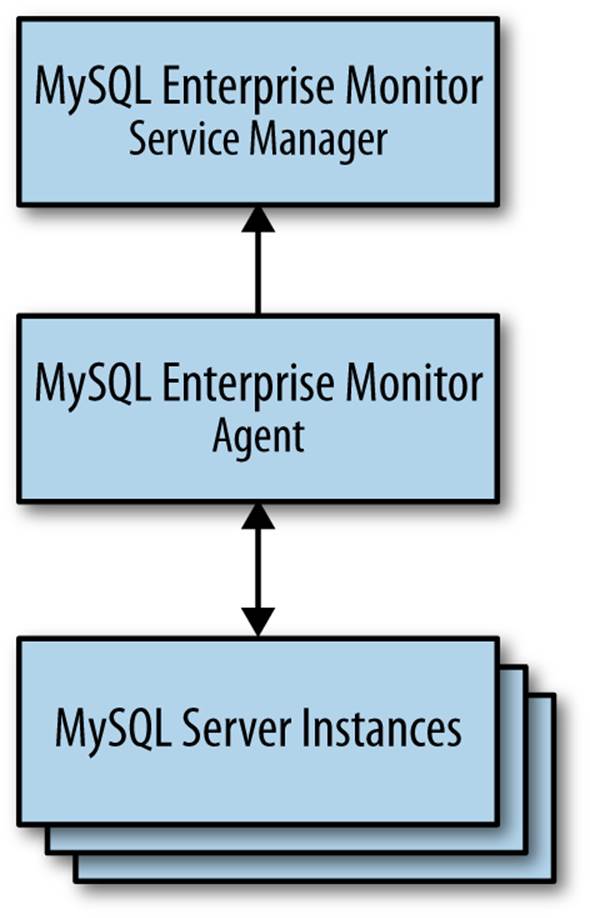
Figure 16-1. Anatomy of MySQL Enterprise Monitor
Now that we understand the components of MEM, let’s see how we can install the components and get MEM running.
Installation Overview
While complete, detailed installation instructions are beyond the scope of this book, we briefly describe the steps necessary to install and configure the MySQL Enterprise Monitor. Fortunately, the install process is streamlined and very easy.
For example, if you’re doing a new installation, the basic steps include the following:
1. Download, install and launch the Service Manager. To install the MySQL Enterprise Monitor Service Manager component, including the metrics repository (a separate installation of MySQL), which is operating system–specific. For example, you would install the file namedmysqlmonitor-3.0.0.2887-osx-installer.app on a Mac OS X system.
2. Open the service manager using your browser (starts automatically for a new install) and configure your system using the first-time setup screen. You can also access the dashboard at http://localhost:18443.
3. Install the monitoring agent on your MySQL servers. This is also operating system–specific. For example, on Linux systems you would install an agent such as mysqlmonitoragent-3.0.0.2887-linux-glibc2.3-x86-64bit-installer.bin.
4. Configure the dashboard to reflect your environment. You can group servers and give each server a more descriptive name.
TIP
You can find additional information about installing MEM in the online MEM reference manual.
Installing the MEM Service Manager
The installation of the MEM Service Manager component includes a self-contained web server and MySQL instance that you install on the system where you want to host the Dashboard and metrics collection. This system is the destination for the data from each of the monitoring agents. This process is very easy to perform and does not require any web administration expertise.
During the installation of the service manager component, you will have to make decisions about the names of certain accounts and the location (e.g., IP address) of your server. You will need this information when installing the monitoring agents. The Getting Started chapter in the online MEM reference manual discusses all of these items. It may be helpful to print out the guide and use it to write down the information you supply during the installation for later reference.
Installing the MEM Agent
Installation of the monitoring agents is also very easy. Once your monitoring server is up and running, you can install one agent on each of your servers where your MySQL server instances reside. Some systems may require manually starting the agent, which is explained in detail in the guide.
While it is possible to install the monitor agent on any server and monitor MySQL instances running on other servers, it is best to install the agent on the server with the MySQL instances you wish to monitor. This permits the agent to send operating system statistics, performance data, and configuration parameters to the Dashboard. If you install the agent on another system, the system section of the Dashboard report for the MySQL server will be blank.
You can use your existing MySQL server installations, but for the best return on your investment, you should be using the versions provided by your MySQL Enterprise Edition license purchase. Once your database servers are configured and running properly, you can begin the installation of the Enterprise Monitor and monitoring agents.
You should begin by installing the MEM service on a machine on your network that has connectivity to all of the servers you want to monitor (we recommend always using MEM to monitor your MySQL servers). During the installation process, be sure to write down the hostname or IP address of this server and the username and password you specified for the agent access. The installation process is very easy and is well documented on the MySQL Enterprise Edition documentation site.
NOTE
Several user accounts are involved in the installation of MEM: a MEM administrator account, an agent access account to your MEM server, and two agent access accounts for the monitoring agent running on each MySQL server. Getting these confused can lead to a failed installation.
Once the MEM service is up and running on your monitoring server, you can begin installing the monitoring agent on each of your MySQL servers. When you install the monitoring agent, you will need to provide a user account and password for a connection from the monitoring agent to your MySQL server. It is best to use the same username and password for all of your servers. Like the MEM services installation, installing the monitoring agent is very easy. Just be sure to record all of the user accounts and passwords used. Once again, you should use the same accounts and passwords for all of your monitoring agents. Once installation is complete, the server should show up in the MEM within a few moments depending on your refresh settings.
Repeat the installation on each of your servers and observe the results in the Dashboard. Figure 16-2 shows the Dashboard for the example information infrastructure with all monitoring agents reporting. You will see several graphs and sections in the interface. These include database availability, connection status to each server, aggregate database activity, query response times, and a list of critical issues identified among the servers.
Fixing monitoring agent problems
Although the installation process for the monitoring agent is very streamlined, there are times when things can go wrong. If you are careful to supply the correct information, everything should work correctly.
The following are some basic procedures for diagnosing and correcting problems in getting the monitoring agent to report to the MEM:
§ Check the mysql-monitor-agent.log file if your monitoring agent starts but the server is not shown on the Dashboard, or if the agent or service status indicates an error (a red dot) in the heat chart. This file contains a wealth of information that can help you solve most problems. You can find the logfiles in the following locations:
Mac OS X
/Applications/mysql/enterprise/agent/
Linux/Unix
/opt/mysql/enterprise/agent
Windows
C:\Program Files\MySQL\Enterprise\Agent
§ Check the user account and permissions specified for the monitoring agent on the MySQL server.
§ Verify the port and hostname of your local MySQL server. Be sure the information matches what is in the \etc\bootstrap.profile file.
If you feel you have used the wrong usernames and passwords, you can use the \bin\agent.sh script to change any of the parameters for the agent. The following shows the commands available (see the online MEM reference manual for more details):
$ ./agent.sh --help
Usage: java com.mysql.etools.agent.runtime.Main [options], where options are:
Option Description
------ -----------
-D, --agent-instance-dir Path to the directory that contains
per agent instance configuration and
runtime data. Only used for multiple
agent instances running from the
same base directory.
-G, --agent-group MEM Group to use for all MySQL
connections from this agent
-I, --uuid MEM Agent UUID
-M, --migrate-agent Migrate agent connections
-P, --port Port for the MySQL instance (Actions:
Create, Modify)
-S, --socket Socket for the MySQL instance
(Actions: Create, Modify)
-T, --test-credentials Test MySQL connection credentials
-U, --url MEM Service Manager URL
-c, --create-connection Create or Modify a MySQL connection
-d, --delete-connection Close and Delete a MySQL connection
(must also specify --connection-id)
-f, --force-plain-stdin Force the use of plain standard input
(clear password input)
-g, --connection-group MEM Group to use for created/modified
connection (Actions: Create, Modify)
-h, --host Host for the MySQL instance (Actions:
Create, Modify)
--help Prints this usage message
-i, --connection-id Connection ID (Actions: Modify, Delete)
-j, --admin-user Admin level username (Actions: Create,
Modify)
-k, --general-user General level username (Actions:
Create, Modify)
-l, --limited-user Limited level username (Actions:
Create, Modify)
-m, --auto-manage-extra-users Auto-create general / limited users
(Actions: Create, Modify)
-s, --show Show information about all MySQL
connections on this agent
-t, --run-collection-tests Discover, and attempt to collect OS
related assets and dump them to
STDOUT (for debugging)
-u, --agent-user MEM Service Manager agent username
-v, --version Displays the version of the agent and
components
Configuring the dashboard
After at least one agent is installed and started, you can return to the Dashboard and start configuring it to fit your needs. For example, you can create groups to organize your servers into logical units. For instance, you may want to define some servers as production servers and others as development servers.
You can rename the servers using the Manage Servers option on the Settings page. This allows you to use more meaningful names on the Dashboard while leaving the actual hostnames of the servers unaltered. You can also create groups to combine related servers. This can be very handy, because the group is displayed on the various controls, allowing you to collapse the group and alter the display as needed.
MySQL Enterprise Monitor Components
The MEM forms the core of the continuous server monitoring and alerts. The MySQL website states it best: “It’s like having a ‘Virtual DBA Assistant’ at your side to recommend best practices to eliminate security vulnerabilities, improve replication, optimize performance and more.” Despite the marketing angle, the MEM gives you professional-level tools to meet the growing needs of your business’s data center.
The MEM includes the following key features:
§ A single web-based display to monitor the health of all of your servers
§ Over 600 metrics, including the MySQL server and its host operating system
§ The ability to monitor performance, replication, schema, and security
§ The ability to monitor operating system statistics of the servers where the agent is installed
§ Immediate health status via an easy-to-read heat chart
§ Notification of metric threshold violations
§ Implementation of the best practices ruleset from the creators of MySQL
§ Compliance with all of the latest features of the MySQL including UUIDs, GTIDs, and more
§ Automatic adaptive measures to detect changes to servers such as replication roles, detecting new server instances, and more.
§ Detection and ranking of the most critical issues on each server
§ Trends, projections, and forecasting features added to all graphs and events to help identify potential problems
§ The 3.0 version introduces many changes to the user interfaces for the Dashboard making it even easier to monitor your servers
Recall that MEM is composed of a distributed web-based application that you run on your internal network. A monitoring agent is installed on each MySQL server that sends metrics to the web server component, called the Dashboard. It is here that you can see all of the statistics and graphs that depict the status of your servers. There are also advisors that implement the best practices for ensuring your installations are properly configured and running at peak efficiency.
Dashboard
The face of the MySQL Enterprise Monitoring tools is the Dashboard, the web application running on your monitoring server. The Dashboard provides a single location where you can monitor all of your servers, either individually or in groups. You can see the availability, security, and performance data for all of your servers in one place. You can check the relative health of each, examine graphs of performance and memory use, and see vital operating system statistics for each server.
The Dashboard presents monitoring and alert information to you in an easy-to-read format. An example of a simple installation is shown in Figure 16-2. As you can see, the Dashboard provides all of the critical information on a single screen. There are tabs for various dashboard views (overview graphs, MySQL instances, and replication), events, the Query Analyzer, reports and graphs, and configuration settings. The “What’s New?” tab contains links to news and events concerning the tools and your Enterprise licenses and products.
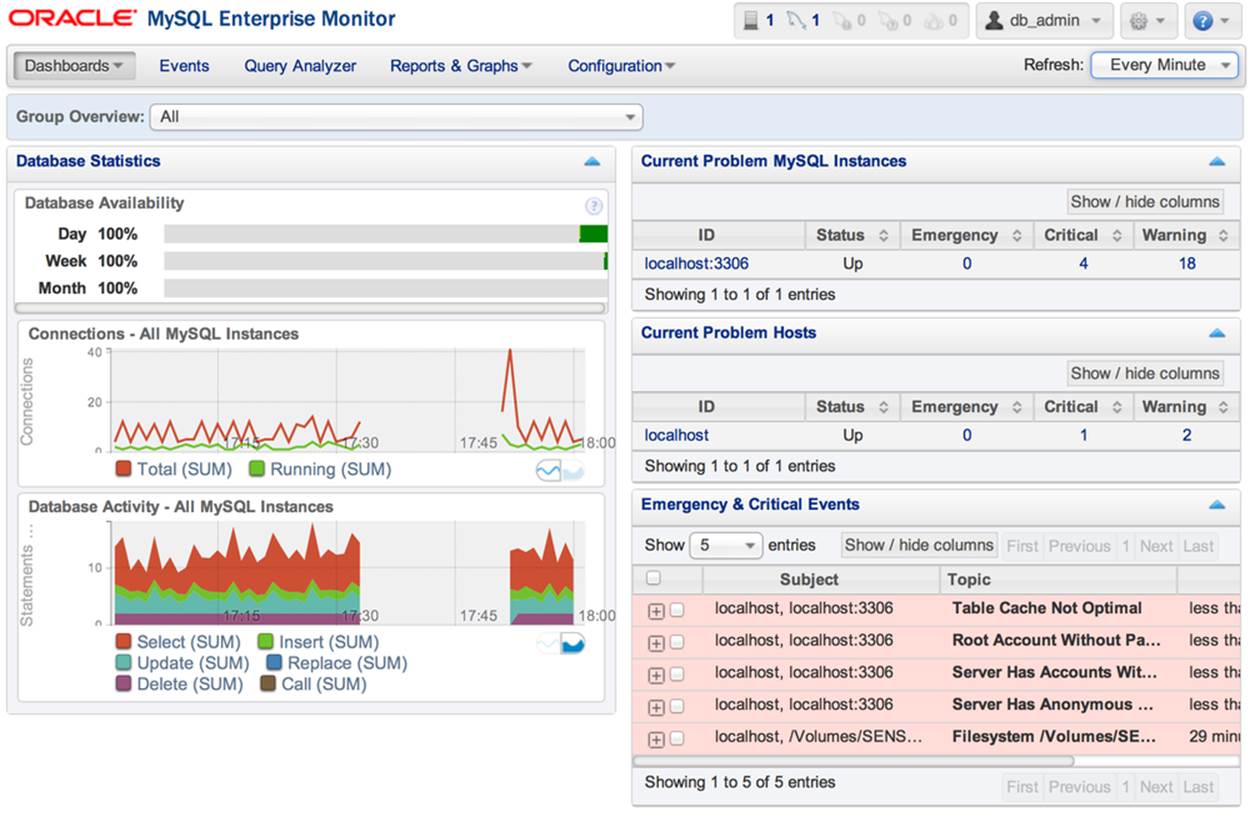
Figure 16-2. The MySQL Enterprise Monitor Dashboard
Notice the “Emergency & Critical Events” secton in the lower right of the page. This area shows you all of the critical issues detected for each server. In this case, we have purposely included servers with some issues to demonstrate the power of the automatic critical issue detection. However, it should be noted that these servers are development servers and not used for production. Had it been a production server, the issues identified would be most serious. Nevertheless, MEM treats all servers with the highest level of expectations and scrutiny. Here we see that MEM has detected several critical problems that need to be addressed.
Among these issues are a suboptimal setting for the table cache, several issues with user accounts, and a prediction about disk space. Let’s look at one of the account issues. If you click on the alter, you will see a detailed explanation of the problem along with how to correct the problem, as shown in Figure 16-3.
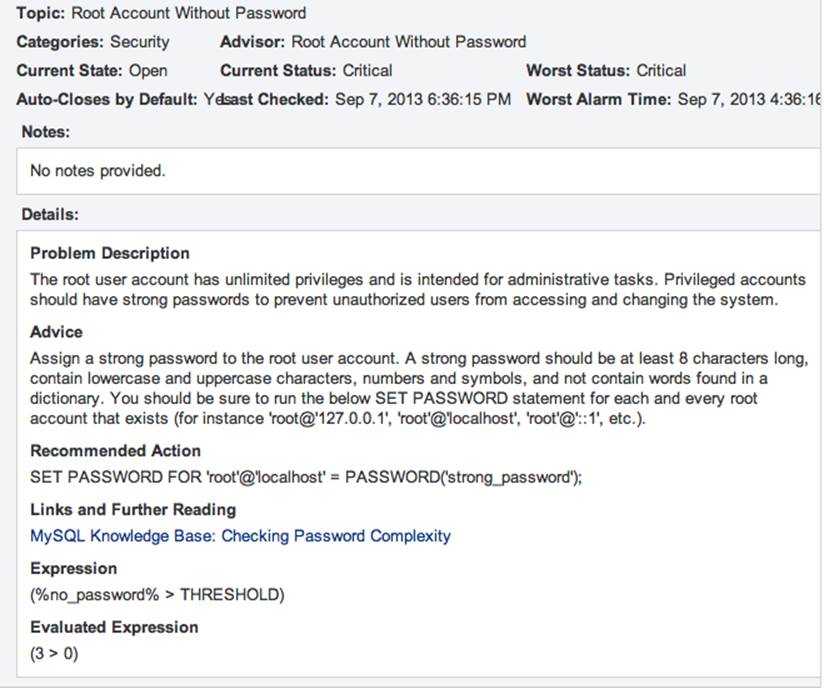
Figure 16-3. The MySQL Enterprise Monitor Dashboard
As you can see from the explanation, there exists at least one account named “root” without a password. A quick query on the server reveals this to be true and the recommended actions most prudent. Clearly, this is something that must be fixed to ensure stronger security.
mysql> SELECT user, host, password FROM mysql.user WHERE user = 'root';
+------+----------------------------+-------------------------------------------+
| user | host | password |
+------+----------------------------+-------------------------------------------+
| root | localhost | *[...] |
| root | 127.0.0.1 | |
| root | ::1 | |
| root | 192.168.1.15 | *[...] |
| root | 192.168.1.102 | *[...] |
| root | % | *[...] |
+------+----------------------------+-------------------------------------------+
6 rows in set (0.00 sec)
NOTE
We have masked out the passwords in the previous ouput. An actual query would show the digest value for the password column.
As each critical issue is corrected and the interface refreshed, the issue is removed from the list. You can also clear the issues if you feel they are not applicable. For example, you may have a development or test server that is configured intentionally to have issues for use in testing. You can also add your own notes about the conditions for future reference. In this way, you can quickly see those servers in your network that needs attention.
Monitoring Agent
The monitoring agent is a special lightweight application that gathers information about a MySQL server, including statistics about the host operating system. The monitoring agent is therefore the key component in the monitoring tools. Designed to be installed on each server you want to monitor, the agent is not only lightweight, but almost transparent, with no noticeable performance degradation.
Advisors
The MEM tools include one feature that departs from typical enterprise monitoring solutions: a mechanism that monitors specific areas of system performance and configuration and sends alerts when a server diverges from the best practices defined by the designers of MySQL. This means you can get immediate feedback on anything that can cause your system to become suboptimal in configuration, security, or performance. This mechanism is called an advisor, and there are many of them monitoring and reporting on a wide variety of areas. The advisors supplied are extensive:
Administration
Monitors general database administration and performance.
Agent
Checks the status of the agents installed on your network.
Availability
Monitor MySQL connections and process health.
Backup
Checks status of backup jobs, resources, and tasks for MySQL Enterprise Backup.
Cluster
Advisors for the MySQL Cluster product.
Graphing
Identifies issues for the graphing elements.
Memory Usage
Identifies changes in memory usage and sends alerts when suboptimal conditions arise.
Monitoring and Support Services
Advisors for the MEM services themselves. Yes, it even advises you on how to make it better!
Operating System
Identifies potential problems about the operating system of the hosts for the MySQL servers.
Performance
Identifies differences in performance based on MySQL performance best practice rules.
Query Analysis
Identifies issues related to the Query Analyzer.
Replication
Identifies replication-specific conditions related to configuration, health, synchronization (delays), and performance issues.
Schema
Identifies changes to database and schema objects. Can monitor changes and provide alerts when unwanted or unexpected changes occur.
Security
Identifies potential security vulnerabilities and sends alerts.
Each advisor provides comprehensive coverage of a specific area of the server using a set of rules based on best practices. The advisors help you identify where your servers need attention and give you advice on how to improve or correct the situation. If the set of advisors isn’t broad enough, you can create your own advisors to meet your needs.
Query Analyzer
Complex databases and the complex applications that they tend to support can result in the execution of complex queries. Given the expressiveness of SQL, queries are often not written to execute as efficiently as possible. Furthermore, poorly written queries can often be the source of poor performance on other levels. Savvy DBAs acknowledge this and often look to the queries first for database performance diagnostics.
You can normally find a poorly performing query by watching the slow query log or the process list (i.e., issuing a SHOW PROCESSLIST command). Once you have identified a query that needs your attention, you can use the EXPLAIN command to see how MySQL will execute the query. Although this process is well known and has been used by DBAs for some time, it is a labor-intensive task that does not easily lend itself to scripting. As the complexity of the database grows, so too does the labor involved in diagnosing poorly performing queries.
You can examine user queries with this method, but what do you do when investigating application performance where the SQL statements are included in the application code itself? This situation is among the hardest to diagnose and repair, as it requires changing the application. Assuming that is possible, how do you advise the developers to improve their queries?
Unfortunately, the SQL statements in the application code are rarely suspected of being the source of performance problems. DBAs and developers are all too quick to blame the server or system instead of application code or embedded SQL queries. Worse still, the MySQL system does not support robust performance metric collection and there is little support for finding troublesome queries.
As a partial solution to these difficulties, you may find it useful to pull up a list of all of the long-running queries on your server and examine the slowest ones. The Query Analyzer component of the Enterprise Monitor tools provides this help.
You can enable the Query Analyzer via the Dashboard. Installation and configuration require a little work, so be sure to consult the Getting Started guide for details.
The Query Analyzer provides an aggregate display showing performance statistics for queries in real time. It shows all of your queries from all of your servers in one place so you don’t need to go from server to server looking for poorly performing queries. This same list maintains a history of the queries so you don’t have to worry about the additional space for logs.
You can get two different views for each query: a canonical view (no numeric data) to see a pictorial version of the query, and a version that shows specific timing and access data for the query. Best of all, the advisor can even alert you when a given query was executed and on which server.
The Query Analyzer allows you to see which queries are performing poorly and to identify a solution by examining the suspected query’s execution plan. Clearly, this feature alone can provide huge time savings, especially for situations in which you are developing or tuning an application for deployment or need to optimize your queries for improved performance.
MySQL Production Support
The MySQL Enterprise Edition license includes access to support professionals who can help you with development, deployment, and management of your MySQL servers. Support includes problem resolution, consulting, access to an online knowledge base of common solutions, and a technical account manager who will be your point of contact, helping you with all of your support needs.
NOTE
Depending on how you purchased the MySQL Enterprise Edition, consultation and extended assistance may incur additional costs.
Using MySQL Enterprise Monitor
Now that we have described the features of MEM and its components, let’s take a look at an example of how the tools can truly benefit an organization. In this example, we use a hypothetical—albeit not uncommon—information infrastructure for a web-based company. This example is representative of the types of replication models seen in industry. It includes a complex multiple-tier replication setup that replicates some databases but not others.
This scenario, shown in Figure 16-4, consists of two data centers connected via replication for high availability and load balancing. These data centers host the company’s databases. The production data center in San Francisco is used for hosting their day-to-day operations. Connected to this master server is a slave for the development departments located in Seattle and responsible for building and enhancing the product lines.
Each of the slaves beneath the data centers can (and typically do) host additional databases that are not replicated. For example, the production server typically hosts a human resources database that is not replicated to most of its slaves (e.g., it is not replicated to the development center). Similarly, the development server has various incarnations of the product line databases in various states of development.
A topology such as this can be visualized easily with the MySQL Enterprise Monitor Dashboard. Figure 16-5 shows how the example topology would look in the dashboard.
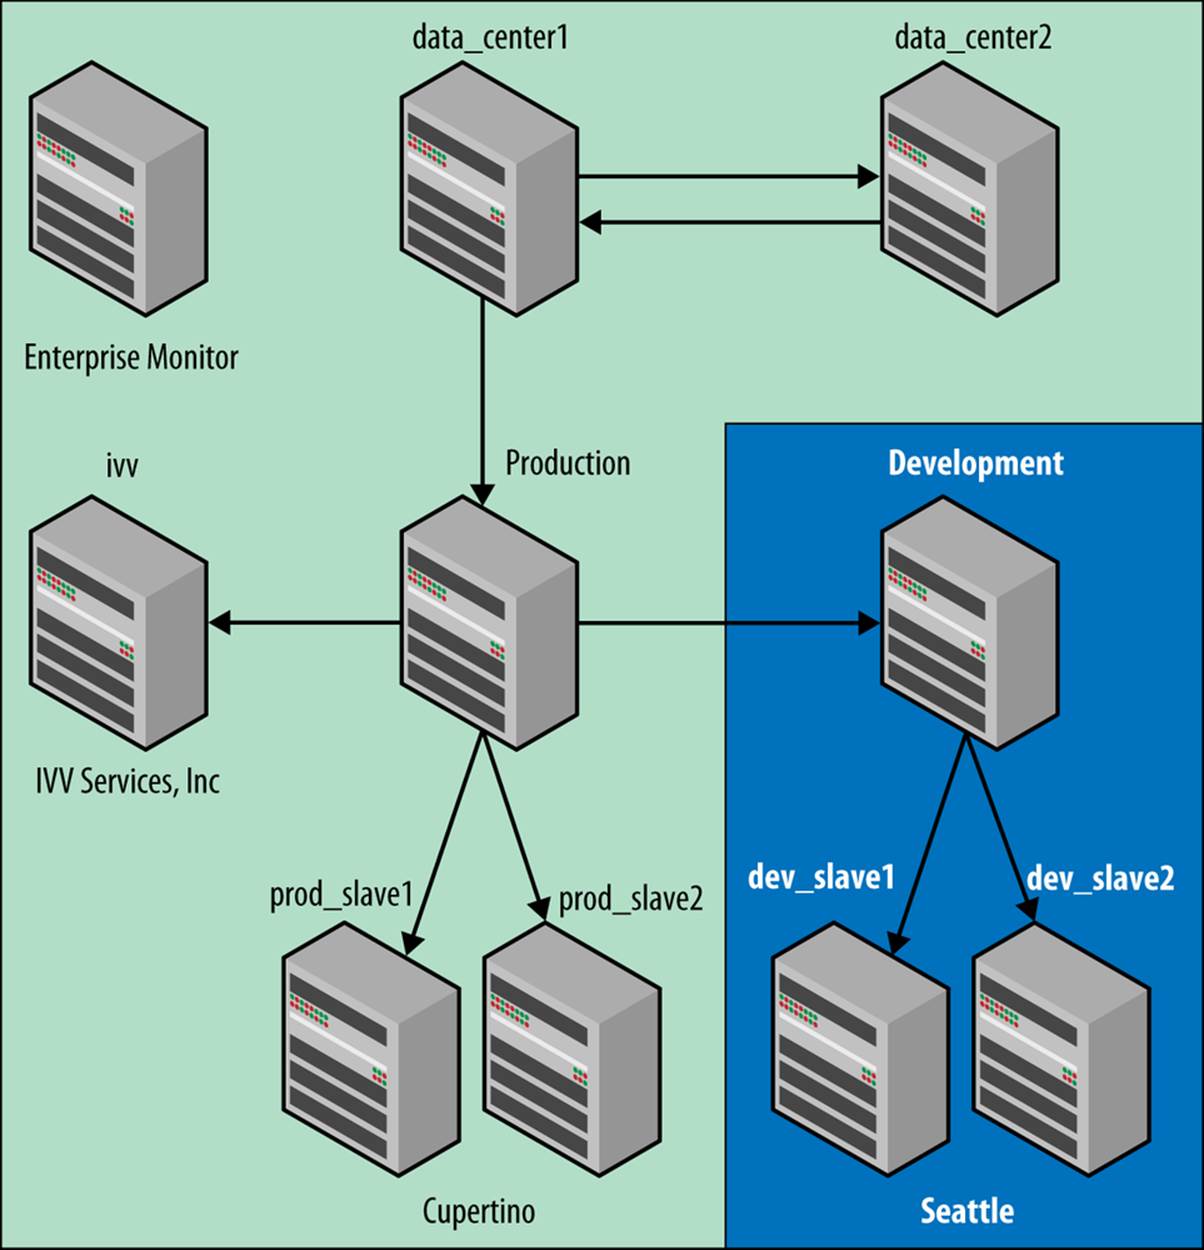
Figure 16-4. Sample information infrastructure
The topology of servers displayed in the following images is a basic replication setup with a single master and few slaves at each site. The master in the satellite office (Seattle) is connected as a slave to the master in the main office (San Francisco). The servers have not been configured in an optimal state to demonstrate the features and power of MEM to identify sub optimal configurations and critical issues.
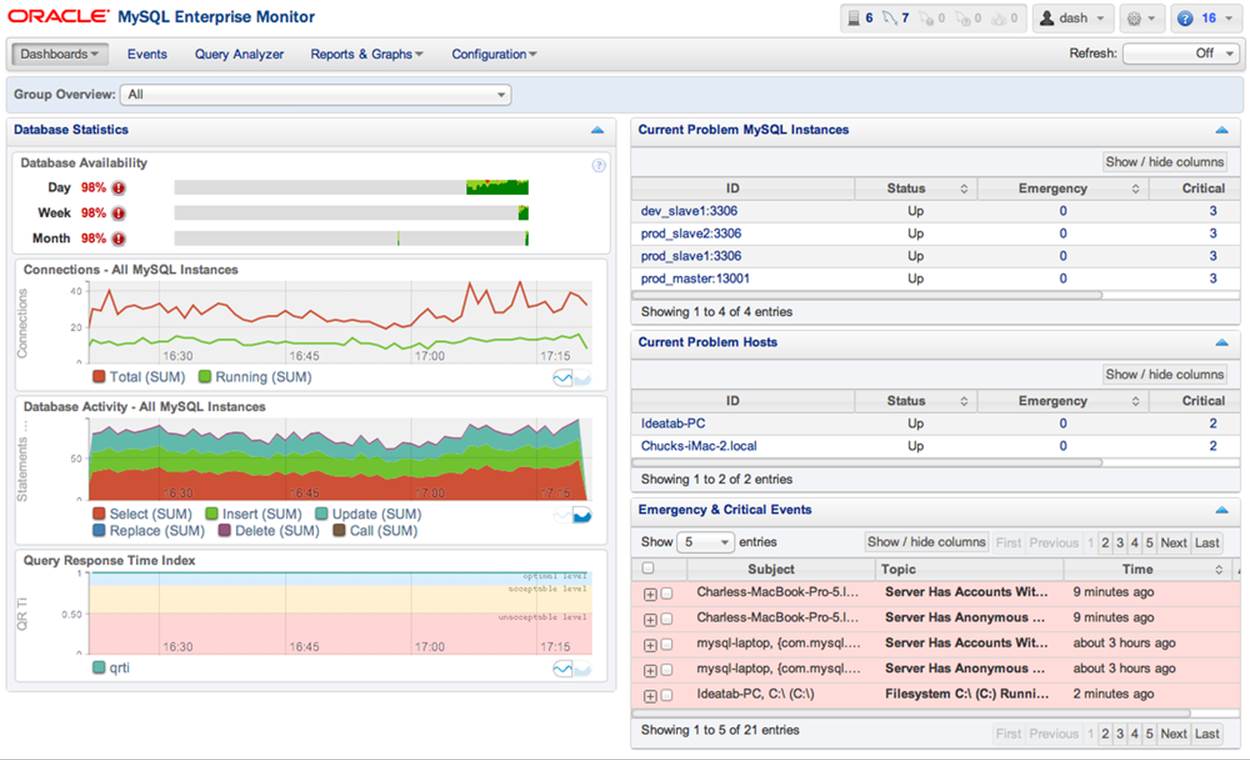
Figure 16-5. Dashboard
This is the default display mode for the dashboard. As we can see, each of the servers is reporting its availability, categorical database activity, query response times, and a long list of potential issues. There are additional views available in the dashboard that include a view of the servers participating in replication topologies and a detailed list of all MySQL servers monitored. We will see examples of these views in later sections.
As you can surmise, this page presents all of the pertinent information about your servers so that you can, at a glance, see the overall health of your information infrastructure, including all potential and critical issues identified by the monitoring agents. Clearly, monitoring can’t get any easier than that!
Monitoring
There are several areas in which MEM makes monitoring much easier for the administrators of a complex infrastructure. These areas include:
§ Critical issues details
§ Consolidated server graphs
§ Server details
§ Replication details
§ Advisors
We will examine each of these in greater detail in the following sections.
Critical issues details
The best thing about the critical issues list, which may not be obvious, is that you can click on any one of the entries to get more information. For example, if you click on one of the servers in the Current Problem Hosts, you will see a list of all of the alerts for that system, as shown inFigure 16-6. You can then click one of the most recent alerts and get a detailed report like the one shown in Figure 16-7.
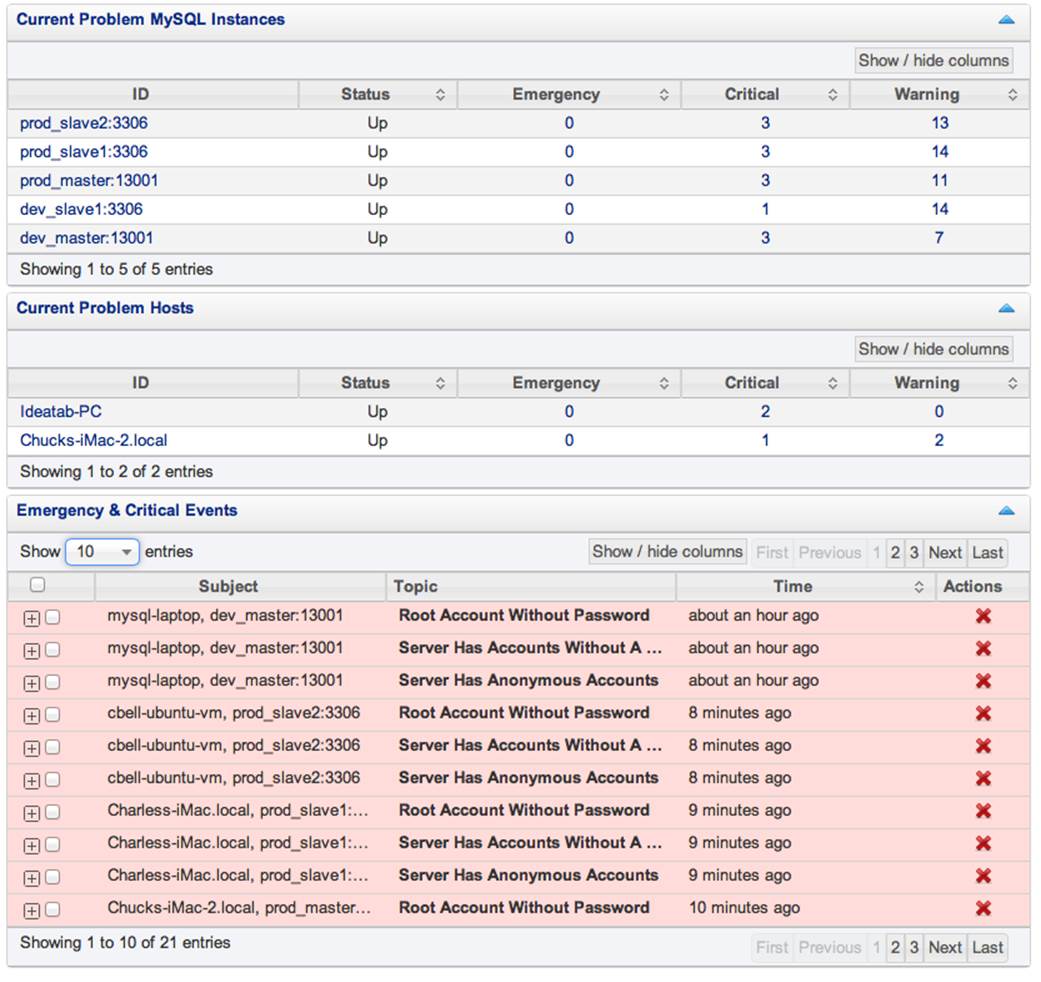
Figure 16-6. Sample alerts list
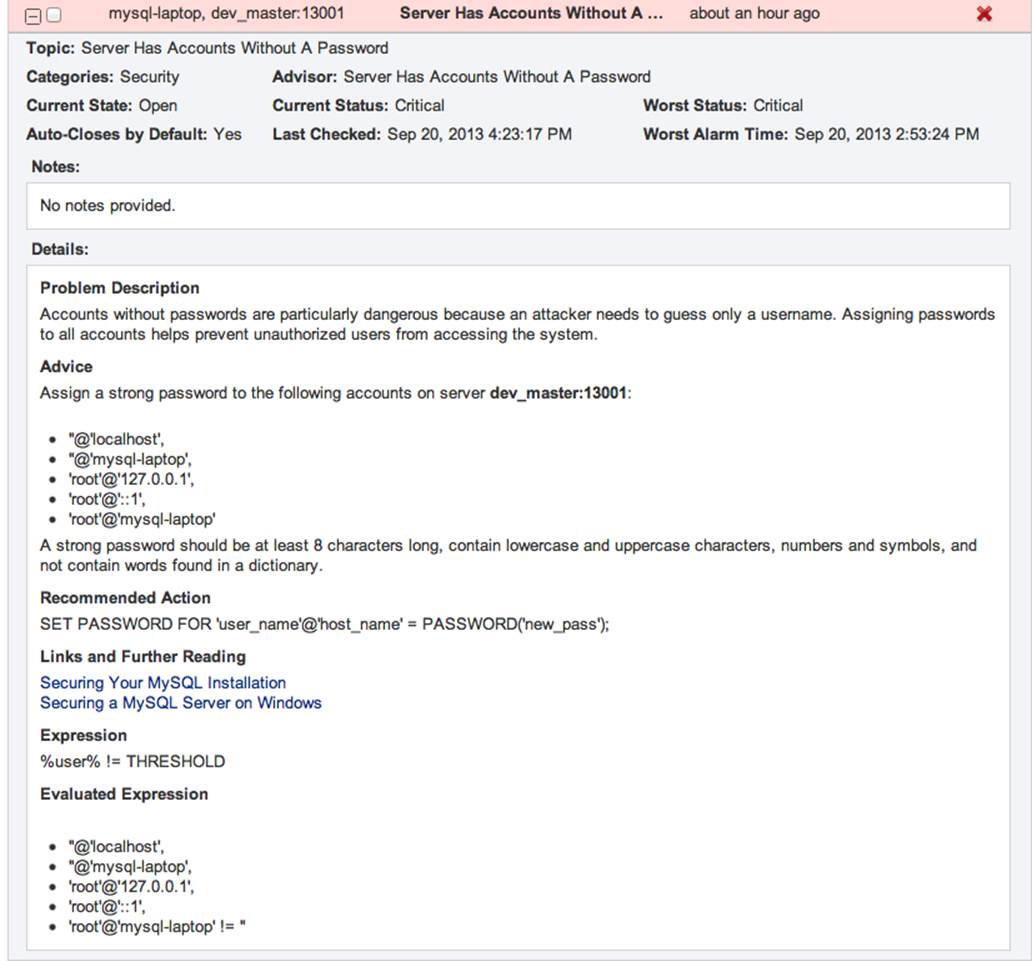
Figure 16-7. Sample alert report
This report indicates the server on which the alert occurred, the time it occurred, and advice following the established best practices including any pertinent links to documentation. The alert reports make the MEM stand alone among the monitoring options. This is what is meant by having a “virtual DBA assistant.” The alerts will make your life much easier by trapping the problems from servers all over your organization and reporting them in a single place. This saves you the time and tedium of costly diagnostic efforts or active monitoring and gives you tips on how to solveproblems quickly.
Consolidated server graphs
At the left of the Dashboard display is a consolidated set of graphs that show aggregate data from the servers being monitored (Figure 16-8), including database activity, connection status of all servers, and query response times.
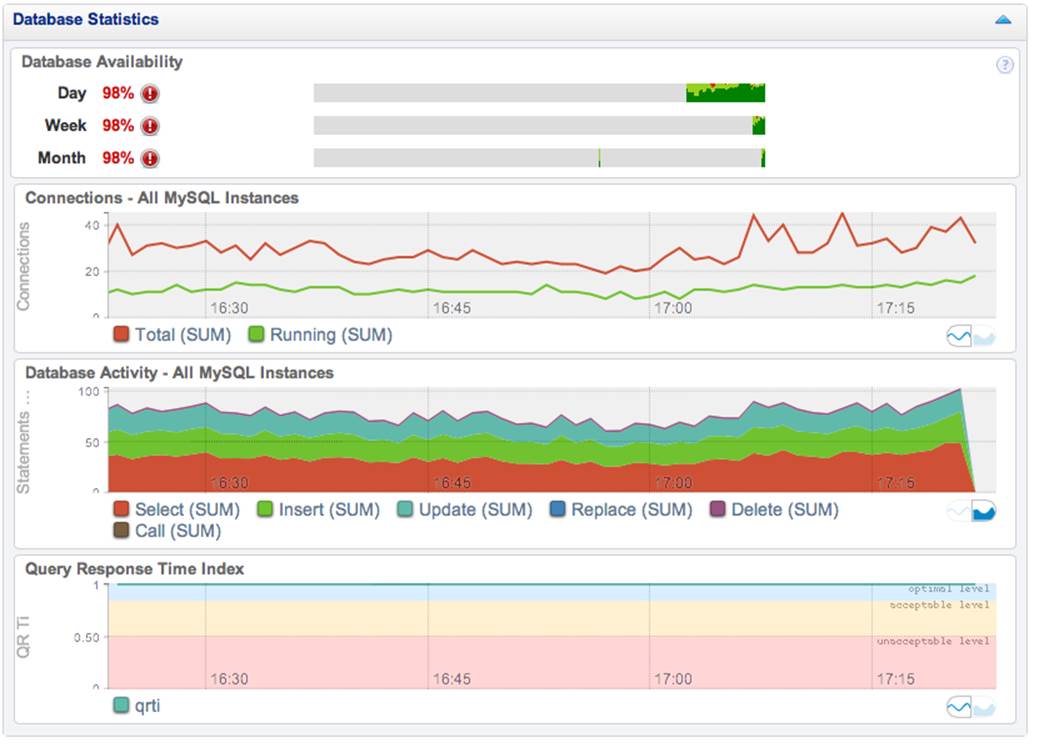
Figure 16-8. Sample consolidated server graphs
The database activity graph shows statistics concerning availability. Like all of the graphs, the data is aggregated from all servers monitored.
The connections graph shows the connection times for all of the servers monitored over time.
The database activity shows you a relative count of the most frequent queries based on category.
The query response time shows the average response time of queries executed.
TIP
You can see many more reports including reports for specific metrics from the Reports and Graphs tab.
Server details
Another nice feature of the Dashboard is that it lets you click on a specific server in the list of servers to see more details about the system. The server details report shows the version of the MySQL server; when it was last started (uptime); where the data is located; the host operating system; and CPU, memory size, disk space, and network information.
You can use this information for inventory purposes (determining what hardware is on your network) as well as for a quick look at what operating system is running to give you a clue about how to fix a problem. For example, you can remotely log into a server to fix something and know its hostname, IP address, MySQL version, and most importantly, the host operating system before you log in—all critical information that most administrators memorize or write down in a notebook. Figure 16-9 shows an excerpt of the server details portion of the Dashboard.
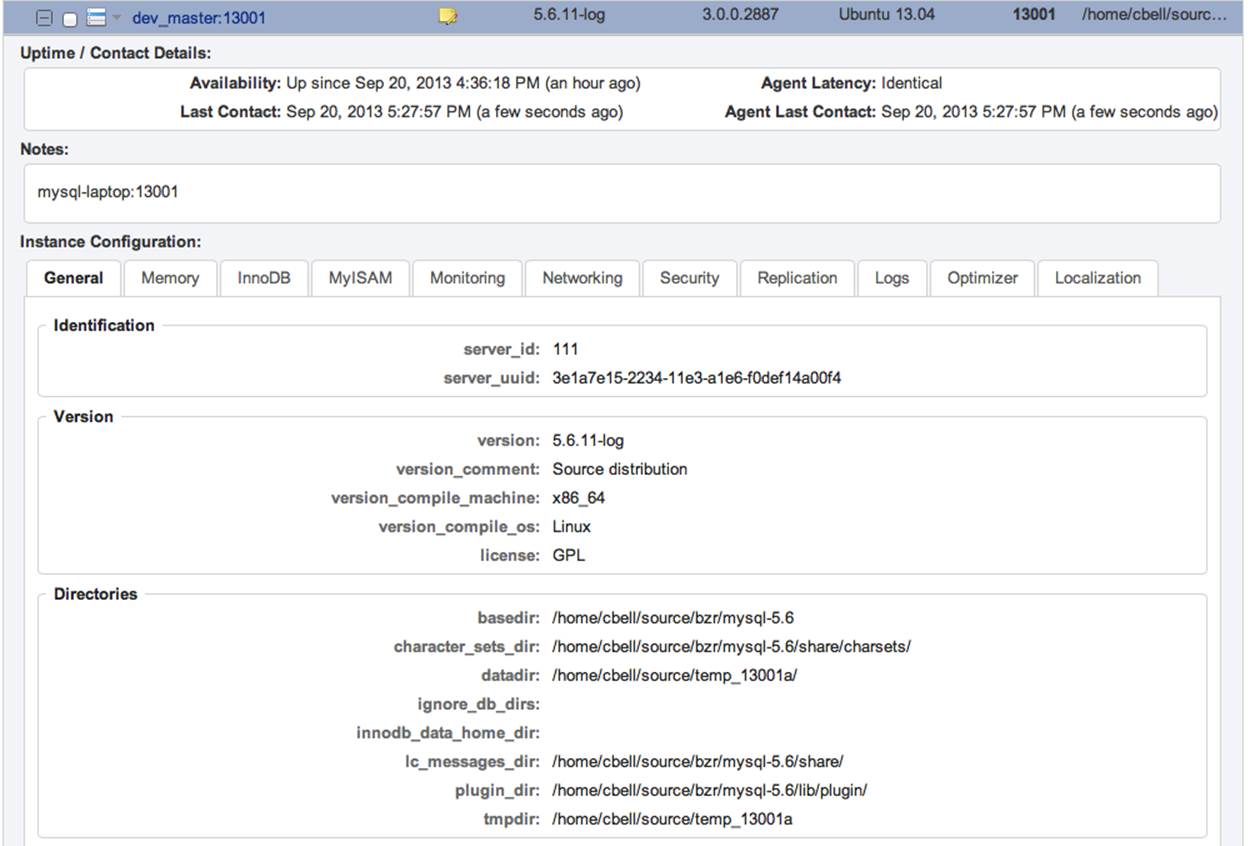
Figure 16-9. Server details
Replication details
The Replication tab of the Dashboard includes a list of all of your servers participating in replication. The information is presented in a list form and, like all lists in MEM, you can click on each item to get more information. Figure 16-10 shows a sample replication details report.
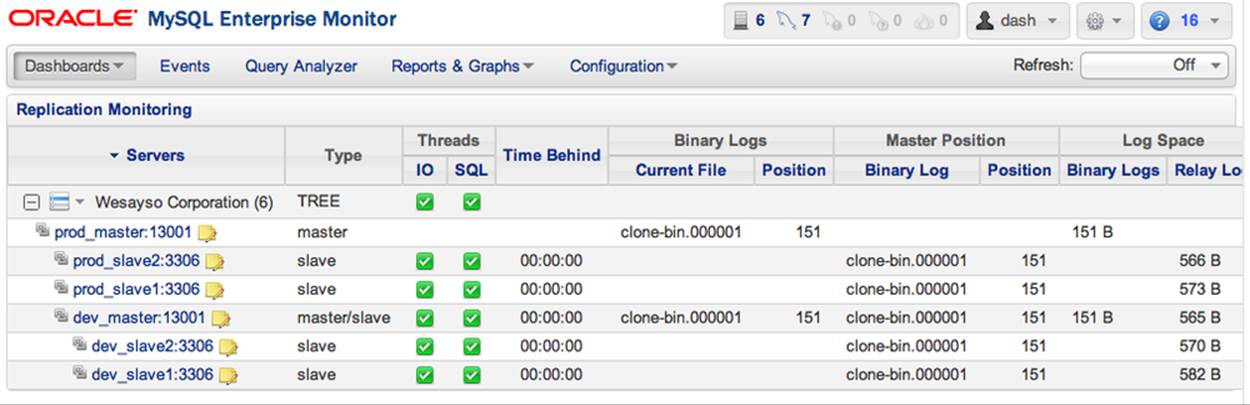
Figure 16-10. Replication details
Notice that items in the list are grouped by topology (e.g., “Wesayso Corporation,” which you can rename), including the type of topology, what role(s) the server is performing, and critical statistics about replication, including status of the threads, time behind master, current binary log, log position, master log information, and the most recent errors.
This is an excellent example of how you can get a quick picture of your replication topology. The list shows the masters and slaves grouped hierarchically (i.e., a master is listed at a level directly under the group and its slaves under each master). In Figure 16-10, it is easy to see thedevelopment server has two slaves, dev_slave1 and dev_slave2, and the development server is a slave to the production server. Having all the information about replication in one location makes the tedious task of monitoring replication on each server obsolete.
Advisors
What makes all of the alerts and pretty charts so informative are the best practices implemented in the advisors. You can see all of the active advisors (and create your own) on the Advisors tab in the Dashboard.
Figure 16-11 shows the advisors that are active for a specific server on your network. You can enable, disable, or unschedule any of the advisors (unscheduling removes the data collected).
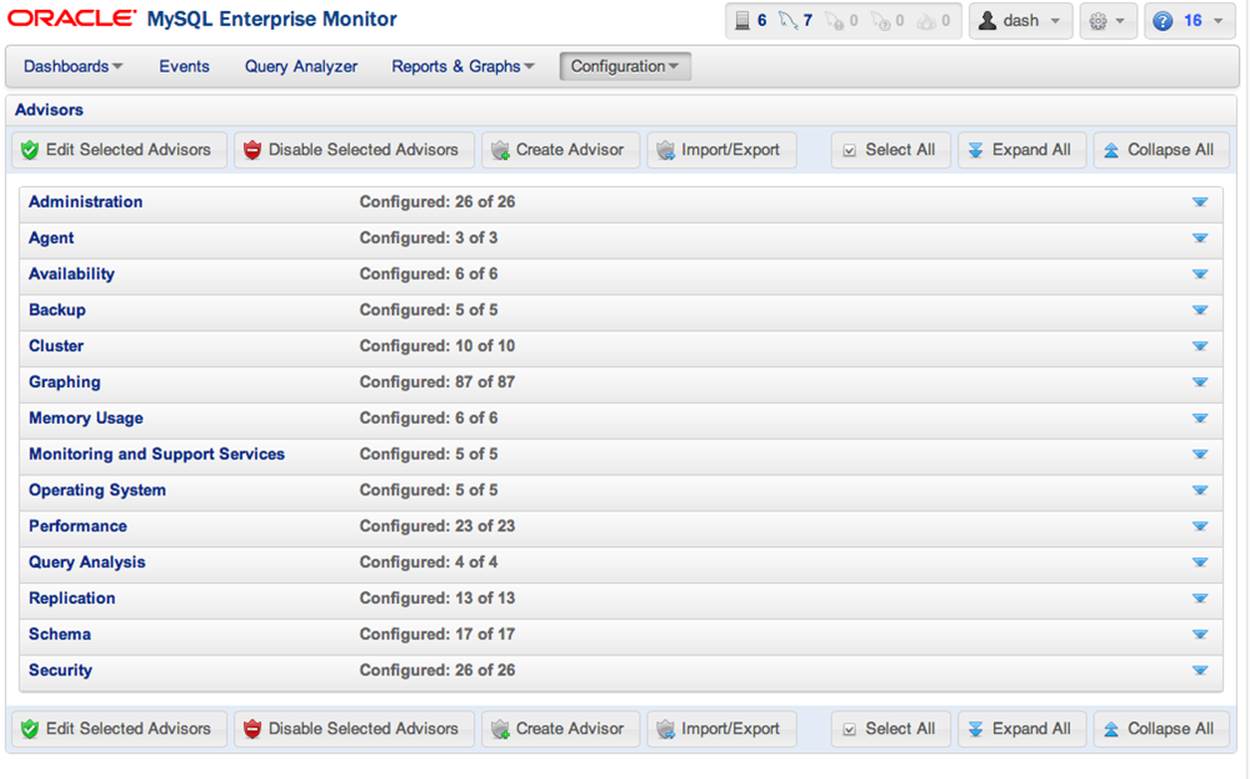
Figure 16-11. Advisors
Perhaps the most useful feature of this page is adding your own advisors. This feature allows you to expand the MEM to meet your specific needs. It also gives you the one thing you need most when migrating from a manual monitoring solution: the ability to preserve your hard work.
For example, if you create a reporting mechanism that monitors a custom application, you can create an advisor for it and add alerts to the Dashboard. The specific details of how to add new advisors and alerts are covered in the MySQL Enterprise Monitor manual on the MySQL Enterprise Edition documentation site. This customization feature is one the most powerful and underutilized features of MySQL Enterprise Edition.
Query Analyzer
One of the most powerful features of MEM is the Query Analyzer. The Query Analyzer works by intercepting SQL commands using MySQL Proxy and processing them, then passing them on to the local server for execution. This allows it to record statistics so that you can view them at any time. The Query Analyzer also supports advisors that fire alerts for slow queries. Figure 16-12 shows a conceptual drawing of how MySQL Proxy intercepts queries and reports the statistics to the MEM.
NOTE
Newer versions of the Query Analyzer can use the Performance Schema database instead of the MySQL Proxy to gather statistics.
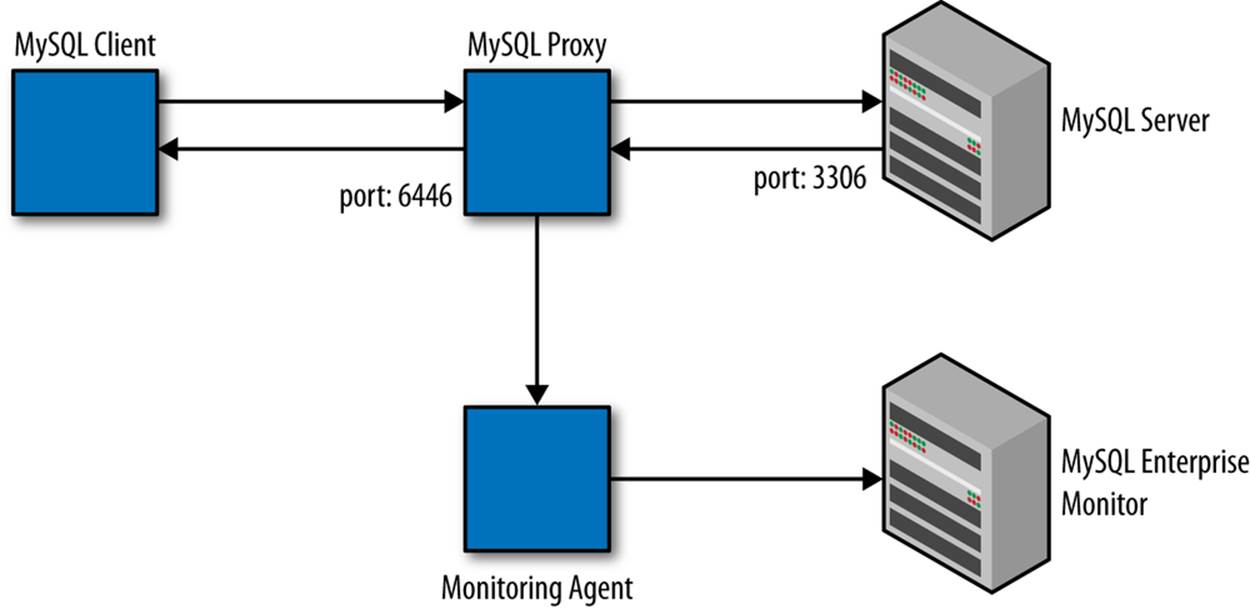
Figure 16-12. Using MySQL Proxy to collect data for Query Analyzer
NOTE
The Query Analyzer runs over the user-defined port 6446 (by default) and can introduce some performance delay. Thus, you should enable it only when you are searching for problems.
One nice thing about the Query Analyzer and the Dashboard is the tight integration among the tools. If you have an alert about a slow query or drill down into a CPU utilization report or other MySQL-based statistic, you will see the Query Analyzer page (which you can also access directly by clicking the Query Analyzer tab). Figure 16-13 shows an example of the Query Analyzer page on the Dashboard.
The Query Analyzer page displays a list of servers on the left. You can click a specific server to see a list of queries executed on that server, sorted by longest running query. You can also use the chart at the top to narrow the time window to see queries during a specific time period.
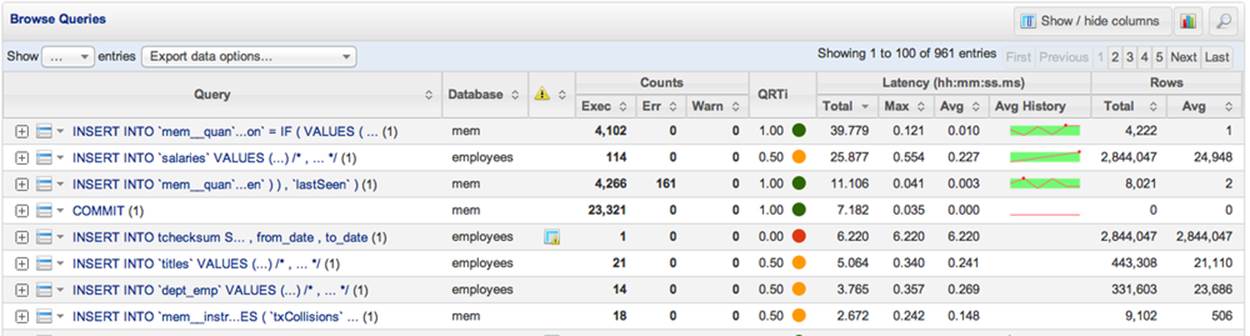
Figure 16-13. Query Analyzer display
You can sort the list on any column by clicking the column heading. This makes it a bit easier to see repetitive queries and diagnostics by sorting the rows with the longest-running queries at the top, showing the query statement, the amount of data manipulated, and more.
You can click any row to get a more detailed report on the query. Figure 16-14 shows a sample canonical query report. As with the other reports, you can get more detailed information, including the actual query on the Example Query tab, the output of the EXPLAIN command on the Explain Query tab (if you enabled that option), and graphs for execution time, number of executions, and number of rows returned on the Graphs tab.
MEM AND CLOUD COMPUTING
MEM can also function well in a cloud computing environment. The same rules apply, however, regarding the persistence of the data and server instances. Just be sure to request a persistent IP address for your MEM server. Repeatedly starting and stopping your instances will cause no ill effects, but changing hostnames and some types of reconfiguration can cause the monitoring agents to stop reporting. The unique ID for each server is stored in the mysql.inventory table. Even though you change the IP address, it won’t be re-added to the table because a previous incarnation (with the same unique ID) is already in the table. Thus, MEM may not be able to contact the server because it may be using stale data (the old IP address). Truncating the table typically solves this (because the server will be added to the table again), but it is best to use the same hostnames and IP addresses for all of your servers.
There is one excellent benefit of running MEM in a commercial provider’s cloud: you pay only for computation and storage space. Data transfer within the cloud is usually free or much less than shipping data in and out of the cloud.
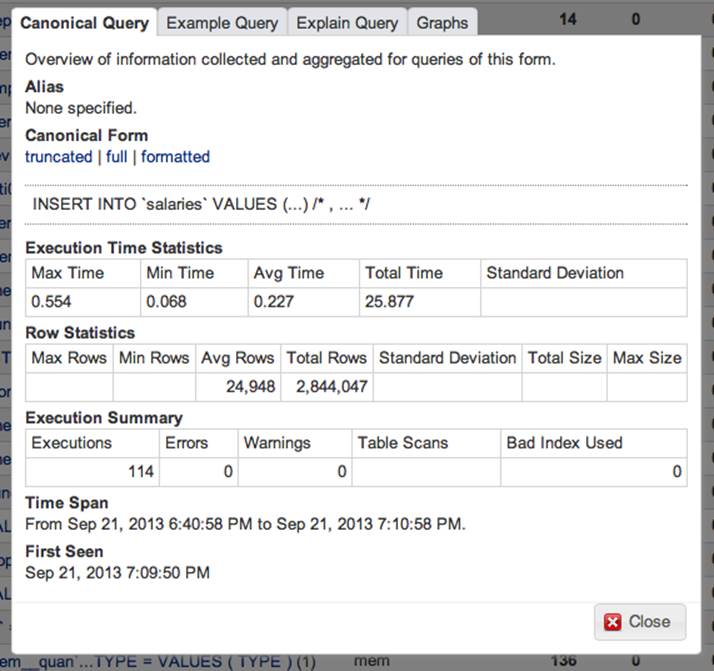
Figure 16-14. Canonical query report
This report presents details of the query captured, such as the canonical form of the query (a pictorial representation of the query as it was written), details of its execution (including time taken), and rows returned or affected.
Once again, the Query Analyzer component of MEM provides a monitoring tool that will save you a considerable amount of time diagnosing problems with MySQL. This component is a vital monitoring tool that will help you keep your servers running well and your queries executingefficiently.
Further Information
A complete and thorough description of the MEM and its many features is beyond the scope of this book. However, there is a great deal of information available on the Web. For more information about custom advisors and more, see the MySQL Enterprise Monitoring manual located on the MySQL Enterprise Edition documentation site. If you are an Oracle customer, you can check the knowledge base on the Oracle support website (https://support.oracle.com) for answers to common problems.
Conclusion
The MySQL server is the most popular open source database system for good reason. It is so versatile that any organization can use it, from a single self-contained web server providing content to users to online transaction processing systems (OLTPs) to highly available massively scaled-out data center infrastructures. MySQL can handle all of this and more. The MEM makes it possible to extend MySQL to large installations while preserving peak performance and reliability.
If you need high availability and want to build the best and most reliable data center based on MySQL, you should consider purchasing the appropriate MySQL Enterprise Edition licenses. Other solutions exist, but none have the depth of expertise for best practices offered by MySQL Enterprise Edition and none give you the sophistication of the advisors and Query Analyzer for a bargain price.
Joel was ready. He had sent his proposal to purchase the much-needed MySQL Enterprise Edition licenses to cover all of the company’s servers. Mr. Summerson had a reputation for spending as little as possible, so Joel was ready to defend his proposal and had decided not to give up until Mr. Summerson had at least heard him out.
Each time he heard footsteps approaching, Joel would look up at his doorway. He knew his boss would stop by any moment. Another set of footsteps approached and he steeled himself once more. Mr. Summerson whisked by without a glance. “Wait for it,” Joel whispered.
“Joel, I like this MEM thing. I want you to put together a cost estimate and…”
Joel interrupted his boss. “I already have a report for you, Bob.”
Mr. Summerson raised his eyebrows and said, “Send it to me, and I’ll get the bean counters to see if we can work it into the budget for next year.” With that, Mr. Summerson was gone, on his way to his next victim.
Joel eased back in his desk chair and crossed his arms in satisfaction. “I’ll take that as an ‘attaboy,’” he said.
All materials on the site are licensed Creative Commons Attribution-Sharealike 3.0 Unported CC BY-SA 3.0 & GNU Free Documentation License (GFDL)
If you are the copyright holder of any material contained on our site and intend to remove it, please contact our site administrator for approval.
© 2016-2026 All site design rights belong to S.Y.A.