NoSQL for Mere Mortals (2015)
Part V: Graph Databases
Chapter 12. Introduction to Graph Databases
“They told me computers could only do arithmetic.”
—GRACE HOPPER
COMPUTER SCIENTIST AND U.S. NAVY REAR ADMIRAL
Topics Covered In This Chapter
Design Criteria of Graph Databases
Graphs and Network Modeling
Advantages of Graph Databases
In this chapter, you learn about a specialized type of database known as a graph database. A graph database is based on a branch of mathematics known as graph theory. The techniques in this area of mathematics are useful for analyzing connections and links between entities. As you shall see, these techniques are quite useful in many data management areas.
What Is a Graph?
Graphs are mathematical objects that consist of two parts: vertices and edges. Vertices are sometimes called nodes; however, this chapter avoids this term to prevent confusion because the term node can also refer to a server in a cluster.
Vertices represent things. They could be just about anything, including
• Cities
• Employees in a company
• Proteins
• Electrical circuits
• Junctions in a water line
• Organisms in an ecosystem
• Train stations
One thing that is common with all of these things is that they have relationships to other things—often in the same category. Cities are connected to other cities by roads. Employees work with other employees. Proteins interact with other proteins. Electrical circuits are linked to other electrical circuits. Junctions in water lines connect to other junctions. Organisms in ecosystems are predators and prey of other organisms. Train stations are connected to other train stations by railway lines.
The links or connections between entities are represented by edges. This might seem like an obvious representation for some relations, such as roads and railway lines between cities. However, it might be less obvious in other cases, such as interacting proteins and organisms in an ecosystem. The flexible nature of vertices and edges makes them well suited to model both concrete and abstract relations between things.
Figure 12.1 shows a simple graph with two vertices and one edge.
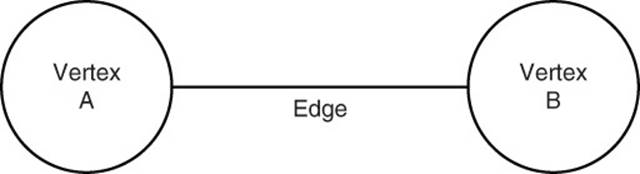
Figure 12.1 A simple graph with two vertices and one edge.
Some relations are long term (for example, roads between cities), whereas others are short term (for example, a person passing on a bacterial infection to another person). Additionally, some are physically obvious, whereas others have no physical instantiation. For instance, you can see a water line, but the manager-employee relationship in a business has no physical representation.
Graphs and Network Modeling
At first glance, it is obvious that graphs are good for modeling networks. However, it might also appear that networks are specialized systems and not generalized to a wide range of problems; this assumption is incorrect. If you think of networks as things and relations between those things, you can start to see networks everywhere. Here are several examples to show the breadth of problems you can tackle by modeling systems as graphs.
Modeling Geographic Locations
Highways and railways have two distinct properties of interest here: They are designed to link geographic locations and they last a long time.
Geographic locations are modeled as vertices. These could be cities, towns, or intersections of highways. Vertices have properties, like names, latitudes, and longitudes. In the case of towns and cities, they have populations and size measured in square miles or kilometers.
Highways and railways are modeled as edges between two vertices. They also have properties, such as length, year built, and maximum speed.
Highways could be modeled in two ways. A highway could be a single edge between two cities, in which case it models the road traffic in both directions. Alternatively, a graphical representation could use two edges, one to represent travel in each direction (for example, east to west and west to east). Which is the “right way” to model highways? It depends.
If your goal is to model distance and approximate travel times between cities, then a single edge might be sufficient. If you are interested in more detailed descriptions of highways, such as direction, number of lanes, current construction areas, and locations of accidents, then using two edges is a better option. When you use two edges between cities, it helps to indicate which direction traffic is flowing. This is done with a type of edge known as a directed edge (see Figure 12.2).
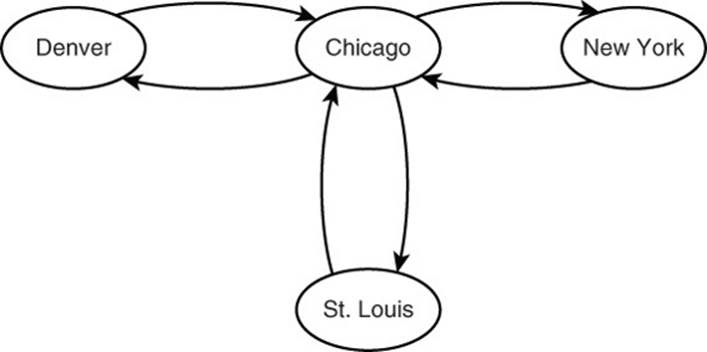
Figure 12.2 Highways between cities are modeled as vertices and edges.
Modeling Infectious Diseases
Infectious diseases can spread from person to person. For example, a person coughs into his hand and bacteria and viruses are left on his hand. When that person shakes the hand of someone else, there is a chance that a pathogen is transmitted to the other person, who may eventually become infected. The spread of infectious disease is readily modeled using graphs.
Vertices represent people, whereas edges represent interactions between people, such as shaking hands or standing in close proximity. Both the vertices and the edges have properties that help represent the way diseases spread (see Figure 12.3).
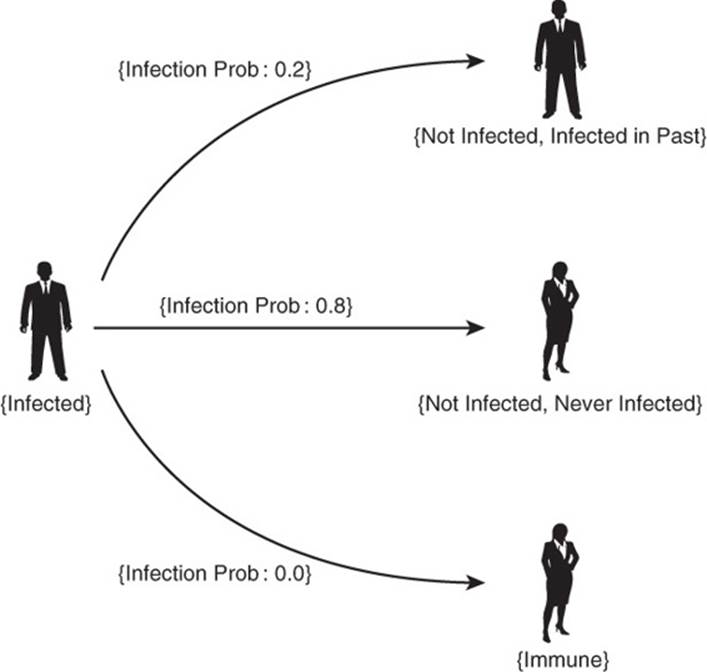
Figure 12.3 The spread of flu and other infectious diseases is modeled as graphs.
People have properties, such as age and weight. In the case of the infectious disease model, the most important property is infection status, which could be
• Not infected now, never infected before
• Not infected now, infected in the past
• Infected now
• Immune
You want to keep track of these properties because they influence the probability of becoming infected:
• If you are not infected now and never have been, you have a moderately high probability of becoming infected upon contact with an infected person.
• If you are not infected now but were infected in the past, you have probably acquired some immunity to the infectious disease. This means you have a low probability of getting infected upon contact with an infected person.
• If you are infected now and come in contact with another infected person, you will both continue to be infected. There is no change.
• If you are immune, either because of some natural immunity or medical immunization, then you will not become infected upon contact with another infected person.
The state of an infectious disease graph would change frequently as people interact; some people become infected while others recover from the disease. As you can see, this is much different from the railways and highways example, which is fairly static in terms of nodes and edges. Properties of cities and roads may change as populations change and car accidents occur. The infectious disease graph changes as people interact, something that happens frequently and rapidly.
Edges—or in this case, interactions between people—have properties. For example, there is a probability that someone will transmit a disease to another person by shaking hands. This interaction has a higher rate of transmission than two people standing in close proximity but not touching. Some pathogens require physical contact to spread disease, whereas other airborne diseases can transmit without direct contact. These are the kinds of properties that would be associated with edges.
Graphs are useful for more than modeling railways and disease transmission. Sometimes there is no flow or transmission of objects between vertices. Instead, some graphs model relations between things that persist over time.
Modeling Abstract and Concrete Entities
Graphs are well suited to model abstract relations, like a part-of relation. For example, the state of Oregon is a part of the United States, and the province of Quebec is a part of Canada. The city of Portland is located in Oregon, and the city of Montreal is located in Quebec. This kind of hierarchical relationship is modeled in a special type of graph known as a tree.
A tree has a special vertex call the root. The root is the top of the hierarchy. Figure 12.4 shows two trees, one for the United States and one for Canada. Both show the relationship between national, regional, and local government entities.
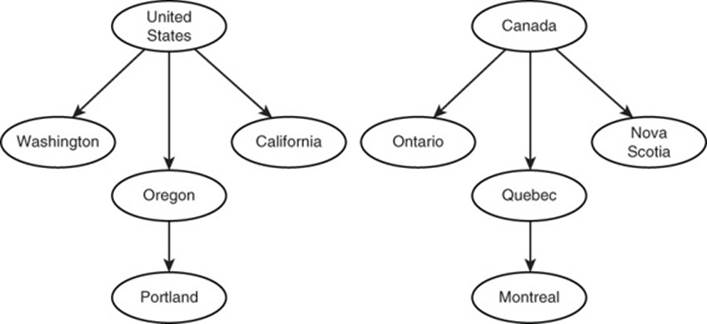
Figure 12.4 Hierarchical government structures modeled as graphs.
Notice that all nodes connect up to only one other vertex. The upper vertex is often called the parent vertex, and the lower vertices are called children vertices. Parent vertices can have multiple children vertices.
Trees are useful for modeling hierarchical relationships, such as organization charts, as well as part-of relations, such as parts of a car, as shown in Figure 12.5.
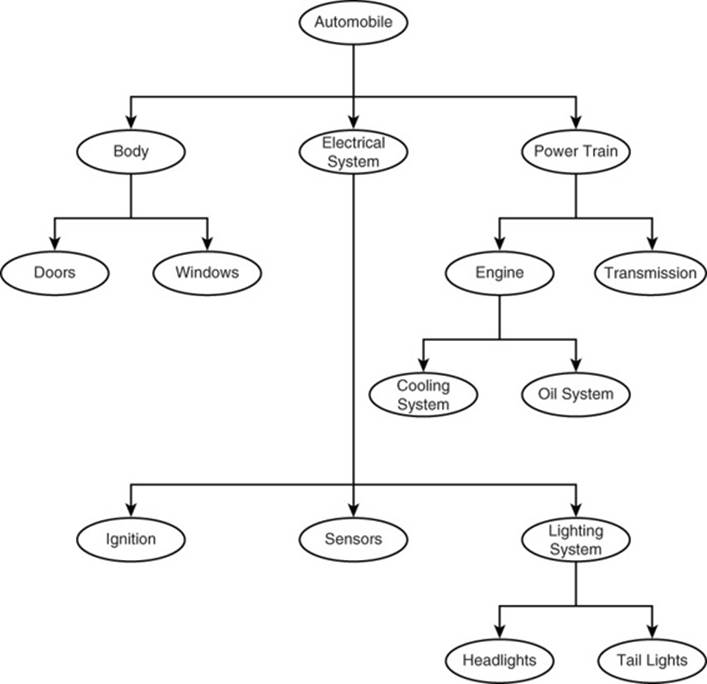
Figure 12.5 Part-of relations, such as parts of a car, are modeled using a graph.
The examples so far have focused on flows or relations between entities of the same type, such as cities and governments; graphs can also model relations between different types of entities.
Modeling Social Media
Social networking sites like Facebook and LinkedIn allow users to interact and communicate with each other online. They have extended the way people communicate by introducing new ways of interacting, such as the “Like” button. This makes it quick and easy to indicate you like or appreciate someone else’s post.
A social media “like” can be modeled as a link between a person and a post. Many people can like the same post, and people can have multiple posts each with a different number of likes. The vertices in this case would be people and posts. It is worth pointing out, not all vertices and edges have to be of the same type; there can be a mix of different types in a single graph.
Figure 12.6 shows an example of a people-like-posts graph. You will notice, unlike many other graphs, this has a special property. The edges only go from people to posts; there are no edges between people or between posts. This is a special type of graph known as a bipartite graph, and it is useful for modeling relations between different types of entities.
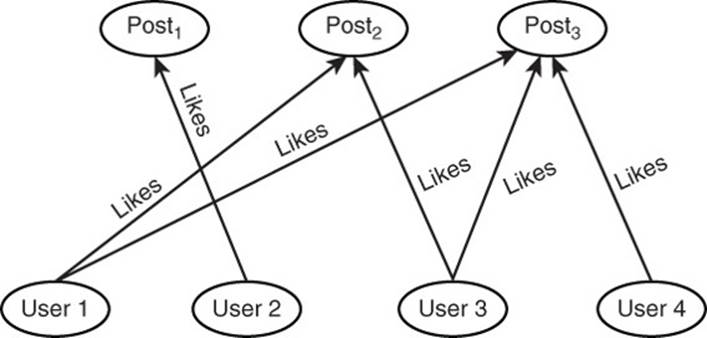
Figure 12.6 Social media posts and likes are modeled by graphs.
As these examples show, graphs are capable of modeling a wide range of entities and relations. An obvious question probably comes to mind: What are good use cases for graph databases?
Advantages of Graph Databases
Graph databases show explicit relations between entities. Vertices represent entities, and they are linked or connected by edges. In relational databases, connections are not represented as links. Instead, two entities share a common attribute value, which is known as a key.
Query Faster by Avoiding Joins
To find connections or links in a relational database, you must perform an operation called a join. A join entails looking up a value from one table in another table. For example, in Figure 12.7, the table Students has a list of student names and IDs. The student ID is also used in the table Enrollment to indicate a student is enrolled in a course. To list all of the courses a student is enrolled in, you need to perform a join between two tables. This can be time consuming when using join operations frequently on large tables.
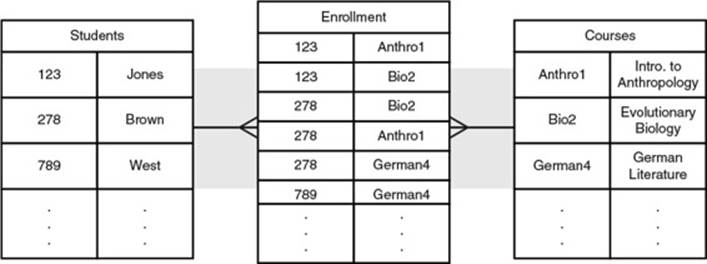
Figure 12.7 Representing a student-course relation in a relational database.
Alternatively, you can represent relations between a student and a course using a graph, as shown in Figure 12.8. The edges between students and courses allow users to quickly query all the courses a particular student is enrolled in.
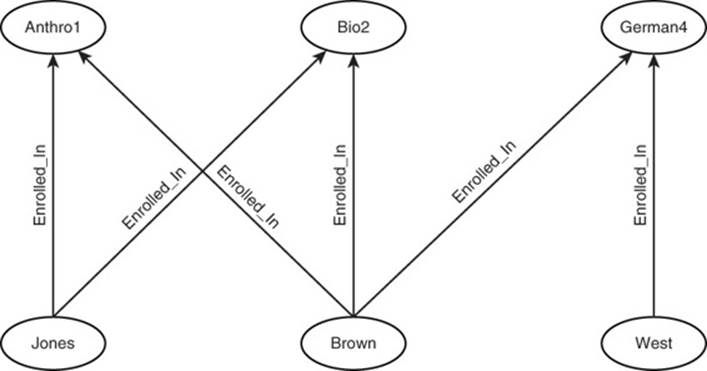
Figure 12.8 Representing a student-course relation in a graph database.
The infectious disease example shows even more dramatically how graphs can help avoid joins. Figure 12.9 shows a relational table with information about people and their state of infection. It also shows a table indicating interactions between people.
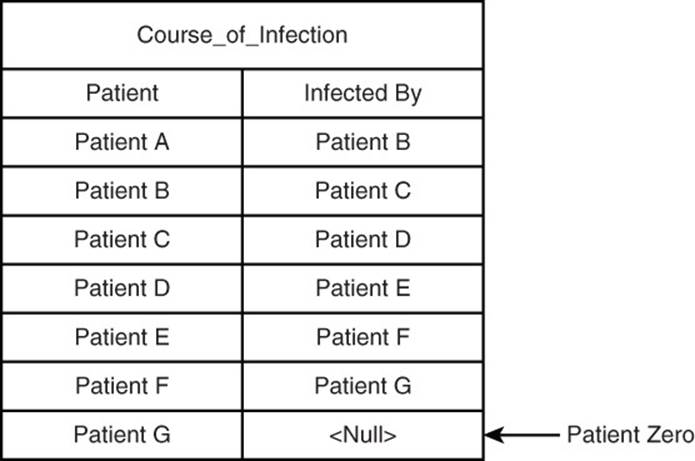
Figure 12.9 Finding Patient Zero in an infectious disease investigation.
During an outbreak, it helps to understand either the source of an outbreak or the first person infected with a disease. Suppose you know Patient A was infected by Patient B, and Patient B was infected by Patient C, and so on. If you were to start with Patient A, you would need to perform a join to find she was infected by Patient B. Next, you would need to query the interaction table to find out Patient C had infected Patient B. The process would continue until you found the person who was not infected by someone else (that is, Patient Zero, or the index case in epidemiological parlance).
![]() Tip
Tip
In a graph database, instead of performing joins, you follow edges from vertex to vertex. This is a much simpler and faster operation.
Fun with Graphs
Graphs have even made their way into popular entertainment. Take the board game Pandemic from Z-Man Games, for instance. In Pandemic, players work together to suppress and eradicate four different infectious diseases, represented by colored plastic blocks. The game board displays numerous major cities across the world, and each city possesses between two and six lines connecting it to another city. Each line represents a pathway for transmission of a given disease. Throughout the game, players utilize unique powers assigned to them at the beginning of the game to remove the colored blocks from the board.
As you can see, Pandemic’s gameplay takes place within a graphical model. Cities act as the vertices, whereas the lines serve as edges. You may also attribute certain properties to the vertices and edges. For instance, each city has a certain number of lines connecting it to other cities, as well as a level of infection, represented by the number of colored blocks on a city. In this case, properties of the edges are more abstract. They include whether or not the lines connect two infected cites, two healthy cities, or one infected city and one healthy city.
Simplified Modeling
Working with graph databases can simplify the modeling process. When you work with relational databases, you typically start by modeling the main entities in your domain. In the case of social media, this could be people and posts. In the case of infectious diseases, the main entity is just people. When you start to model information about interactions, it can start to get more complicated.
For example, in the social media area, many people may like a post and a post may be liked by many people. This is known as a many-to-many relation, which is modeled as another table, as shown in Figure 12.10.
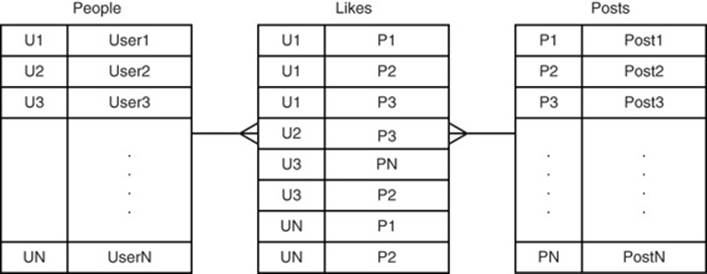
Figure 12.10 Modeling many-to-many relations in a relational database.
In a graph database, there is no need to create tables to model many-to-many relations; instead, they are explicitly modeled using edges.
Multiple Relations Between Entities
Using multiple types of edges allows database designers to readily model multiple relations between entities. This is particularly useful when modeling transportation options between entities. For example, a transportation company might want to consider road, rail, and air transportation between cities (see Figure 12.11). Each has different properties, such as time to deliver, cost, and government regulations.
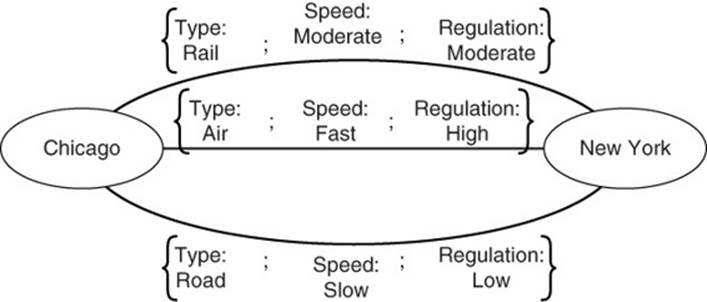
Figure 12.11 Modeling multiple types of relations in a graph database.
Multiple relations can be modeled in relational databases, but they are explicit and easy to understand when using a graph database.
Summary
Interactions and relations between entities are commonplace. Graph theory provides a solid foundation for building graph databases and analyzing relations between entities. As the examples in this chapter show, the power of graph theory can be applied to a wide range of problems. The next chapter introduces additional terms and concepts that will be useful for analyzing graph data.
Review Questions
1. What are the two components of a graph?
2. List at least three sample entities that can be modeled as vertices.
3. List at least three sample relations that can be modeled as edges.
4. What properties could you associate with a vertex representing a city?
5. What properties could you associate with an edge representing a highway between two cities?
6. Epidemiologists use graphs to model the spread of infection. What do vertices represent? What do edges represent?
7. Give an example of a part-of hierarchy.
8. How do graph databases avoid joins?
9. How is a person-likes-post graph different from other graphs used as examples in this chapter?
10. Give an example of a business application that would use multiple types of edges (relations) between vertices.
References
Easley, David, and Jon Kleinberg. Networks, Crowds, and Markets: Reasoning About a Highly Connected World. Cambridge, England: Cambridge University Press, 2010.
Robinson, Ian, Jim Webber, and Emil Eifrem. Graph Databases. Sebastopol, CA: O’Reilly Media, Inc., 2013.
Trudeau, Richard J. Introduction to Graph Theory. Mineola, NY: Courier Dover Publications, 2013.