NoSQL for Mere Mortals (2015)
Part V: Graph Databases
Chapter 13. Graph Database Terminology
“If the industrial age was about building things, the social era is about connecting things, people and ideas.”
—NILOFER MERCHANT
FOUNDER AND CEO, RUBICON CONSULTING
Topics Covered In This Chapter
Elements of Graphs
Operations on Graphs
Properties of Graphs and Nodes
Types of Graphs
A graph is a fairly abstract concept. It includes two basic components: vertices and edges. Even with such a simple model, graphs are suitable for modeling a number of domain areas. This forms the foundation for their usefulness as a major type of NoSQL database.
When you consider other properties of graphs, such as weights on edges, and operations you can perform on graphs, such as taking an intersection of two graphs, you have even more capabilities from a modeling perspective.
The goal of this chapter is to define terminology about graphs, their components, operations on graphs, and properties of graphs. Graphs are different from tables and documents and have distinct properties. In this chapter, you learn how these differences enable you to create higher-level abstractions that can fit well with some problem domains, such as modeling social networks, transportation systems, and flow networks.
Elements of Graphs
There are two basic building blocks of graphs: vertices and edges. This section introduces these two components. Using these two components, you can construct higher-level structures such as paths, which are sets of connected edges and vertices. You also learn about loops, a special type of path that sometimes requires specialized processing.
Vertex
A vertex represents an entity marked with a unique identifier—analogous to a row key in a column family database or a primary key in a relational database.
![]() Note
Note
Note that the term node is an acceptable replacement for vertex. However, this book only uses the latter to avoid confusion with the use of node to describe a service running in a cluster.
A vertex can represent virtually any entity that has a relation with another entity (see Figure 13.1). Vertices can represent
• People in a social network
• Cities connected by highways
• Proteins that interact with other proteins in the body
• Warehouses in a company’s distribution network
• Compute servers in a cluster
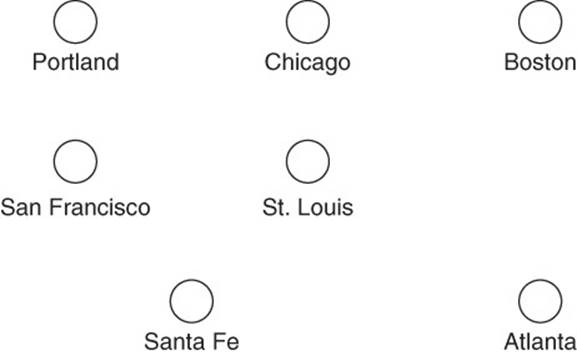
Figure 13.1 Vertices are used to represent objects.
Vertices can have properties. For example, a vertex in a social network represents a person; it has properties like a name, an address, and a birth date. Similarly, a graph of a highway system uses vertices to represent cities. Cities have populations, a longitude and latitude, and a name, and are located in a geographic region.
Edge
An edge, also known as a link or arc, defines relationships between vertices or objects connecting vertices (see Figure 13.2). For example, in a family tree database, vertices can represent people, whereas the edges represent the relationships between them, such as “daughter of” and “father of.” In the case of a highway database, cities are represented with vertices, whereas edges represent highways linking the cities.
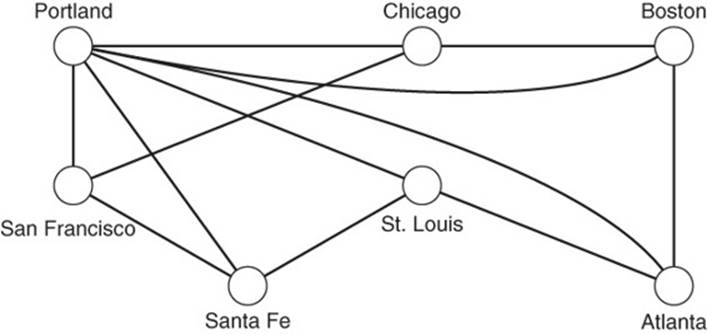
Figure 13.2 Edges represent relationships between vertices.
Much like vertices, edges have properties. For example, in the highway database, all edges will have properties, such as distance, speed limit, and number of lanes. In the family tree example, edges may have properties such as indicating whether two people are related by marriage, adoption, or biology.
A commonly used property is called the weight of an edge (see Figure 13.3). Weights represent some value about the relationship. For example, in the case of highways, weight could be the distance between cities. In a social network, weight could be an indication of how frequently the two individuals post on each other’s walls or comment on each other’s posts. In general, weights can represent cost, distance, or another measure of the relationship between objects represented by vertices.
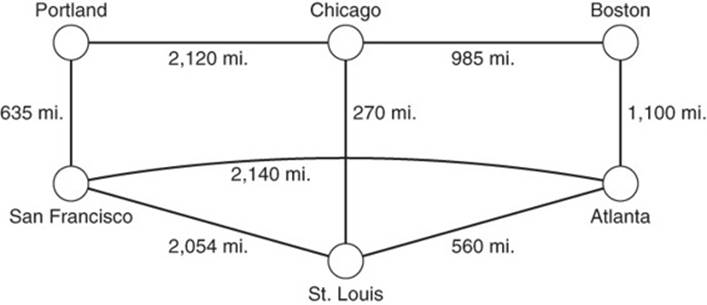
Figure 13.3 Weighted edges have a numeric property associated with them.
![]() Note
Note
Not all graphs have weights. For instance, edge weight would not be a factor in a family tree graph.
There are two types of edges: directed and undirected (see Figure 13.4). Directed edges have a direction. This is used to indicate how the relationship, as modeled by the edge, should be interpreted. For example, in a family relations graph, there is a direction associated with a “parent of” relation. However, direction is not always needed. The highway graph, for instance, could be undirected, assuming traffic flows both ways.
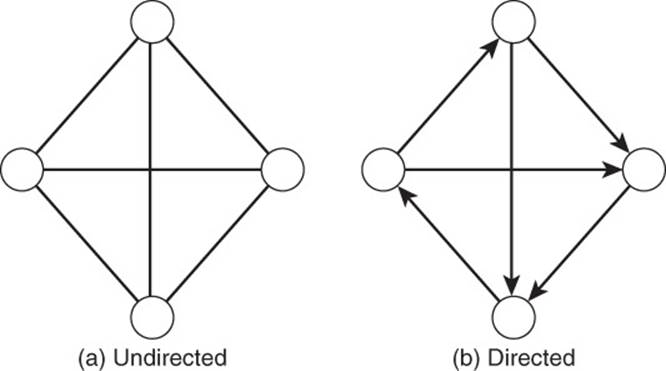
Figure 13.4 Directed and undirected edges further refine properties of relationships between vertices by capturing directionality.
Path
A path through a graph is a set of vertices along with the edges between those vertices (see Figure 13.5). The vertices in a graph are all different from each other. If edges are directed, the path is a directed path. If the graph is undirected, the paths in it are undirected paths.
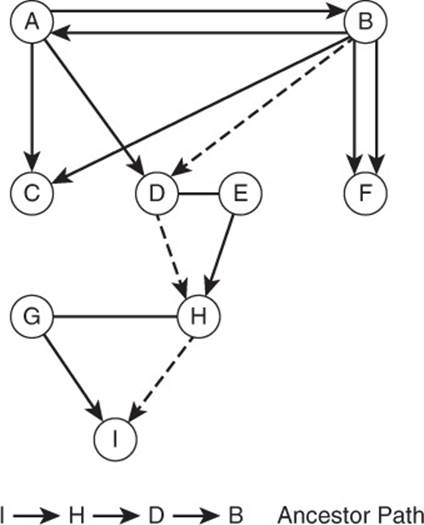
Figure 13.5 A path is a set of vertices and edges through a graph. The vertices and edges from B to D to H to I are a path from vertex B to vertex I.
Paths are important because they capture information about how vertices in a graph are related. For example, in a family graph, a person is an ancestor of someone else only if there is a directed path from the person to her ancestor. In the case of a family tree, there is only one path from a person to an ancestor. In the case of a highway graph, there may be multiple paths between cities.
A common problem encountered when working with graphs is to find the least weighted path between two vertices. The weight can represent cost of using the edge, time required to traverse the edge, or some other metric that you are trying to minimize.
Loop
A loop is an edge that connects a vertex to itself (see Figure 13.6). For example, in biology, proteins can interact with other proteins. Some proteins interact with other protein molecules of the same type. A loop could be used to represent this. However, like direction, it might not make sense to allow loops in some graphs. For instance, a loop would not make much sense in a family tree graph; people cannot be their own parents or children.
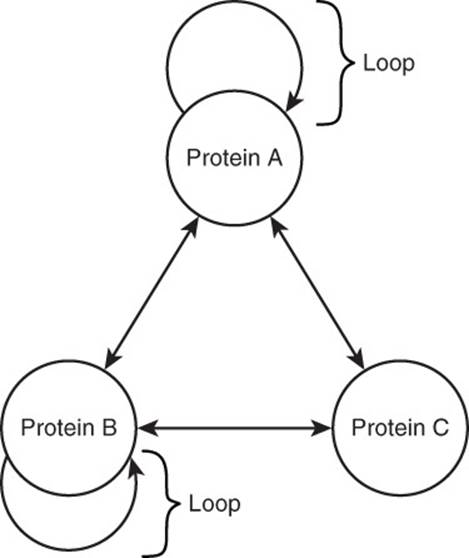
Figure 13.6 A loop is an edge that links a vertex to itself.
Operations on Graphs
Common operations performed on databases include inserting, reading, updating, and deleting data. You do this in graph databases as well. In the case of relational, document, and column family databases, you often perform aggregations, such as counting or summing values from multiple rows in the database.
Graph databases are also well suited for an additional set of operations. Specifically, operations can be used to follow paths or detect repeating patterns in relationships between vertices.
The following sections cover three important operations unique to graphs:
• Union of graphs
• Intersection of graphs
• Graph traversal
Union of Graphs
The union of graphs is the combined set of vertices and edges in a graph.
Consider two graphs. The first graph, A, has vertices 1, 2, 3, and 4, and the edges are {1, 2}, {1, 3}, and {1, 4}. The second graph, B, has vertices 1, 4, 5, and 6, and edges {1, 4}, {4, 5}, {4, 6}, and {5, 6}. Figure 13.7 shows the two graphs.
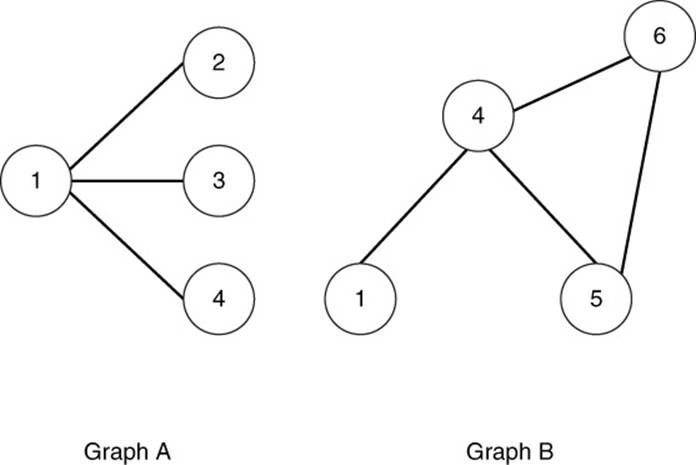
Figure 13.7 Two distinct graphs, A and B.
The union of A and B is the set of vertices and edges from both graphs. The set of vertices is 1, 2, 3, 4, 5, and 6. The set of edges is {1, 2}, {1, 3}, {1, 4}, {4, 5}, {4, 6}, and {5, 6}. Because the two graphs share common vertices, the union produces a single graph (see Figure 13.8).
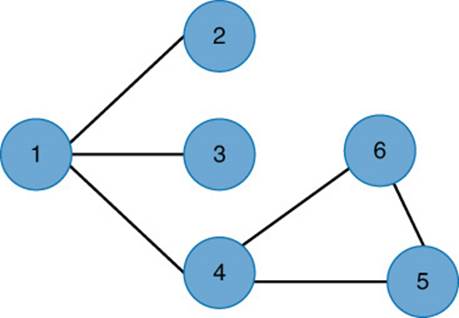
Figure 13.8 Union of graphs A and B.
Intersection of Graphs
The intersection of a graph is the set of vertices and edges that are common to both graphs (see Figure 13.9). In the case of graphs A and B, the intersection of graphs includes vertices 1 and 4, as well as the edge {1, 4}.
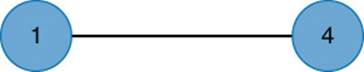
Figure 13.9 Intersection of graphs A and B.
Graph Traversal
Graph traversal is the process of visiting all vertices in a graph in a particular way (see Figure 13.10). The purpose of this is usually to either set or read some property value in a graph.
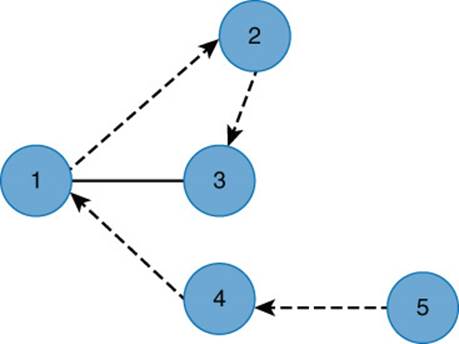
Figure 13.10 Graph traversal is the process of visiting all nodes in a graph.
For example, you might create a graph of all cities in the country that you would like to visit; cities are represented by vertices and highways by edges. You start at your home city and follow the highway with the shortest distance out of all edges between your starting city and another city on the graph.
After you visit the next city, you drive on to a third city. The third city is the city that is the shortest distance from the current city, unless you have already been to that city. For instance, you have already been to your home city, so even if your home city is closest to the second city, you would choose the next shortest route to an adjacent city. In this way, you could keep moving from city to city until you have visited all cities.
Properties of Graphs and Nodes
Several properties of graphs and nodes are useful when comparing and analyzing graphs. These include
• Isomorphisms
• Order and Size
• Degree
• Closeness
• Betweenness
As you will see, these properties are useful when comparing graphs and when trying to identify particularly interesting vertices within a graph.
Isomorphism
Two graphs are considered isomorphic if for each vertex in the first graph, there is a corresponding vertex in the other graph (see Figure 13.11). In addition, for each edge between a pair of vertices in the first graph, there is a corresponding edge between the corresponding vertices of the other graph.
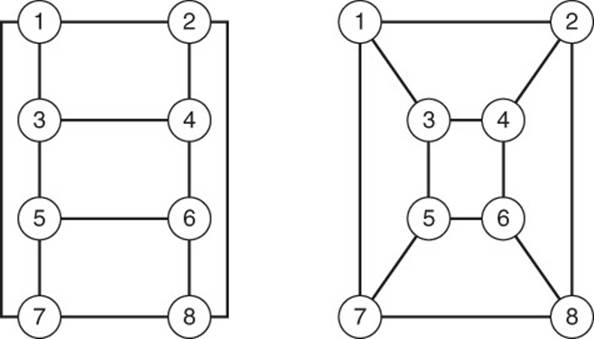
Figure 13.11 Example of two isomorphic graphs.
Graph isomorphism is important if you are trying to detect patterns in a set of graphs. In a large social network graph, there may be repeating patterns with interesting properties. For example, it may be possible to detect business collaborators by examining their links on a business social network.
Another branch of study that makes use of graphs is epidemiology, or the study of infectious diseases. For example, an epidemiologist who studies flu transmission in a city might build a graph of individuals and their connections to other individuals. Let’s assume that they can collect data about who has the flu at any point in time and they want to determine how fast it spreads.
First, the flu may spread faster in some groups than others. This may be because of the characteristics of the individuals involved, or it could be because of patterns of interconnection that affect the rate of disease spread. If epidemiologists can identify patterns associated with infection, they could then identify other individuals by finding similar patterns and target them for intervention, education, and so on.
Order and Size
Order and size are measures of how large a graph is. The order of a graph is the number of vertices, whereas the size of a graph is the number of edges in a graph.
The order and size of a graph are important to understand because they can affect the time and space required to perform operations. It is obvious that performing a union or intersection on a small graph would take less time than performing the same operation on a larger graph. It is also easy to assume that traversing a small graph will take less time than traversing a large graph.
Some problems sound simple but can quickly become too hard to solve in any reasonable amount of time. Consider a clique, which is a set of vertices in a graph that are all connected to each other. Finding cliques is impractical for large graphs.
Think of trying to find the largest subset of people in a social network that know each other; this is obviously a large undertaking. As you work with graphs and perform operations on graphs, consider how the order and size impact the time it takes to perform operations.
Degree
Degree is the number of edges linked to a vertex and is one way to measure the importance of any given vertex in a graph. Vertices with high degrees are more directly connected to other vertices than vertices with low degrees. Degree is important when addressing problems of spreading information or properties through a network.
Consider a person with many family members and friends that he sees regularly; that person would have high degree. What if that person contracts the flu? It is easy to imagine it spreading to friends and family, and from there to people outside of the initial social circle. One person can infect many people if he has many connections.
As another example, think about the last time you were delayed in an airport because of bad weather. Delays in airports with high degrees, like Chicago and Atlanta, can generate ripple effects that lead to delays at other airports.
Closeness
Closeness is a property of a vertex that indicates how far the vertex is from all others in the graph.
Closeness is an important measure if you want to understand the spread of information in a social network, an infectious disease in a community, or movement of materials in a distribution network.
Vertices with high closeness values can reach other vertices in the network faster than vertices with smaller closeness values. Marketers, for example, might want to target people in a social network with high closeness values to get the word out about a new product. Information will spread faster in the network if the marketer starts with someone with a high closeness value than with someone on the periphery of the network.
Betweenness
In addition to understanding closeness, it is sometimes important to understand betweenness. Betweenness is a measure of how much of a bottleneck a given vertex is. Imagine a city on a river that has many roads but only one bridge (see Figure 13.12).
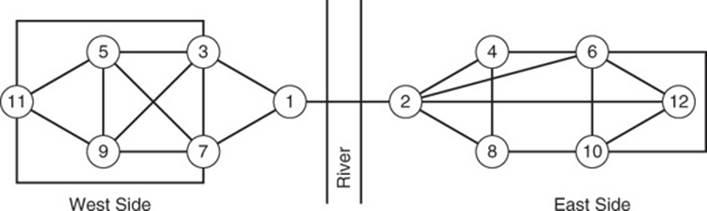
Figure 13.12 Betweenness helps identify bottlenecks in a graph.
As you can see from the network, there are many ways, or paths, to move from one vertex to another on the west side of the network. Similarly, there are multiple paths to get from one vertex to another on the east side. There is only one edge that connects the west and east sides of the city, linking vertices 1 and 2.
Both vertices 1 and 2 will have high betweenness scores as they form a bottleneck in the graph. If vertex 1 or 2 were removed, it would leave the graph disconnected. However, if you removed nodes 4 or 9, for example, you could still move between any of the remaining nodes.
Betweenness helps identify potentially vulnerable parts of a network. For instance, you would not want a distribution network that depended on one bridge. If that bridge were damaged or the flow of traffic were disrupted, you would not be able to move materials to all vertices in the network.
Types of Graphs
Graphs are useful for modeling structures and processes in many different domains. Sometimes, the graphs represent relations between entities such as people or cities. In other cases, graphs represent the flow of material or objects through a system, such as water flowing through a municipal water system or trucks on a highway. This section describes several distinct types of graphs that can be useful for your modeling need. These include
• Undirected and directed graphs
• Flow networks
• Bipartite graphs
• Multigraphs
• Weighted graphs
Graphs you create might share features from one or more of these types. For example, you might have directed and weighted graphs. It is important to remember that these types are not mutually exclusive.
Undirected and Directed Graphs
An undirected graph, shown in Figure 13.13(a), is one in which the edges are not directed. This type of graph is used for modeling relations or flows where direction does not make sense. For example, you can model couples in a domestic relationship using undirected edges.
Figure 13.13 Undirected (a) and directed (b) graphs.
Directed graphs, shown in Figure 13.13 (b), are graphs with directed edges. You can model a parent-child relationship with directed edges.
There might be cases in which some edges in a graph are directed and some are not. For example, if you modeled employees in a business, some edges could represent a “reports to” relation between an employee and a manager. This would use a directed edge. On the other hand, a “works with” relation among peers would be without direction. It could also be modeled as two directional edges.
![]() Refer to Chapter 14, “Designing for Graph Databases,” to learn more about graph database design.
Refer to Chapter 14, “Designing for Graph Databases,” to learn more about graph database design.
Flow Network
A flow network is a directed graph in which each edge has a capacity and each vertex has a set of incoming and outgoing edges. The sum of the capacity of incoming edges cannot be greater than the sum of the capacity of outgoing edges. The two exceptions to this rule are source and sinkvertices. Sources have no inputs but do have outputs, whereas sinks have inputs but no outputs.
Flow networks are also called transportation networks (see Figure 13.14). Graph databases can be used to model flow networks, like road systems or transportation networks. They can also be used to model processes with continuous flows, such as a network of storm drains that take in rainwater (source) and allow it to flow into a river (sink).
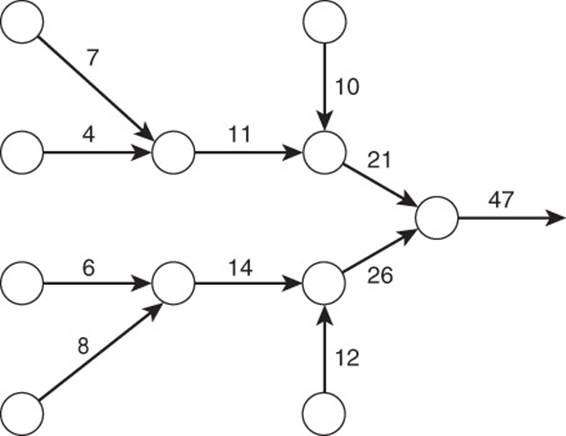
Figure 13.14 Flow networks capture information about capacities of edges and how they can be combined using vertices.
Bipartite Graph
A bipartite graph, or bigraph, is a graph with two distinct sets of vertices where each vertex in one set is only connected to vertices in the other set (see Figure 13.15).
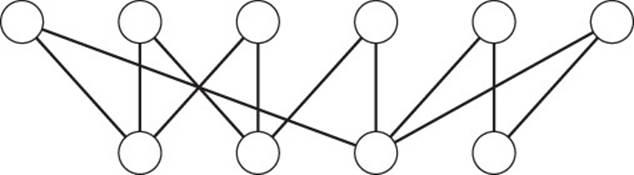
Figure 13.15 A bipartite graph consists of two subgroups of nodes.
Bipartite graphs are useful when modeling relationships between different types of objects. For example, one set of vertices might represent businesses and another might represent people. An edge between a given person and a business appears if the person works for that business. Other examples include teachers and students, members and groups, and train cars and trains.
Multigraph
A multigraph is a graph with multiple edges between vertices (see Figure 13.16). Let’s take a shipping company as an example.
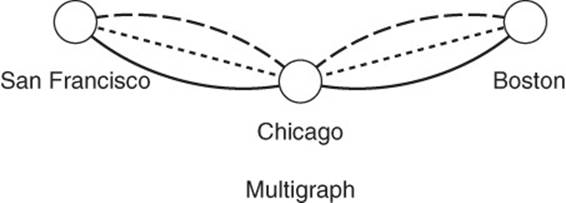
Figure 13.16 A multigraph is used to represent multiple types of relations between vertices.
The company could use a graph database for determining the least costly way to ship items between cities. Multiple edges between cities could represent various shipping options, such as shipping by truck, train, or plane. Each edge would have its own properties, such as the time taken to transport an item between two cities, cost per kilogram to ship, and so forth.
Weighted Graph
A weighted graph is a graph in which each edge has a number assigned to it. The number can reflect a cost, a capacity, or some other measure of an edge. This is commonly used in optimization problems, such as finding the shortest path between vertices.
One way to find the shortest path is known as Dijkstra’s algorithm, created by Edsger Dijkstra. Famous for his contributions to software design, the Dutch scientist actually shunned the use of computers in his own work for many years, instead opting for handwritten manuscripts.
Dijkstra’s algorithm is used to find the shortest path in a network. This is ideal for routing packets on the Internet or finding the most efficient route for delivery trucks.
The algorithm states that the growth rate is equal to the number of vertices squared; this is one of those algorithms where it pays to understand size. Let’s take a look at Table 13.1 for an illustration.
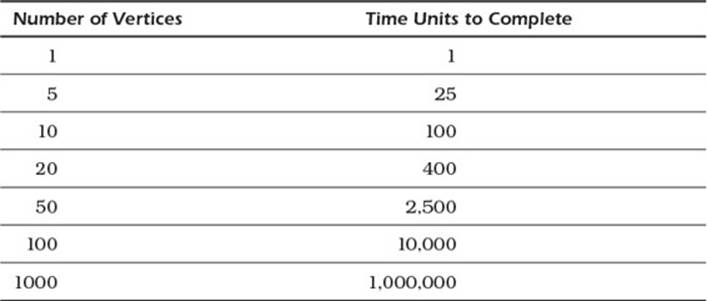
Table 13.1 Growth Rate Calculation of Dijkstra’s Algorithm
As you can see, Dijkstra’s algorithm takes time proportional to the number of vertices in the network. The time required to complete Dijkstra’s algorithm increases exponentially as the number of vertices increases.
Summary
Graphs are composed of two simple components: vertices and edges. This simplicity quickly gives way to a broad range of graph properties and features that are useful for modeling a number of phenomena.
Mathematicians and computer scientists have developed a wide array of algorithms for working with graphs. This combination of the ability to model many domains and apply general algorithms to those domains makes graphs a powerful way to represent data in a NoSQL database.
Review Questions
1. Define a vertex.
2. Define an edge.
3. List at least three examples in which you can use graphs to model the domains.
4. Give an example of when you would use a weighted graph.
5. Give an example of when you would use a directed graph.
6. What is the difference between order and size?
7. Why is betweenness sometimes called a bottleneck measure?
8. How would an epidemiologist use closeness to understand the spread of a disease?
9. When would you use a multigraph?
10. What is Dijkstra’s algorithm used for?
References
Trudeau, Richard J. Introduction to Graph Theory. Mineola, NY: Dover, 1994.
Wikipedia. “Clique Problem”: http://en.wikipedia.org/wiki/Clique_problem
Wikipedia. “Dijkstra’s Algorithm”: http://en.wikipedia.org/wiki/Dijkstra%27s_algorithm
Wikipedia. “Flow Network”: http://en.wikipedia.org/wiki/Flow_network