Make: Basic Arduino Projects - 26 Experiments with Microcontrollers and Electronics (2014)
Chapter 20. Temperature Indicator (with Processing)
Here’s an awesome project that allows you to quickly check the temperature of the environment using a few electronic components from the Ultimate Microcontroller Pack. This temperature indicator uses a small electronic sensor called a thermistor, which changes its resistance—the way electricity flows through it—depending on the temperature. The electronic components to build this gadget are shown in the Parts List. The Temperature Indicator is shown in Figure 20-1.
Parts List
§ Arduino microcontroller
§ MakerShield kit
§ R1: thermistor (green or black candy drop electronic component)
§ R2: 10KΩ resistor (brown, black, orange stripes)
§ USB cable
§ LED1: red LED
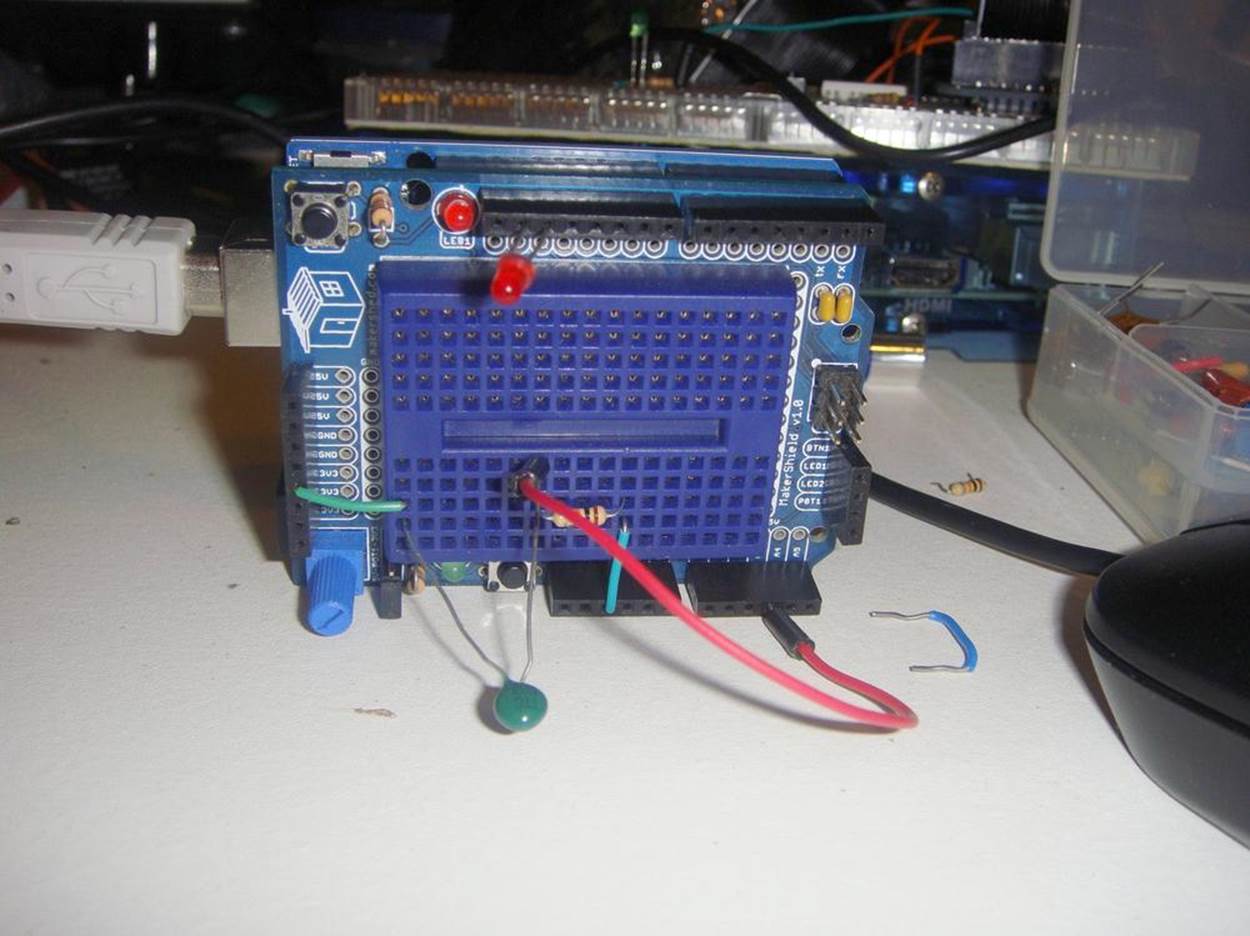
Figure 20-1. The Temperature Indicator
Let’s Build a Temperature Indicator
As shown in Figure 20-1, the breadboard analog circuit is quite simple to build, and requires only a thermistor and a 10KΩ fixed resistor wired in series. Where the two components are tied together, a jumper wire connects between them and pin A3 of the Arduino microcontroller.
The Temperature Indicator can be built using the Fritzing wiring diagram shown in Figure 20-2. Since there are only two electronic components, you have plenty of room for electrical wiring and breadboard placement of the components. Although the Fritzing wiring diagram shows a small breadboard, you can alternatively use the MakerShield protoboard to build the Temperature Indicator.
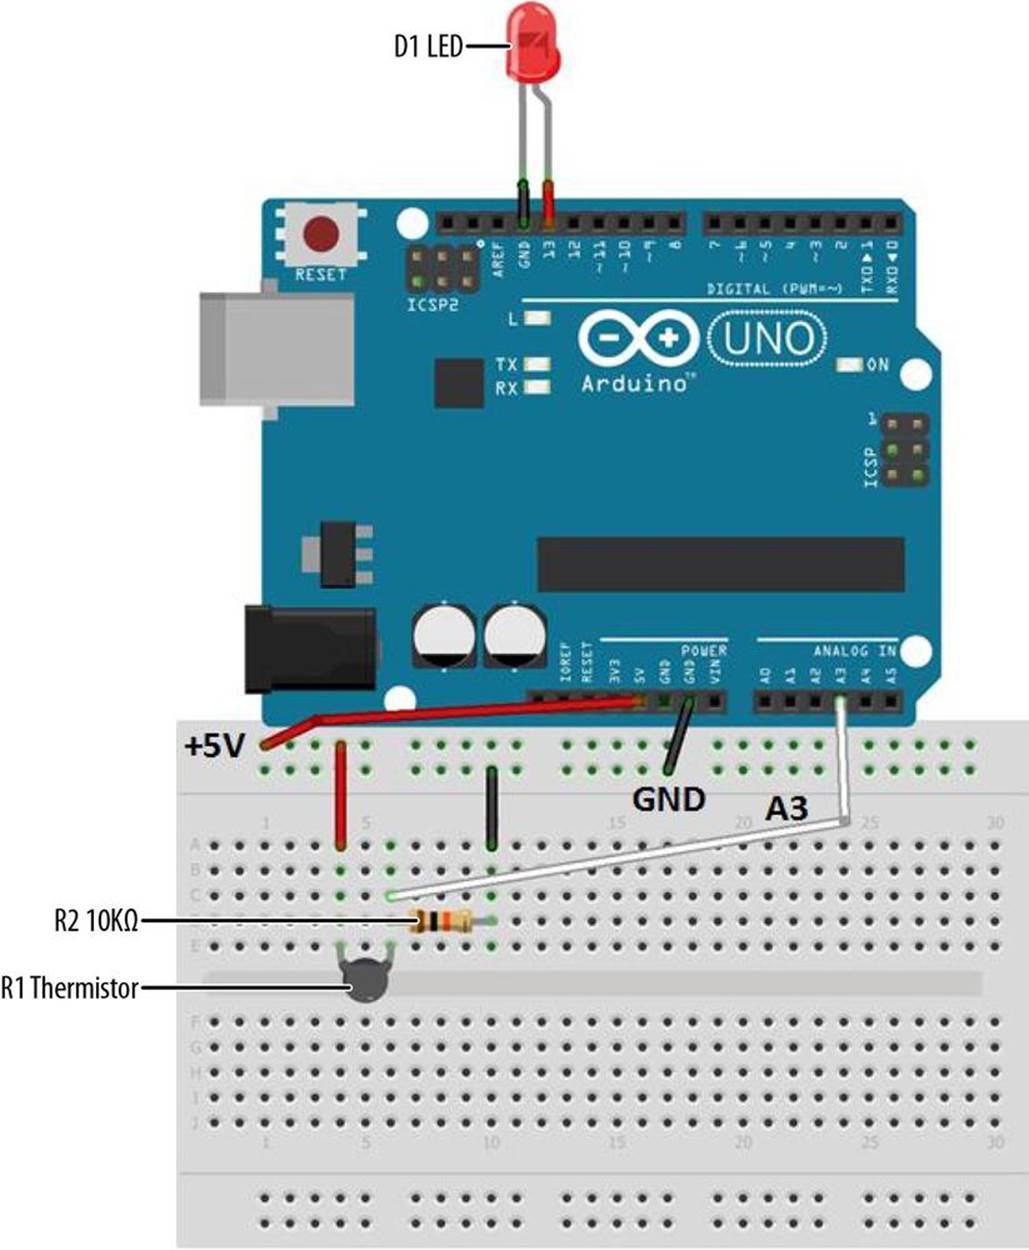
Figure 20-2. The Temperature Indicator Fritzing wiring diagram
TECH NOTE
A thermistor is a special variable resistor that changes its resistance based on temperature.
Upload the Temperature Indicator Sketch
After building the Temperature Indicator circuit and checking for wiring errors, it is time to upload the sketch. Example 20-1 sends analog information to the Arduino IDE (integrated development environment) Serial Monitor, and displays a series of numbers based on the thermistor’s change in resistance. It uses the same serial communication technique used in Chapters 17, 18, and 19 to talk with the Processing programming language. Here are the steps you’ll need to follow:
1. Attach the Arduino microcontroller to your computer using a USB cable.
2. Open the Arduino software and type Example 20-1 into the software’s text editor.
3. Upload the sketch to the Arduino microcontroller.
With the Temperature Indicator sketch uploaded to the Arduino microcontroller, the Serial Monitor will display decimal numbers as shown in Figure 20-3. If you touch the thermistor—making it hotter with your own body heat—the Serial Monitor numbers will change. Also, if you add an external LED between pins D13 and GND, you’ll have a visual indicator of when the thermistor’s temperature has exceeded the threshold value programmed in the sketch. Figure 20-4 shows the Temperature Indicator’s LED in operation.The Temperature Indicator is not an actual electronic thermometer but a device that can sense a certain heat level and respond to it by turning on an LED. The temperature units of Fahrenheit or Celsius are not displayed, thereby removing the concern about the thermistor’s temperature resolution so the focus is on the device’s actual operating performance.
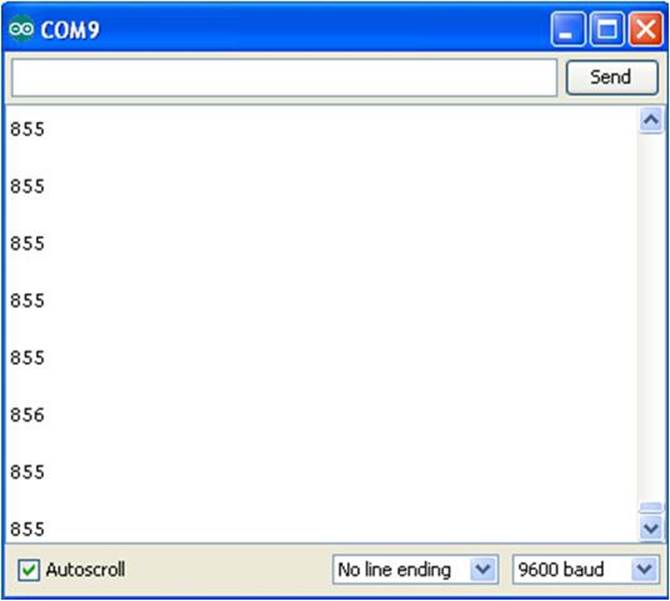
Figure 20-3. Decimal numbers being displayed on the Arduino Serial Monitor
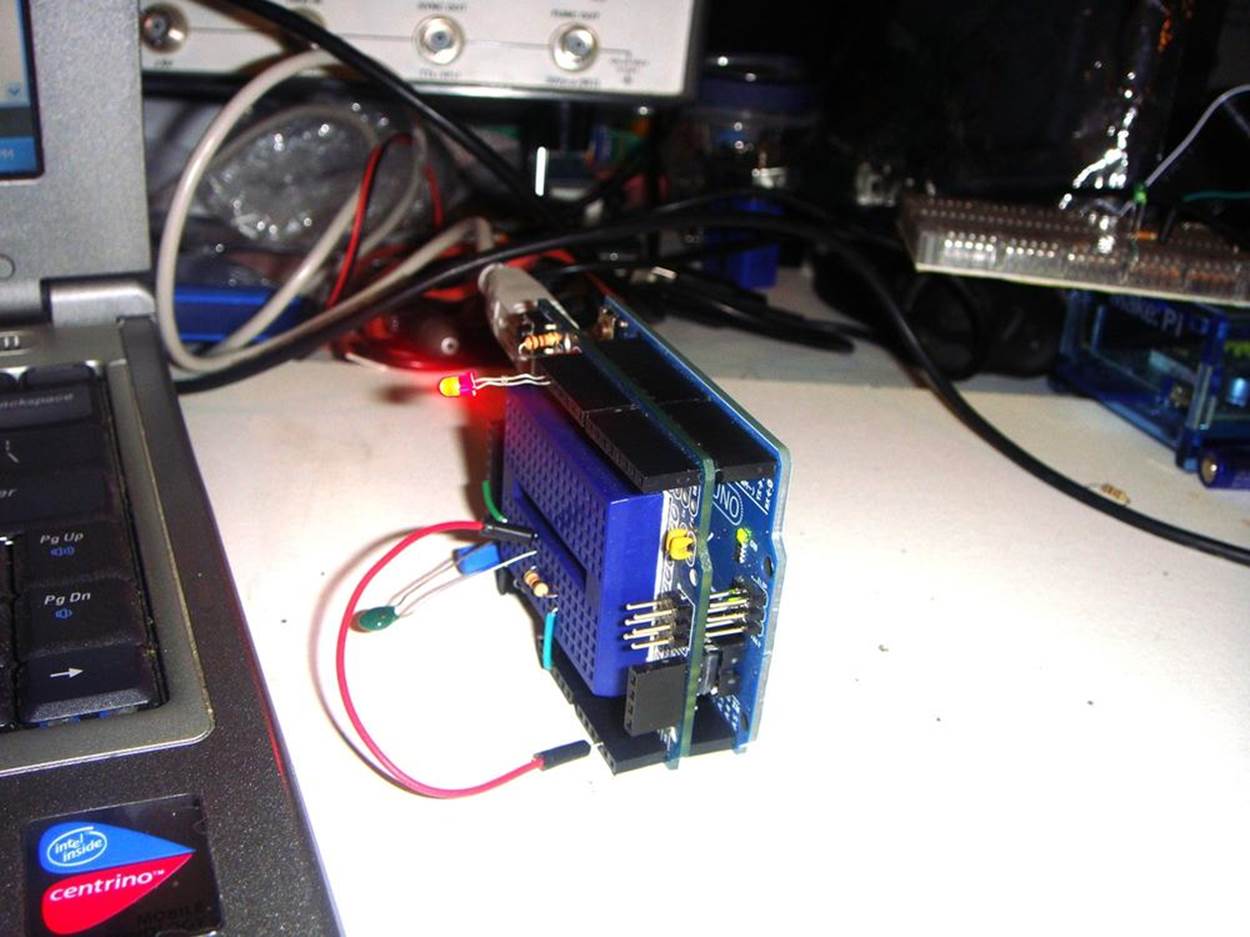
Figure 20-4. Temperature Indicator detecting heat from a notebook computer.
TECH NOTE
The thermistor is used in electronic thermometers to measure temperature.
Example 20-1. The Temperature Indicator sketch
/*
* Temperature_Indicator
*
* Reads an analog input from the input pin and sends the value
* followed by a line break over the serial port. Data can be viewed
* using the Serial Monitor.
*
* This file is part of the Arduino meets Processing Project:
* For more information visit http://www.arduino.cc.
*
* created 2005 ap_ReadAnalog by Melvin Ochsmann for Malmo University
*
* 10 June 2013
* modified by Don Wilcher
*
*/
// variables for input pin and control LED
int analogInput = 3;
int LEDpin = 13;
// variable to store the value
int value = 0;
// a threshold to decide when the LED turns on
int threshold = 800;
void setup(){
// declaration of pin modes
pinMode(analogInput, INPUT);
pinMode(LEDpin, OUTPUT);
// begin sending over serial port
Serial.begin(9600);
}
void loop(){
// read the value on analog input
value = analogRead(analogInput);
// if value greater than threshold turn on LED
if (value < threshold) digitalWrite(LEDpin, HIGH);
else digitalWrite(LEDpin, LOW);
// print out value over the serial port
Serial.println(value);
// and a signal that serves as separator between two values
Serial.write(10);
// wait for a bit to not overload the port
delay(100);
}
The Negative Temperature Coefficient (NTC) Sensor with Processing
When we connect the Temperature Indicator sketch to Processing, the thermistor temperature data from the sketch will be displayed in the Processing IDE Console Monitor, as well as on the main screen of the computer. The layout of this Processing canvas is simple. The graphics consist of two rectangular boxes with fluttering horizontal lines. The fluttering lines represent the thermistor’s temperature, received from the Arduino microcontroller. An example of the fluttering lines and Console Monitor thermistor data is shown in Figure 20-5 and Figure 20-6. The NTC Sensor sketch is shown in Example 20-2. After uploading the NTC Sensor sketch to the Arduino microcontroller, two rectangular boxes with fluttering horizontal lines representing thermistor data will be visible on the computer screen.
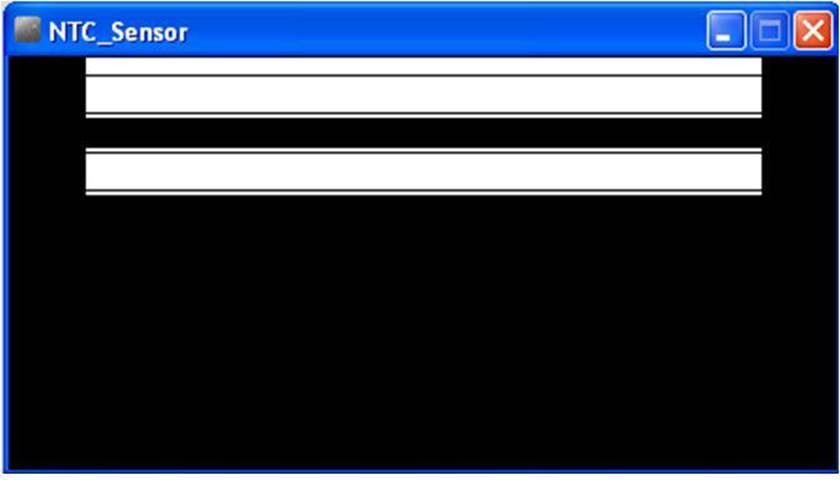
Figure 20-5. Fluttering horizontal data lines
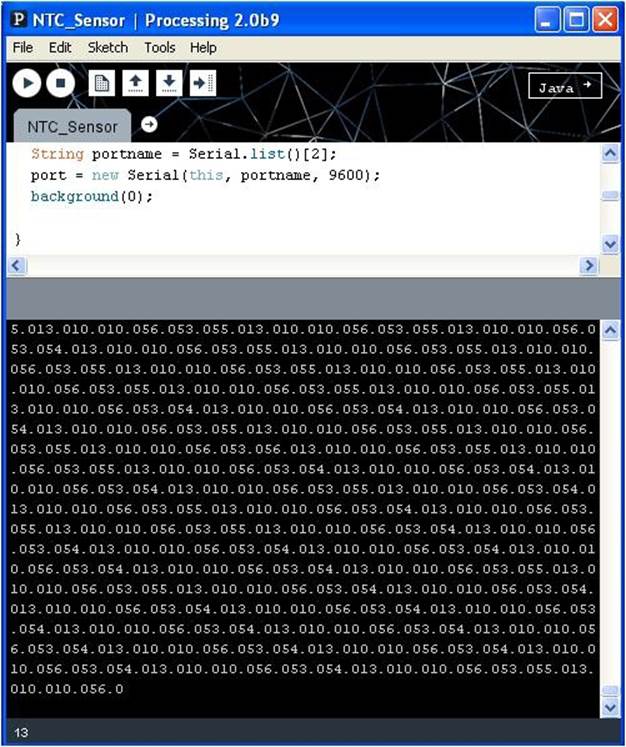
Figure 20-6. Thermistor data displayed on the Processing Console Monitor
TECH NOTE
The thermistor information being transmitted from the Arduino microcontroller through the USB cable and received by the Processing Console Monitor is a good example of data communications.
Example 20-2. The NTC Sensor Processing sketch
import processing.serial.*;
Serial port; // the Serial Port object is created
float val; // variable used to receive thermistor data from Arduino
void setup() {
size(440, 220); // size of canvas
frameRate(30); // how fast the horizontal lines will flutter
smooth(); // reduce jittering of the fluttering horizontal lines
// The "2" corresponds to the 3rd port (counting from 0) on the Serial
// Port list dropdown. You might need to change the 2 to something else.
String portname = Serial.list()[2];
port = new Serial(this, portname, 9600); // baud rate for COM port
background(0); // create a black canvas
}
void draw() {
if (port.available() > 0){ // check for available data on COM port
val= port.read(); // store COM port data in variable "val"
print(val); // print COM data on Console Monitor
// val = map(val, 0, 255, 0, height);
// float targetVal = val;
// easedVal += (targetVal - easedVal)* easing;
}
rect(40, val, 360, 20); // display data has a fluttering horizontal
// line inside a rectangle
}
TECH NOTE
You can play with the horizontal line display rate by modifying the frameRate(30) processing instruction.
The block diagram in Figure 20-7 shows the electronic component blocks and the data flow for the Temperature Indicator. A Fritzing electronic circuit schematic diagram of the Temperature Indicator is shown in Figure 20-8. Electrical/electronic engineers use circuit schematic diagrams to design, build, and test cool interactive electronic products for society.
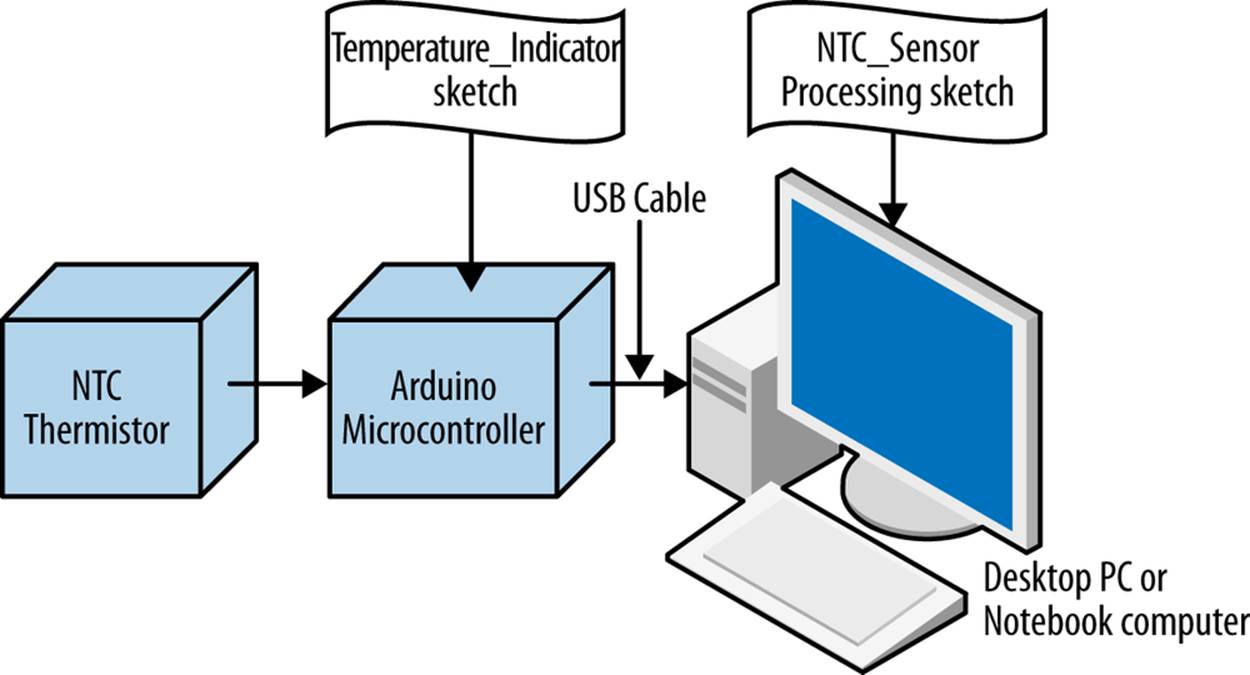
Figure 20-7. The Temperature Indicator block diagram
Something to Think About
How can a second LED be wired to the Arduino microcontroller to display when the temperature falls below a certain threshold?
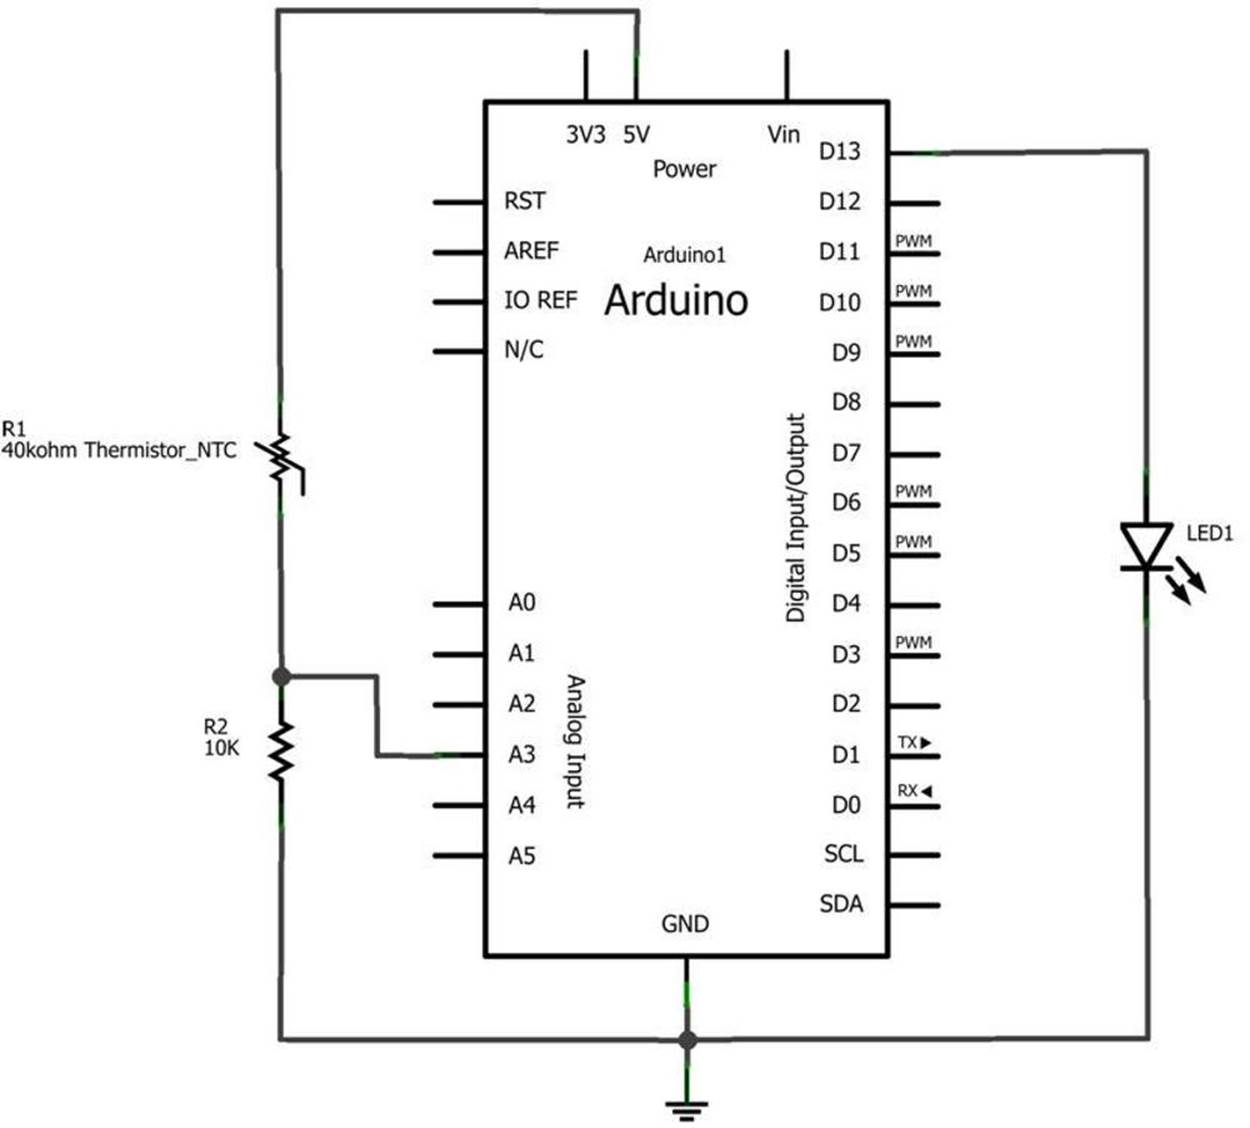
Figure 20-8. The Temperature Indicator Fritzing circuit schematic diagram
All materials on the site are licensed Creative Commons Attribution-Sharealike 3.0 Unported CC BY-SA 3.0 & GNU Free Documentation License (GFDL)
If you are the copyright holder of any material contained on our site and intend to remove it, please contact our site administrator for approval.
© 2016-2026 All site design rights belong to S.Y.A.