HTML5, JavaScript and jQuery (Programmer to Programmer) - 2015
Part III HTML5 Multimedia
Lesson 24 Canvas: Part I
The HTML5 canvas element provides a canvas for capturing bitmap images. The Canvas API, on the other hand, allows you to interact with the canvas element using JavaScript. The canvas can be used for simple drawing, such as shapes and lines, and for more advanced features, such as animation. The canvas element and API provide an alternative to plugins such as Adobe Flash.
This lesson covers the basics of the Canvas API; the next lesson covers some of the advanced features. Although the features covered in this lesson appear quite basic, they can still be combined to construct complex images.
The Canvas API is, however, a reasonably low-level API. This has the benefit of making almost anything possible, but it also means that it is sometimes tedious to perform relatively simple operations.
The canvas element creates a bitmap (or raster) image. Essentially, this means that each pixel on the screen is represented by a position in memory that describes the color of the pixel.
Note
Originally, bitmap images were referred to as bitmaps because each pixel could have a 0 or 1 value to denote black or white. Because the canvas supports multiple colors, it is technically a pixmap.
The other major category of image is vector graphics. Vector graphics describe shapes as mathematical formulas, and therefore do not need to store information about every pixel. The shapes can then be assigned properties such as their fill color. Vector graphics work extremely well when the user may zoom into the image because the quality of the image remains the same regardless of how far the user zooms in.
Note
Browsers do also support vector graphics natively, in the form of SVG, but that is beyond the scope of this book.
In order to get started with the HTML5 canvas, you need to add a canvas element to the web page. In addition, it is customary to provide it with an ID to allow it to be selected:
<canvas width="800" height="500" id="myCanvas"></canvas>
Notice also that the height and width have both been specified to control the size the canvas onscreen. Because the height and width default to 0, these are mandatory, unless you use CSS to control the size of the canvas.
If you open this web page, you will see a white screen. Although the canvas is present, every pixel is colored white by default, and therefore you will not see anything.
With the canvas in place, you can start using the Canvas API to begin drawing shapes on the canvas. In order to draw a shape, you need to describe:
· Where on the canvas the shape should appear
· The type of shape you wish to draw, along with its size
· Any other properties associated with the shape, such as its color
I will address these needs one at a time in the sections that follow.
Simple Drawing
The Canvas API uses pixels for specifying sizes. If you wish to draw a new shape onto the canvas, you need to specify the coordinates of the shape relative to the top-left corner of the canvas. The top-left corner can be thought of as having a position of 0, 0. You can therefore specify the position of the shape, relative to this position, using x and y coordinates.
For instance, if you wanted the shape to be drawn 200 pixels from the top of the screen and 300 pixels from the left of the screen, you would use a position of 300, 200 as the top-left corner of the shape. The x-axis is always specified first, and represents the horizontal axis, while the y-axis represents the vertical axis.
Suppose you are drawing a rectangle: You would also need to specify the height and width of the rectangle.
Once you determine these properties, you can obtain a reference to the canvas's graphical context, and use the JavaScript API to draw the shape, a rectangle in this case:
<canvas width="800" height="500" id="myCanvas"></canvas>
<script>
var context = $('#myCanvas')[0].getContext("2d");
context.fillRect(300, 200, 100, 200);
</script>
Note
If following along the examples in this lesson, ensure the code is placed inside an HTML5 page structure, and that the jQuery library is included in the head section.
When the canvas context is requested, it must include the parameter 2d because the canvas element can also support 3D APIs, most notably WebGL. This API is outside the scope of this book and is not currently well supported.
Notice that the fillRect method accepts four parameters:
· The x-position of the rectangle
· The y-position of the rectangle
· The width of the rectangle
· The height of the rectangle
This code produces the shape shown in Figure 24.1.

Figure 24.1
By default, the rectangle will be filled with a black color, but this can easily be overridden by specifying the fillStyle for the canvas context:
<script>
var context = $('#myCanvas')[0].getContext("2d");
context.fillStyle = 'red';
context.fillRect(300, 200, 100, 200);
</script>
Shapes can overlap on the canvas, but in this case the last shape drawn simply overwrites the pixels of the shape below it. For instance, the following code:
<script>
var context = $('#myCanvas')[0].getContext("2d");
context.fillStyle = 'lightgrey';
context.fillRect(300, 200, 100, 200);
context.fillStyle = 'grey';
context.fillRect(50, 300, 400, 100);
</script>
produces the result shown in Figure 24.2. Notice that the light-grey shape appears behind the grey shape.
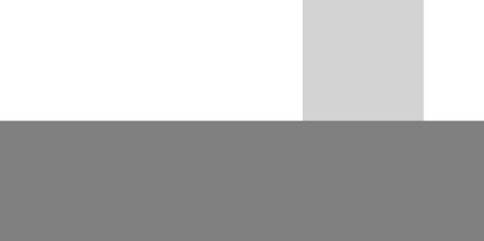
Figure 24.2
It is also possible to specify the border of a rectangle without coloring the fill area. This can be achieved by using strokeRect, as you can see in the following example:
<script>
var context = $('#myCanvas')[0].getContext("2d");
context.fillStyle = 'lightgrey';
context.fillRect(300, 200, 100, 200);
context.strokeStyle = 'grey';
context.lineWidth = 3;
context.strokeRect(50, 300, 400, 100);
</script>
This produces the drawing shown in Figure 24.3.
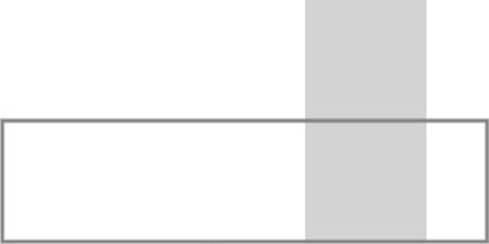
Figure 24.3
Drawing Lines
Rectangles can only take you so far; to draw more complex shapes you need to use lines. For instance, the API does not provide a method for drawing triangles, but it is easy to draw one as follows:
<script>
var context = $('#myCanvas')[0].getContext("2d");
context.beginPath();
context.moveTo(100,20);
context.lineTo(30,100);
context.lineTo(170,100);
context.fill();
</script>
You begin by specifying that you are beginning a path, and then use moveTo to move to the position you want to start drawing from. You then specify that you want to draw from here to another point using lineTo. You can then call lineTo as many times as necessary, each time specifying the coordinates you want the line to end up at.
In this example, you have only specified two of the three sides for the triangle, but when you call fill, the third line is implied because it is only possible to fill a closed shape. This code therefore produces the drawing shown in Figure 24.4.

Figure 24.4
It is also possible to draw the outline of the shape by using the stroke method.
<script>
var context = $('#myCanvas')[0].getContext("2d");
context.beginPath();
context.moveTo(100,20);
context.lineTo(30,100);
context.lineTo(170,100);
context.lineTo(100,20);
context.stroke();
</script>
In this case, however, it would be necessary to specify all three lines of the triangle; alternatively, the third lineTo call could be replaced with the following line of code:
context.closePath();
Circles and Curves
The Canvas API also provides methods for drawing curved lines and shapes such as circles. This can be achieved with the arc method, as shown in the following example:
<script>
var context = $('#myCanvas')[0].getContext("2d");
context.beginPath();
context.arc(70, 70, 50, 0, 2 * Math.PI, true)
context.fill();
</script>
The arc method accepts the following parameters:
· The x and y coordinates for the center of the circle, which have both been specified as 70.
· The radius of the circle in pixels.
· The starting angle in radians—a value of 0 is equivalent to the three o'clock position on a clock.
· The ending position in radians: 2 * Math.PI is equivalent to 360 degrees, whereas Math.PI would be equivalent to 180 degrees.
· A fifth parameter is also accepted, which specifies whether the arc should be drawn clockwise or counter clockwise, with the default being false, which indicates clockwise. This is not relevant if drawing a full circle.
This example produces the circle shown in Figure 24.5.
Figure 24.5
It is also possible to draw the outline of a circle without filling it by using the stroke method. The following example draws an arc beginning at 0 radians, and ending at 0.5 * Math.PI, which is equivalent to 6 o'clock. This particular example is drawn counter-clockwise, meaning the line extends 270 degrees:
<script>
var context = $('#myCanvas')[0].getContext("2d");
context.beginPath();
context.arc(70, 70, 50, 0, 0.5 * Math.PI, true);
context.stroke();
</script>
This code produces the line shown in Figure 24.6.
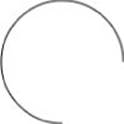
Figure 24.6
It is also possible to draw an arc between two points using the arcTo method. This method lets you specify the coordinates for two tangents to the curve and then define the radius of a circle that would touch those two tangents. This method is slightly more difficult to explain, but assume that you started from the coordinates of 50,50:
context.moveTo(50,50);
Next, you specify that the coordinates of the first tangent are 150, 20. You would therefore draw an imaginary line between 50, 50 and 150, 20. Next, you draw an imaginary line from this point to a second point specified—for example, 150, 150. You therefore have specified the imaginary lines shown in Figure 24.7.
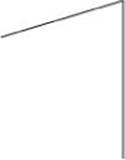
Figure 24.7
Now you specify that the radius of the circle that touches these tangents is 80 pixels:
var context = $('#myCanvas')[0].getContext("2d");
context.beginPath();
context.moveTo(50,50);
context.arcTo(150,20,150,150,80);
context.stroke();
This effectively creates the imaginary circle shown in Figure 24.9, and therefore creates the arc shown in Figure 24.8.
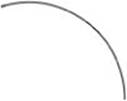
Figure 24.8
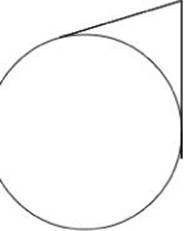
Figure 24.9
Drawing Text
The final feature this lesson will cover is text. It is possible to draw text onto the canvas using the fillText method, as shown in the following example:
<script>
var context = $('#myCanvas')[0].getContext("2d");
context.font="20px Courier";
context.fillText("Hello World!",20,50);
</script>
Notice that the font of the context is set, and then the fillText is called with the relevant text and the coordinates for the text to start at. The coordinates represent the bottom-left corner of the text; therefore, it is not possible to specify 0 for the y-axis because the text would be positioned above the canvas.
The preceding example produces the result shown in Figure 24.10.
Figure 24.10
Adding text to a canvas is not like adding text to an HTML document. The text will not wrap if it reaches the right-hand edge of the canvas, and there are no checks to ensure that the text displays on the canvas at all. It is possible to specify a forth parameter tofillText, which specifies the maximum width of the text, but this will not cause text to wrap.
To help with issues positioning text, the Canvas API does support a measureText method. This allows you to determine the width of an arbitrary string of text, given the current font. For example:
context.measureText("Hello World");
The Canvas API also supports a strokeText method. This is identical to fillText, except it only draws the outline of the text. For example, the following code:
<script>
var context = $('#myCanvas')[0].getContext("2d");
context.font="30px Georgia";
context.strokeText("Hello World!",20,50);
</script>
produces the text shown in Figure 24.11.
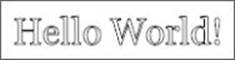
Figure 24.11
Try It
In this Try It, you are going to create a “random walk.” Random walks are often used to describe price movements of commodities, stocks, and currencies in economics, and are derived by imagining the path followed by a drunk who wakes at intermittent intervals and staggers in a random direction.
In this Try It, you will perform 10,000 random walks, each time moving 3 pixels up, down, left, or right from a given starting position. The pattern created each time you run this will be different, but Figure 24.12 shows an example I created.
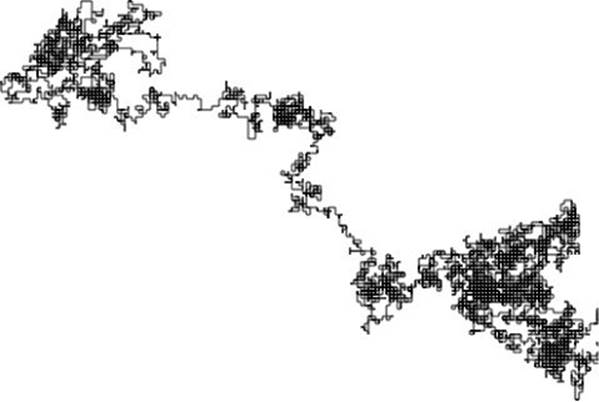
Figure 24.12
Lesson Requirements
You will need a text editor for writing the code and the Chrome browser for running the code.
Step-by-Step
1. Start by creating a standard HTML5 web page, and include an import for jQuery.
2. Add a canvas element to the web page, assign it an ID, and give it a width and height of 800.
3. Start by finding the canvas element, and call getContext(”2d”) on it, assigning the result to a variable called context.
4. Call beginPath on the context, and then use the moveTo method to move to the center of the canvas.
5. Create two variables to record the current X and Y coordinates. These should be initialized to the values you passed to the moveTo method.
6. Create a for-loop that iterates 10,000 times. Steps 7–10 will occur inside the for-loop.
7. Start be creating a random number using Math.random(), and assign this to a variable.
8. Create an if-else block that has four branches depending on whether the random number is:
· Less than 0.25
· Less than 0.5
· Less than 0.75
· Less than 1
9. Within each of these four blocks, perform one of these four operations (making sure each operation is performed in one, and only one, branch):
· Subtract 3 from the current Y coordinate.
· Add 3 to the current Y coordinate.
· Subtract 3 from the current X coordinate.
· Add 3 to the current X coordinate.
10.Use the lineTo method to move to the new X and Y coordinates.
11.After the for-loop finishes, call stroke on the context.
12.You can try running the web page as many times as you like. Each time you run it, you will be surprised at how different the patterns look.
My version of the JavaScript supporting this page looked like this:
<script>
var context = $('#myCanvas')[0].getContext("2d");
context.beginPath();
context.moveTo(400,400);
var currentX = 400;
var currentY = 400;
for (var i = 0; i < 10000; i++) {
var r = Math.random();
console.log(r);
if (r < 0.25) {
currentX = currentX-3;
} else if (r < 0.5) {
currentX = currentX + 3;
} else if (r < 0.75) {
currentY = currentY - 3;
} else {
currentY = currentY + 3;
}
console.log('Moving to ' + currentX + ' ' + currentY);
context.lineTo(currentX, currentY);
}
context.stroke();
</script>
Reference
Please go to the book's website at www.wrox.com/go/html5jsjquery24hr to view the video for Lesson 24, as well as download the code and resources for this lesson.