Neo4j in Action (2015)
Part 1. Introduction to Neo4j
Chapter 2. Data modeling in Neo4j
This chapter covers
· Why we need a data model for Neo4j
· Domain modeling
· Exploring additional domains
In this chapter, we’re going to talk about how and why we model data in Neo4j, and discuss approaches to data modeling in a graph database. We’ll look at alternative ways to model a given domain, making use of nodes, relationships, properties and labels in different ways. We’ll also present examples from different domains to give a sense of how flexible data modeling in Neo4j can be.
We’ll look at queries written in the Cypher query language. These are shown purely for illustration, to give an idea of how simple it is to query the models shown here: you don’t need to know anything about Cypher to start modeling data, and the language will be introduced in more detail later on.
2.1. What is a data model for Neo4j?
Unlike a traditional RDBMS (relational database management system), Neo4j is a schemaless database. You don’t need to define tables and relationships before you can start adding data. A node can have any properties you like, and any node can be related to any other node. The data model for a Neo4j database is implicit in the data it contains, rather than explicitly defined as part of the database itself. It’s a description of what you want to put in your database, rather than a set of prescriptions enforced by the database that constrain what it will accept.
Because Neo4j data modeling is descriptive rather than prescriptive, it’s easy to make changes when your application’s view of the world expands or alters. But it’s also useful to have a consistent description of the data the database will contain, so that you can frame queries in the expectation that similar entities will be represented in similar ways. The Neo4j query language, Cypher, works by matching patterns in the data, so one way to see your data model is as an inventory of basic patterns. For example,
· A person lives at an address.
· An underground station is connected to another underground station on an underground line.
· A smartphone bundle includes a smartphone and a call allowance.
These patterns fit collections of facts:
· Peter lives at The Gables. Mary lives at 13 Acacia Avenue.
· Bank Station is connected to Moorgate Station. Bank Station and Moorgate Station are both on the Northern Line.
· The light usage bundle includes a FictoPhone smartphone, and 150 minutes per month of mobile-to-mobile calls.
Once you have a consistent description of the data that will be stored in the database, you can use this description to reason about the queries you’ll put to that database in the future.
A common way of expressing such a description is through diagrams. By drawing fragments of graphs that represent common patterns in your data, you can visualize your model in an intuitive way. In the early stages of Neo4j data modeling, a pen and a whiteboard, a sheet of paper, or a napkin is often all you need to start discussing what your data will look like.
2.1.1. Modeling with diagrams: a simple example
Suppose that instead of friendships between individuals, you were interested in modeling associations between groups of people. A group might contain several people, and a person might belong to several groups. In a traditional RDBMS, you’d typically model this scenario using three tables: a table for people, a table for groups, and a join table that would be used to link people to groups in a many-to-many relationship (figure 2.1).
Figure 2.1. Users and groups in an RDBMS with a join table
![]()
In Neo4j, you could model the same scenario by representing users and groups as nodes, and group membership as a relationship between nodes (figure 2.2).
Figure 2.2. A person belongs to a group.
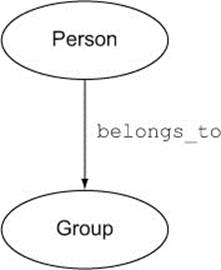
Here you can see that nodes are, roughly, the entities of the data model (in RDBMS terms) of a graph database, and relationships are, unsurprisingly, the relationships or connections between nodes. The plain English sentence that corresponds to this diagram is “A person belongs to a group.”
Let’s see how that looks with several people, and several groups (figure 2.3).
Figure 2.3. Three people in two groups
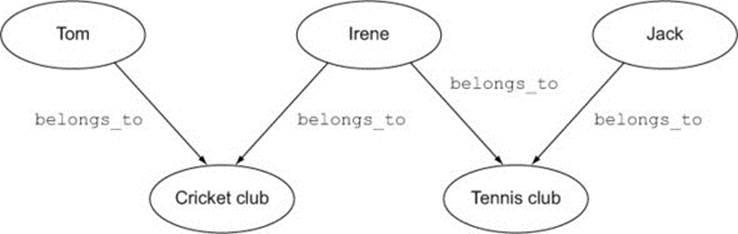
The pattern shown in figure 2.2 appears in the figure 2.3 diagram in several places; in fact, the whole diagram can be composed by overlaying copies of figure 2.2 on top of each other.
When it comes to querying the data in this model, there are two questions you might want to answer. First, for a given person, to what groups does that person belong? Second, for a given group, what people belong to that group? Both queries are easy to express in Neo4j’s query language, Cypher:
It seems that this model is suitable for our use cases. By starting with a simple relationship, “a person belongs to a group,” we’ve been able to generate a more complex graph by just repeating that relationship. Our initial graph fragment in figure 2.2 actually captures the entire model.
With more complex models, it sometimes makes sense to work in the opposite direction. You can do this by first drawing a diagram showing examples of all the different kinds of things in your system as nodes, then drawing arrows showing all the different kinds of relationships between them. Once you start seeing repeated patterns, you can pull those out into smaller graph fragments.
2.1.2. Modeling with diagrams: a complex example
Let’s take a much more varied example, and see how it can be broken down into smaller patterns. In a large organization, users are given permissions to access different systems based on who they are, what roles they hold, and which groups they belong to. Here are examples of ways in which a user might have a permission.
· Directly —You have permission to access the files in your own personal folder on the shared filesystem.
· Based on a role —As a database administrator, you have permission to connect to the database-monitoring console.
· Based on a group membership —As a member of the group Sales and Marketing Team, you have permission to access the Contact Management System.
· Based on the assignment of a role to all members of a group —As a member of the group Developers, all of whom have the role Source Control Committer, you have permissions to check code out of the source repository and commit changes back in.
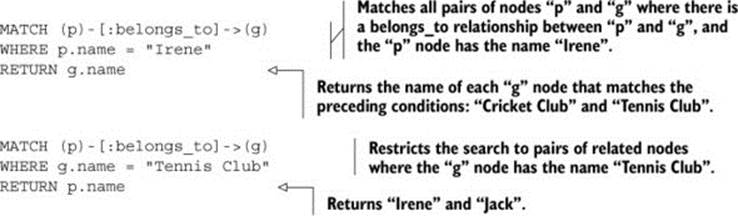
Figure 2.4 is an unconnected graph showing the entities in an access control system that enforces these permissions.
Figure 2.4. The entities in an access control system
Figure 2.5 shows the same graph, with the possible relationships between these entities drawn in.
Figure 2.5. Relationships between entities in the access control system
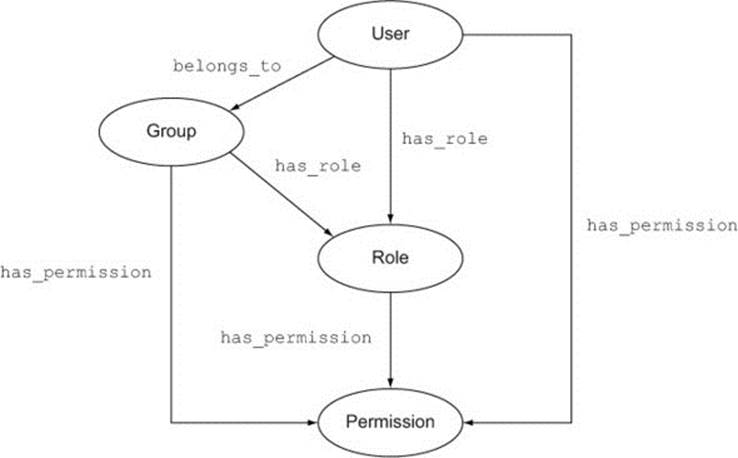
As you can see, there are several possible paths from a User to a Permission. In order to find out what permissions a user has, you need to find all the Permission nodes that a User node is connected to, via any path. In a traditional RDBMS, this would require a complex query expressing the union of each of the different kinds of paths:
· From User directly to Permission (one table join)
· From User to Group to Permission (two table joins)
· From User to Role to Permission (two table joins)
· From User to Group to Role to Permission (three table joins)
In Cypher, a single short query will suffice:
MATCH (u:User)-[*]->(p:Permission)
WHERE u.name = "User name"
RETURN DISTINCT p.name
This will match any pair of nodes where the first is labeled as a User having the specified name property value, the second is labeled as a Permission, and there is a path of any length between them. Finally, it returns the distinct names of all of the Permission nodes it has matched.
Now suppose you want to add a new feature to this model, reflecting the organization’s hierarchical structure. Not only can users belong to groups, groups can be subgroups of larger groups—Testers, UX Designers, and Coders could be subgroups of the group Development, for example. Figure 2.6 shows the new model, extended with a subgroup_of relationship between groups.
Figure 2.6. The access control model extended to support subgroups
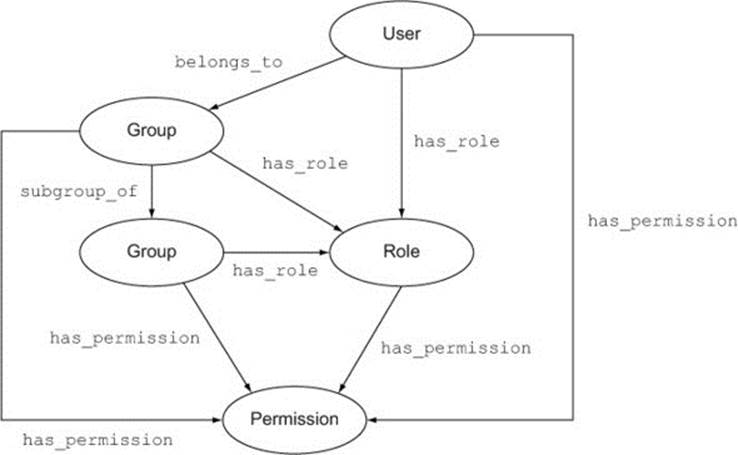
Changing the RDBMS query to support this scenario would be a non-trivial task, but the Cypher query that worked with the initial model will work just as well with the extended one, because it is indifferent to how you get from a User to a Permission.
2.2. Domain modeling
In the model discussed in the previous section, the nodes carried very little extra information about themselves, besides their identifying names. It was intuitively clear how the domain entities—Users, Groups, Roles, and Permissions—should be represented by nodes in the graph. But not everything has to be a node; for example, there weren’t any nodes for users’ names, which were instead modeled as properties on User nodes.
Properties are an important part of Neo4j’s data model, and they’re also an important way in which it differs from the RDBMS model. In Neo4j, both nodes and relationships can have any number of properties, which are essentially key/value pairs (for example, name/“Irene”). They are normally used to store the specific properties of nodes and relationships.
Let’s consider a scenario where the distinction between an entity (modeled with a node) and a property of an entity is less intuitively obvious.
2.2.1. Entities and properties
Sometimes when people first begin modeling with Neo4j, they come up with diagrams that look a bit like figure 2.7.
Figure 2.7. A User with some properties
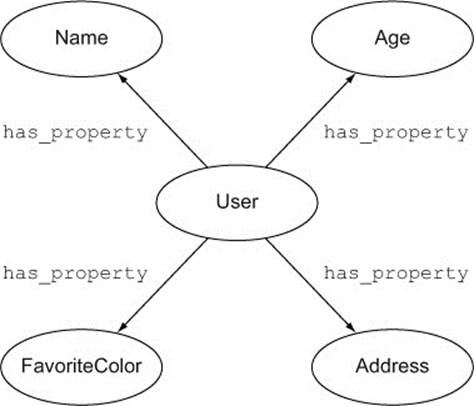
There may be some scenarios in which this is exactly the right way to model a user and their properties, but there are some warning signs here. If you see a relationship labeled has_property or similar, consider whether the node on the other end of the connection really needs to be a node. Unless, for some reason, you wanted to link users together based on their favorite colors, there’s probably no need for FavoriteColor to be modeled as a node; it could be an property on the User node. The same is true for the name and age properties.
If you convert these nodes into properties on the User node, and rename the remaining has_property relationship so that it more closely describes the relationship the User has with their Address, then the diagram will look like figure 2.8.
Figure 2.8. The user with some nodes converted to properties
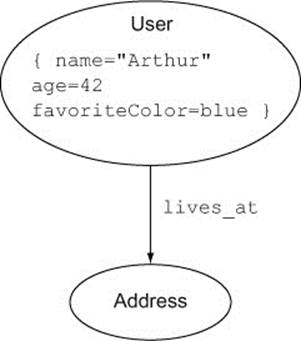
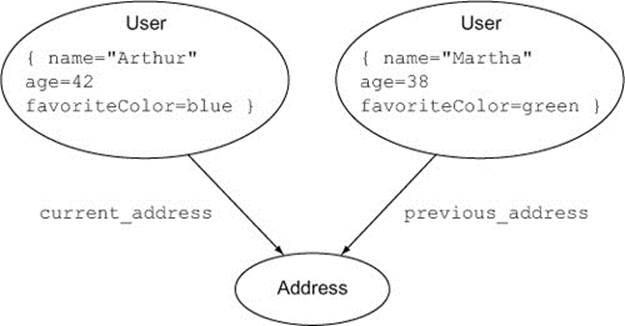
Address is different from Name, Age, and FavoriteColor, because you might be interested in using shared addresses to connect users to each other. A user who has moved house might have a current and a previous address, or a list of historical addresses. Accordingly, it may make sense to model addresses as entities, represented by nodes of their own.
Now suppose you want to distinguish between a user’s current and previous addresses. One way to do this would be to attach an is_current flag to the address node as an property. But if two users had lived at the same address, and one was the current and the other a previous occupant, then whatever value this flag had would be false for one of them. Being a user’s current address is not a property of the address itself, or of the user, but of the relationship between them—a relationship that may change over time, as users move from one address to another.
There are at least three ways to represent the fact that an address is a user’s current address. The first is to label the relationship itself differently, as in figure 2.9.
Figure 2.9. Two users with different relationships to the same address
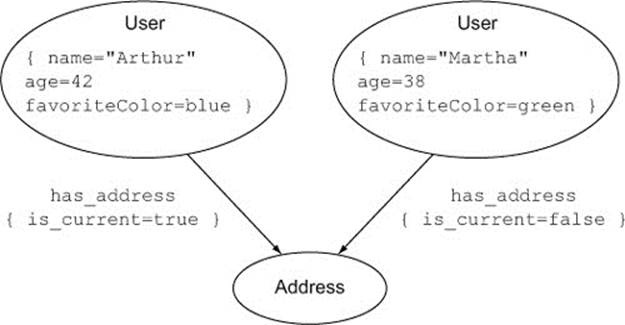
The second is to set an property on the relationship itself, as in figure 2.10. You might do this if you wanted to link users to addresses regardless of whether or not they currently live at them, and having different relationship types would complicate your queries.
Figure 2.10. Two users with differently qualified relationships to the same address
The third way is to treat the user’s occupancy of an address as a node in its own right. This is a technique called reification (literally, “making into a thing”), where a relationship between two nodes is broken into two relationships joined together by an intermediate node that represents the original relationship. This is useful when the relationship itself has relationships with other entities; for example, if a user’s occupancy of an address is under a tenancy, managed by a letting agency. Figure 2.11 shows how this might work.
Figure 2.11. Reifying the relationship between a User and an Address in order to introduce other participants
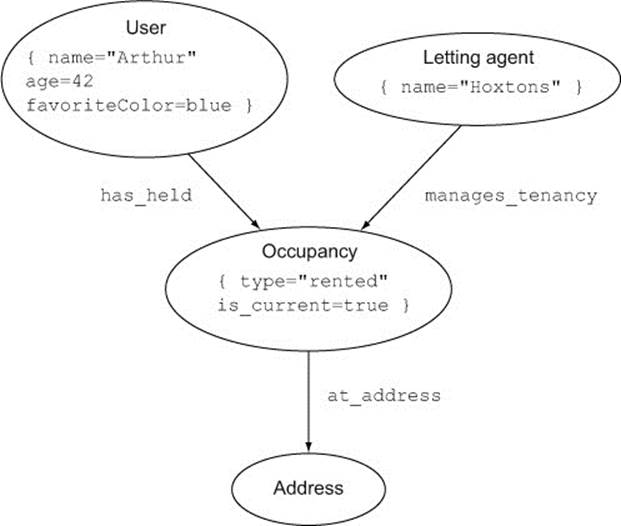
In this case, the flag indicating whether the occupancy is current has been added to the Occupancy node itself. But it could also be made a property of the has_held relationship, or two different relationship labels could be used for current or previous occupancies.
Another consideration when deciding whether to model the properties of entities using nodes is the efficiency with which the query engine can traverse the graph. It’s usually not a good idea, for example, to extend a node’s data by placing it in a relationship to another node whose only purpose is to hold additional properties, as in figure 2.12.
Figure 2.12. A User with additional properties stored in a related UserEx node
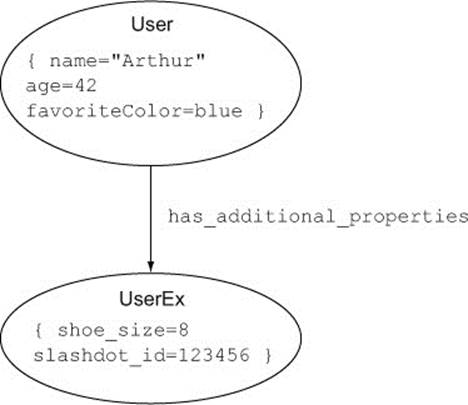
A better approach here would be to apply a label to the User node indicating that it has an extended property set, and place the extra properties directly on the User node itself. Labels are a powerful mechanism, introduced in Neo4j version 2.0, for assigning nodes to collections. A node can have multiple labels, so nodes can be treated as belonging to multiple, possibly overlapping, collections. By writing queries that target nodes with specific labels, you can do two things:
· Improve the performance of queries by reducing the number of nodes they have to consider when traversing the graph in search of pattern matches.
· Simplify queries by using labels to assert that nodes will have particular properties, so that queries don’t have to handle the possibility of missing properties values.
You’ve seen labels used in the Cypher query examples given in this chapter: an expression like (u:User) matches a node with the User label, and it will ignore any other nodes.
Ultimately what should decide the representation you’re going to use is the ease with which the patterns it contains can be queried and traversed. If it’s difficult to see how two pieces of information are connected, but in reality their relationship is very straightforward, then consider linking them more directly in your graph. If you have nodes whose only purpose is to hold pieces of information belonging to other entities, consider moving that information into a property on that entity.
Don’t be too worried, at this stage, about finding the right model. It’s easy to refactor graphs using Cypher later on, to make explicit relationships that are only implicit in your current model. There’s no such thing as a normal form for a graph database—only the form that best suits your application.
2.3. Further examples
We’ll conclude this chapter with a couple of examples from different domains, both to illustrate the range of situations that can be modeled in Neo4j and to illustrate two pairs of opposing concepts: whether elements in the model are represented implicitly or explicitly in the graph, and whether data is generally invariant or variable.
To begin, let’s revisit the underground stations example mentioned earlier.
2.3.1. Underground stations example
Our first example deals with the question of when you should model a particular aspect of your data explicitly, representing that aspect directly using nodes and relationships, and when you should allow that aspect to remain implicit in the data (but recoverable through querying). In this example, we’ll model the stations, lines, and connections in the London underground system. We’re interested in two things: which stations are directly connected to each other, and which stations are on which lines.
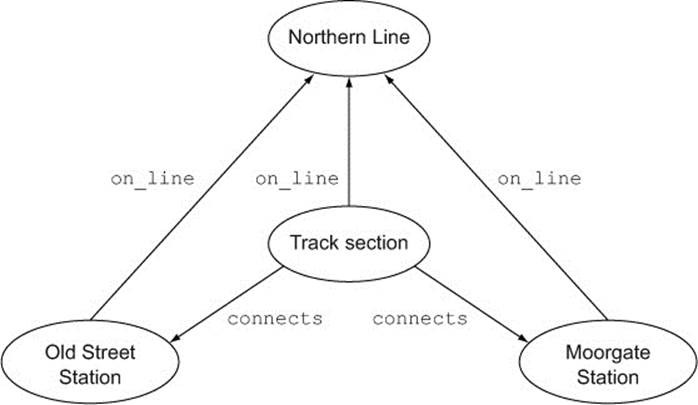
The big question here is whether or not to model underground lines directly as nodes, or implicitly as properties on relationships. If you model them as nodes, then you might have to connect every station and every section of track to the line it belongs to, as in figure 2.13.
Figure 2.13. Two underground stations, with the connection between them reified as a single Track Section
This is quite a busy model, and your graph will quickly become very complex if you try to model multiple lines running through multiple stations. Alternatively, if you model underground lines as properties on relationships, then your graph is much simpler—figure 2.14 shows two stations connected by two different lines.
Figure 2.14. Two underground stations, with connections on two different lines
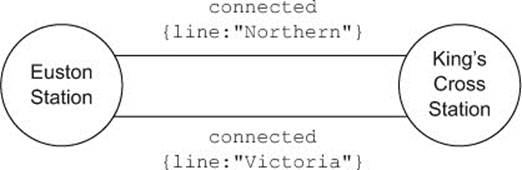
In order to know what lines Euston station is on, however, you now have to find out what connections it has to other stations. Fortunately, you can do this easily enough with a Cypher query:
![]()
This will find all of the connections between Euston and any other station, and return the distinct line property values of all of those connections.
Both of these two ways of modeling the tube system are capable of containing exactly the same information. It would be possible to write queries to transform a graph modeled in the first way into a graph modeled in the second, and back again, without losing any detail. So how do you choose which way is best? The answer mainly depends on how you’re going to populate your database, and how you’re going to query it.
If, as in the first model, you have to create and manage explicit nodes and relationships to represent the existence of train lines and the fact that certain stations are on certain lines, then the database may be more unwieldy, and harder to visualize clearly, than one in which the only nodes are those representing stations, and the only relationships are those representing connections between stations. Running a query to find all of the stations that are on a particular line would be very quick, as the Neo4j database engine will only have to follow the relationships from a single node to all of its immediately connected nodes:
![]()
This will run very quickly if you have an index on the name property of Line nodes, as the Neo4j query engine will be able to use that index to pick out its starting node.
The corresponding query against the second model will require a much more complex traversal of the graph in order to get its results.
![]()
In this case, the engine must consider every connected relationship between a pair of Station nodes, gather up all the nodes where the relationship has the required line property, and return all the unique Station names. If this is a query you’re likely to want to run often, it may be worth considering surfacing the information it recovers by creating explicit nodes and relationships that represent that information.
What this example shows is that sometimes it makes sense to have some of the entities in your domain model remain implicit in the graph, rather than represent them explicitly with dedicated nodes. Conversely, it’s sometimes worth surfacing implicit information and making it explicit so that it can be found more quickly by Neo4j’s query engine.
2.3.2. Band members example
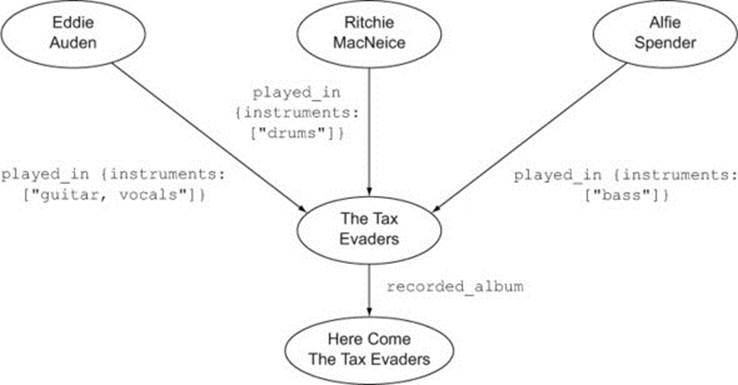
Our second example concerns modeling data to deal with information that changes over time, so that you can separate invariant aspects of the data from varying aspects. Suppose you want to keep track of which musicians played which instruments on recordings by various rock bands. A simple model might look like figure 2.15.
Figure 2.15. A simple model showing band members and a recorded album
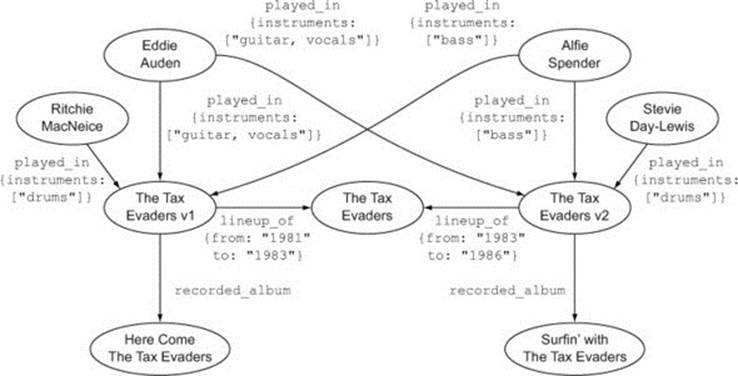
One problem with this model is that bands sometimes change their members. In order to handle changes like this, you may need to create intermediate nodes that represent a state of affairs at a certain time. You could introduce lineup nodes representing the membership of a band at the point when a particular album was recorded, as in figure 2.16.
Figure 2.16. A more complex model showing two different lineups of the same band
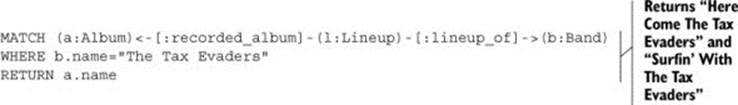
With this model, you can easily find all of the albums recorded by (any lineup of) The Tax Evaders:
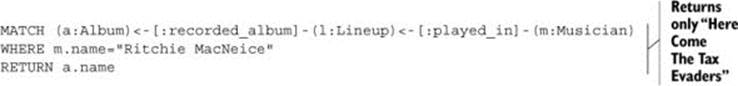
But you could just as easily query for just those albums on which Ritchie MacNeice played drums:
The invariant information in this graph is that there exists a band called The Tax Evaders—it keeps its identity even though its membership varies. You can represent variations in the composition of The Tax Evaders using nodes that represent its states at different moments in time, and use the lineup_of relationship to link these states to the central node, indicating that they are different states of the same thing. Likewise, the identities of the various musicians who have played in The Tax Evaders remain the same, even though their relationship to the band (and possibly other bands) will change over time.
This example demonstrates a use of reification—representing a relationship between entities, such as musicians and a band, as a node in its own right. The concept of a lineup as a thing representing the composition of a band at a particular moment in time turns out to be indispensable in the fast-moving world of rock and roll; reification is equally useful in less glamorous contexts, such as modeling the relationships between people and the addresses they live at, or software licenses and the computers they’re activated on.
2.4. Summary
In this chapter you’ve seen how flexible data modeling for Neo4j can be, and how there may be several possible representations of the same domain. It’s easy to start modeling with just pencil and paper, but you should be prepared to try putting the same data in different places—as properties on nodes, or on relationships, or pulled out into a node of its own.
We’ve considered some strategies for modeling data in a way that suits particular patterns of querying, choosing which data is to be explicitly represented by nodes and what can be left implicit and later inferred from queryable patterns within the data. We’ve also looked at data that changes over time and seen one pattern for modeling a mixture of variable and invariant data.
The examples you’ve seen in this chapter show the diversity of applications to which graph data modeling is suited. In the next chapter, you’ll see how to traverse your model in order to retrieve data efficiently and powerfully.