UX Strategy: How to Devise Innovative Digital Products That People Want (2015)
Chapter 9. Designing for Conversion
You can’t play in the man’s game, you can’t close them — go home and tell your wife your troubles. Because only one thing counts in this life: Get them to sign on the line which is dotted. A-B-C. A-Always, B-Be, C-Closing.
— BLAKE FROM THE DAVID MAMET SCREENPLAY, GLENGARRY GLEN ROSS
IF YOU WANT TO BE A CLOSER, YOU MUST CONSTANTLY TWEAK YOUR UX strategy to increase successful outcomes for user engagement and customer acquisition. You need to design efficient funnels that do everything from engage first-time visitors to eventually convert them to repeat customers. Customers include anybody and everybody that you need to engage for your value proposition and business model to work. And yes, users who don’t pay for your service are customers, too. As people begin entering from the top of the funnel, you must immediately track and measure all the crucial data points along the way so that you can validate your product’s success.
This is known as designing for conversion or optimizing your product. The process ties together all the tenets, as depicted in Figure 9-1. In this chapter, I’ll demonstrate how successful UX strategy uses analytics to optimize the UX design from the user’s first impression of the value prop to the user becoming happily addicted to the product. A tool called the Funnel Matrix will demonstrate how to align your entire team on different stages of customer acquisition by identifying measurable metrics for them to take action on to pull the customer into a deeper level of engagement.
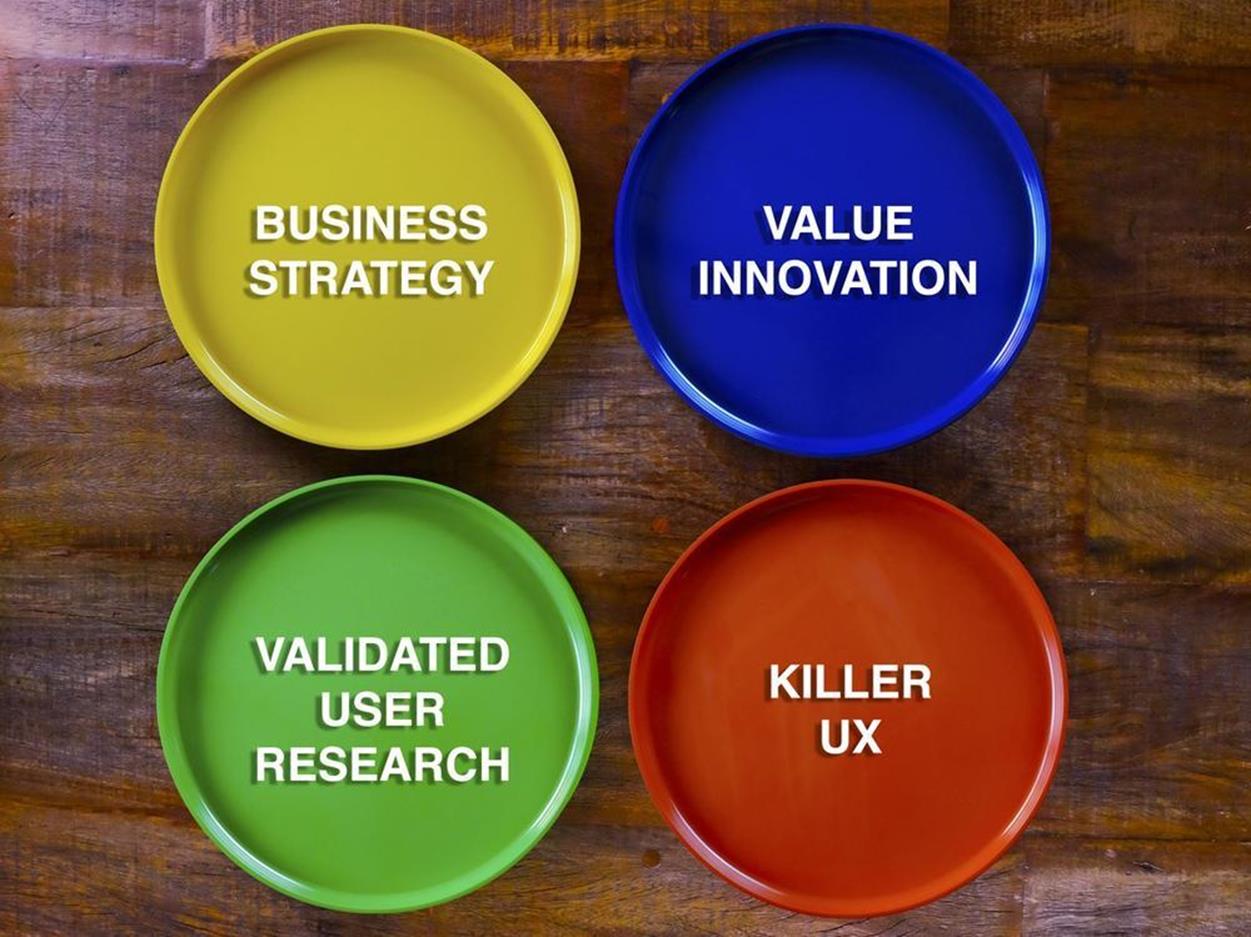
Figure 9-1. The four tenets of UX strategy all need to be served up right now
Seeding Growth Hackers
Growth hacking is a term coined in 2010 by Sean Ellis, a marketing blogger and entrepreneur.[63] The concept behind it is for product teams to come up with extremely clever, cost-efficient ways to increase customer growth. Facebook, Twitter, LinkedIn, Airbnb, and Dropbox are companies that have all used growth hacking techniques to become successful. Hardcore growth hackers are a crossbreed of marketers, coders, and analytics experts. They are masters of analytics tools, traffic generation, and product optimization with a deep understanding of the innards of search-engine optimization (SEO), ad platforms, and social media tools. They are called hackers because they are ruthlessly focused on growing the business by any means necessary. They push the limits of traditional marketing using techniques such as A/B tests, landing pages, viral factors, email deliverability, and social media integration. The goal of growth hacking is to tie viral and paid ad campaigns to user engagement metrics so that you can identify the most valuable marketing channels. Growth hacking entails continuous tinkering with the product’s sales funnel so that it is fully optimized for acquiring new users and getting them more deeply engaged.
In the case of TradeYa, our core team knew we were out of our depth. We could design, strategize, and develop the MVP. We could fill out the Funnel Matrix — we knew what kind of answers we needed. What we didn’t have was the expertise to get those answers from the metrics and analytics reports in front of us. We didn’t know how all the tools and dashboards worked, but we had to run hardcore tests to refine and perfect our MVP to relaunch in 30 days. It was the Christmas holidays, and we were pretty sure it was a fantasy to hope for a highly advanced growth hacker with usability testing and design skills to end up at our door. Plus, we had a budget of only about $5,000. So, we decided to hack together some growth hackers of our own.
That’s how the TradeYa MVP Apprentice Program was born. Jared and I wanted to diversify our budget with as many fresh minds as possible who would work collaboratively on connecting all the analytical tools we needed to update the existing MVP. They would use the Funnel Matrix to plug in the feedback data from each other of their initiatives so that we could validate all the assumptions the core team had made about the levels of user engagement. Figure 9-2 shows the blog post we used to attract the talent we needed.
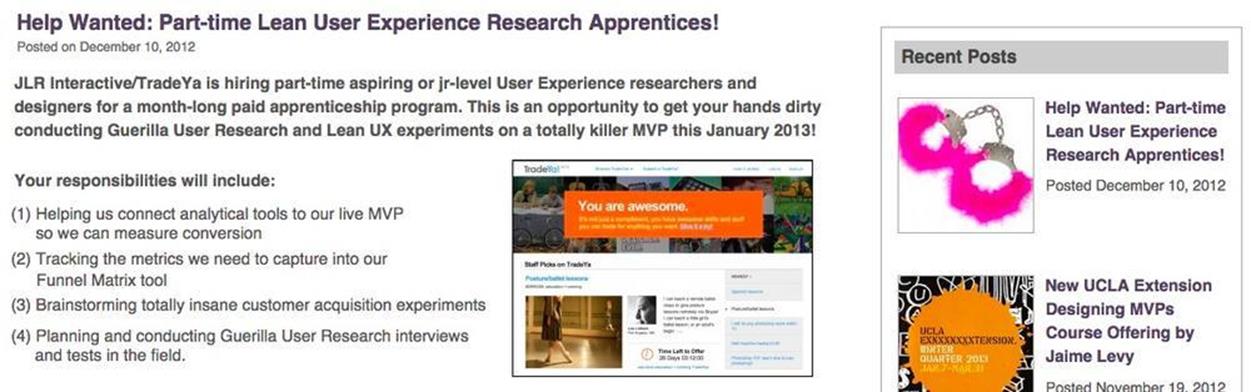
Figure 9-2. Help wanted: experimenters for testing the TradeYa MVP
Within 72 hours of JLR Interactive’s “Help Wanted: Lean UX Apprentices” post blasting through the Twitterverse and LinkedIn, all 8 spots were filled with qualified individuals, hand-picked for this challenge. They came from all over Los Angeles and included professionals with advanced skills in architecture, marketing, engineering, and psychology, with degrees from MIT, Cornell, NYU, and UCLA. Although some of the apprentices already had an understanding of UX design and the Lean Startup approach, the intent was to take advantage of the cross-pollinating catalyst effect of their diverse expertise and backgrounds from outside of UX by throwing them into the deep end of hands-on MVP testing and optimization.
We were really lucky. Our apprentices were eager and focused when they met for the first time in an intensive workshop on January 2, 2013. During a whirlwind three hours, the eight apprentices were brought up to speed (see Figure 9-3) with the history, philosophy, and MVP of TradeYa. First they learned about the principles of conversion-centric design for customer acquisition. Then we discussed how they would stay aligned through collaboration and task delegation using a cloud-based tool that I devised called The Funnel Matrix.
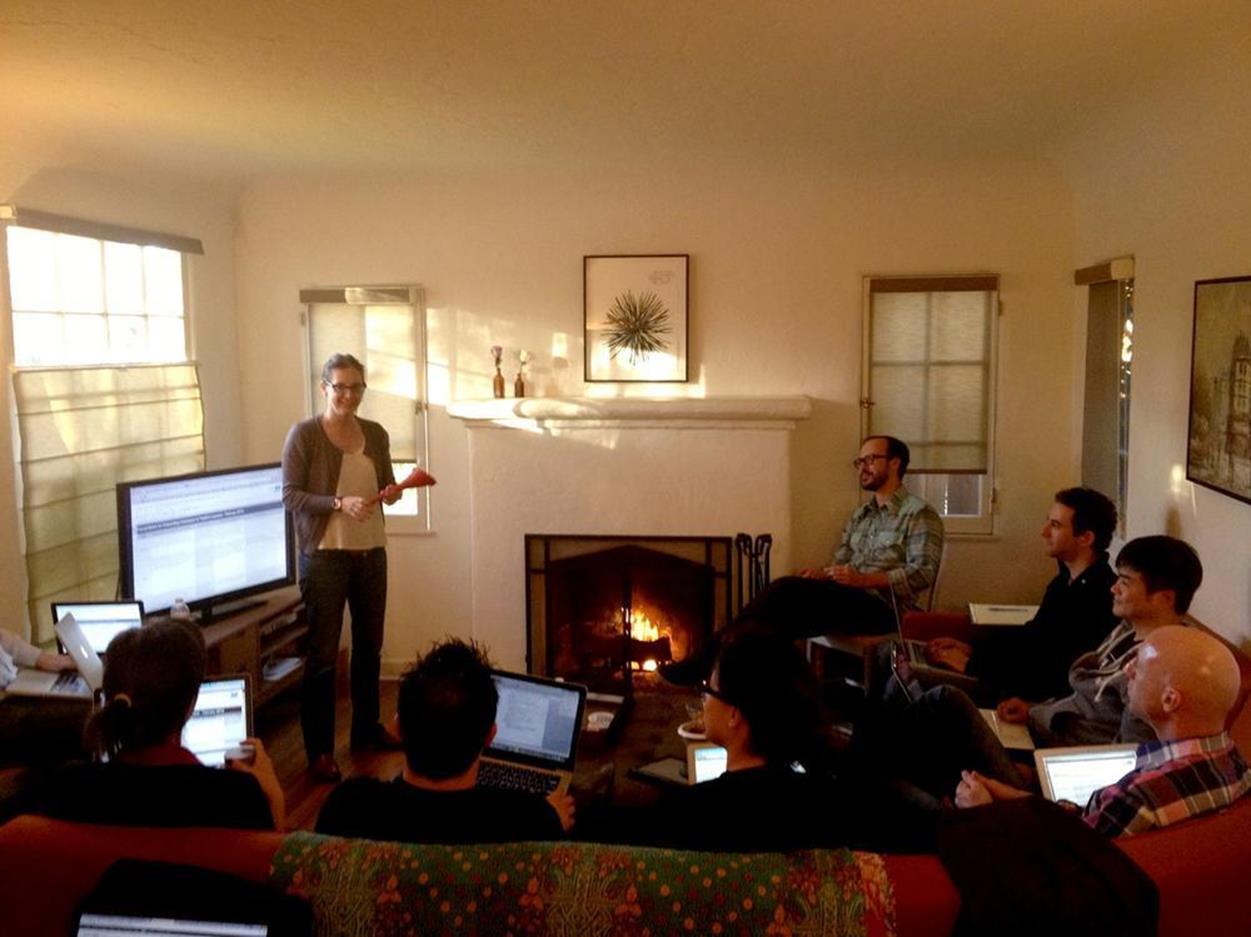
Figure 9-3. Jaime (on left) and Jared (on right) talking about funnels while instructing the eight TradeYa Lean UX apprentices
TradeYa’s testing phase ran from January 1, 2013 to February 28, 2013. Over the course of the first 30 days, the apprentices learned about analytics tools, set up those tools for TradeYa, and then acted as users themselves — trading and bidding on one another’s items — to test the product’stransaction funnel. They would then verify whether the tools were capturing the key metrics accurately. Any changes in hypotheses were also continually updated in the Funnel Matrix, which the entire team could view and track. For our measuring tools, we ended up using Google Analytics and KISSmetrics — the development team added JavaScript code to all HTML pages.
Jared and I closely watched and guided the development to ensure that we got the data points we needed. This way, when we launched the MVP, we would be able to track all the desired actions required for users to successfully trade.
LESSONS LEARNED
§ To design for conversion, you really need to bring together a cross-functional team including designers, developers, product managers, and marketers. The marketing and sales team creates a list of initiatives and must be able to act quickly on it. The development team also has a list of metrics that they need to track and measure.
§ The output of the Funnel Matrix technique directly informs the user flow, feature list, and a short list of wireframes to be designed or redesigned that are optimized for a desired user action.
§ The data and metrics help with every stage in the sales funnel to make continual improvements and give insights into your customers’ actions.
Using the Funnel Matrix Tool
A funnel is a cone-shaped utensil with a tube at the apex for conducting liquid or another substance through a small opening. When I put oil into my car’s engine, I use a funnel to increase the success rate that oil will make it directly to where it’s supposed to go. The funnel is the mechanism I use to avoid waste.
In the ecommerce world, waste happens when potential customers aren’t funneled into the engine of a product. Somewhere along the way, the customers did not sign up, activate their accounts, initiate a transaction, complete a transaction, or some other reason. In other terms, the customer did not experience the value proposition correctly and might have clicked away without satisfying his needs. The design of the ecommerce or digital product funnel didn’t convert him into an engaged customer.
In the book The Entrepreneur’s Guide to Customer Development,[64] authors Brant Cooper and Patrick Vlaskovits use a Funnel Matrix to represent how a prospective customer goes “from Internet ‘Googler’ to satisfied user.” I was inspired to expand the concept and create my own tool for dialing in the metrics directly correlated to UX strategy.
The purpose of filling out the Funnel Matrix, which you can see in Figure 9-4, is to force the entire team involved with the product — stakeholders, product managers, marketers, visual designers, developers, and everybody else involved — to think through all the required actions potential users and customers must make as they progress down the funnel to become repeat users. The Funnel Matrix’s other purpose is to validate, measure, and learn ways to better optimize the user’s experience to increase conversion rates. After I began experimenting with, using, and tweaking this tool, I quickly discovered that it allowed me to be more empirical and less precious with my own UX strategy process.
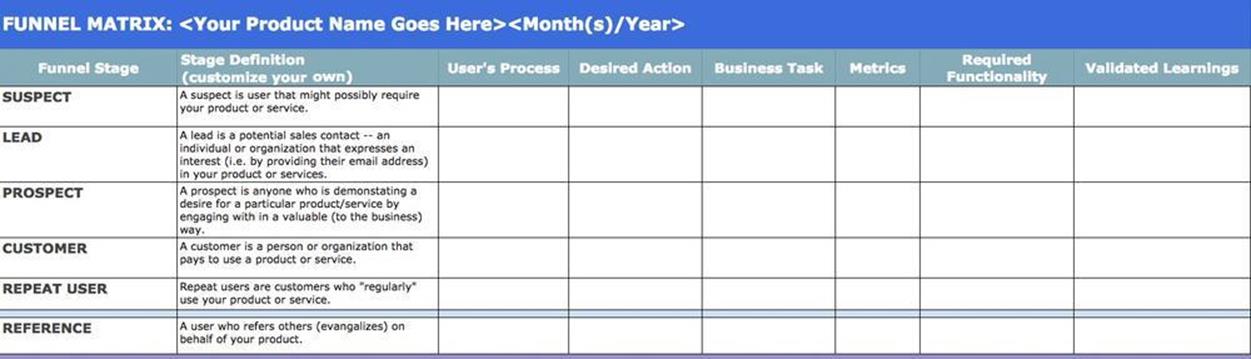
Figure 9-4. Funnel Matrix tool empty template
The Funnel Matrix tool shows different stages of user engagement and acquisition as well as the criteria to evaluate for each stage. I created this Funnel Matrix using Google Spreadsheets so that my team could collaborate and work on it simultaneously. (A copy of the template is available in the UX Strategy Toolkit.)
Note that how you use the Funnel Matrix will depend on where you are in your product development cycle:
§ If you have an existing product or MVP like Jared had with TradeYa, your team can use the entire matrix to optimize it. Tweak and measure your metrics until you get it right.
§ If you are designing wireframes for your first functional MVP, use the Funnel Matrix to speculate on the levels of user engagement and the key metrics you might use. Then, you will test the top (suspect) level with something like a landing page test, which I’ll discuss later in the chapter.
§ If you are still in the conceptual part (storyboards, prototypes, and so on) of your UX strategy, take this as opportunity to get an overview of where you will end up when your team is ready to design for conversion. I’ll also teach you what to do when you’re ready to validate the top of your funnel.
Why a Matrix and Not a Map?
At this point, a few UX strategists might scratch their heads and wonder why I’m not advocating for a journey map (also called an experience map). A journey map looks like a flowchart and shows all touch points. It’s a visual representation of the user’s journey and interaction through the UX of your product. It is generally created from output following a collaborative brainstorming session with product stakeholders. Sometimes these maps are quite complex to decipher, especially if you were not a participant during the session. If you haven’t seen one of these maps, do a keyword search for them on Google Images.
When used effectively, a journey map can aid the UX strategist and stakeholders in envisioning cross-channel experiences through digital and nondigital touch points. Personally, I find that the map takes too darn long to create and lacks accountability because it is rarely benchmarked to the product’s reality after it begins to be released. Here’s what I’ve seen happen all too often: the key stakeholders, internal UX team, or both are called together for a consensus-building session. They break into groups, jot down ideas on sticky notes, and then post them on a wall or board. Everybody stands back while the most assertive participants reorganize the concepts into clusters. At the end of the session, someone takes photos of the lovely yellow papers. The designer turns these concept clusters into what often appear to be zany circuitous informational diagrams that would potentially give Edward Tufte[65] a stroke. The posters are then hung or stored somewhere in the office to hopefully influence employees on their way to the bathroom.
If you strive to be more empirical in your strategic process, you need to develop this approach and deliverable into a system of disciplined procedures that are gauged and updated throughout the product ideation phase and development cycle. That’s why I prefer using a cloud-based matrix as a centralized data depository. With this customizable tool, everybody on a team can work collaboratively and even from multiple locations. You can usually do the first pass in two to four hours, and afterward it is easily accessible for everyone to update. The output is easy to interpret, and, more important, the matrix can serve as a central data depository for metric reports after the product is released and iterated upon. When, in his book The Lean Startup,[66] Eric Ries talks about lean accounting with real-world metrics, this Funnel Matrix is how you can harness it for the UX. So please put your sticky notes away (at least, for now). Let’s begin to explore and fill out the Funnel Matrix tool. (For a different opinion on journey maps, check out what Experience Strategist veteran Holly North has to say about them in Chapter 10.)
Rocking the Funnel Matrix
The first time I tested the Funnel Matrix tool was on TradeYa with Jared. For months, we had been sifting through analytics reports that measured hundreds of user actions and trying to make big-picture decisions based on them. But we figured it would be more efficient to try to make smaller decisions based on validated data output from singular user actions. We needed to focus our time, energy, and money on being able to make meaningful changes to our MVP in order to answer questions coming in from our investors. Thus, Jared, the developers (who Skyped in from India), and I spent an intense four-hour period filling out the exercise.
In the UX Funnel Matrix tool, you have rows and columns made up of cells that need to be populated with your team’s carefully considered input. This input is driven by your user’s story, a narrative told over a specific period of time. If Jane discovers your online product (for the purposes of this example, TradeYa) while cruising her Facebook feed, what stages must she go through to become an active user? She’s probably not going to go from “suspect” to “repeat user” in one giant leap. Instead, she needs to be effortlessly funneled to this deeper level of interaction with your product. Therefore, each row conveys a snapshot of her story as she moves through the stages from first-time exposure to a dedicated user who eventually helps you to market your product.
You also want to set a time limit for your experiment, because it gives your team deadlines for measuring expected outcomes for different hypotheses. For TradeYa, we capped our length at 60 days. We wanted this limit because we wanted to know what it would take to have a user transition from a customer who doesn’t pay to one who does. We believed that if we could not make the users convert in this amount of time, we would be at a point of diminishing returns.
The Vertical Axis
The rows in the Funnel Matrix contain the stages of user engagement for your online product. These stage labels should be directly correlated to the business model of your product, as illustrated in Figure 9-5. Different products require different engines for growth. There is a great table in the book Lean Analytics[67] that I like to refer to while I go through each of the rows.
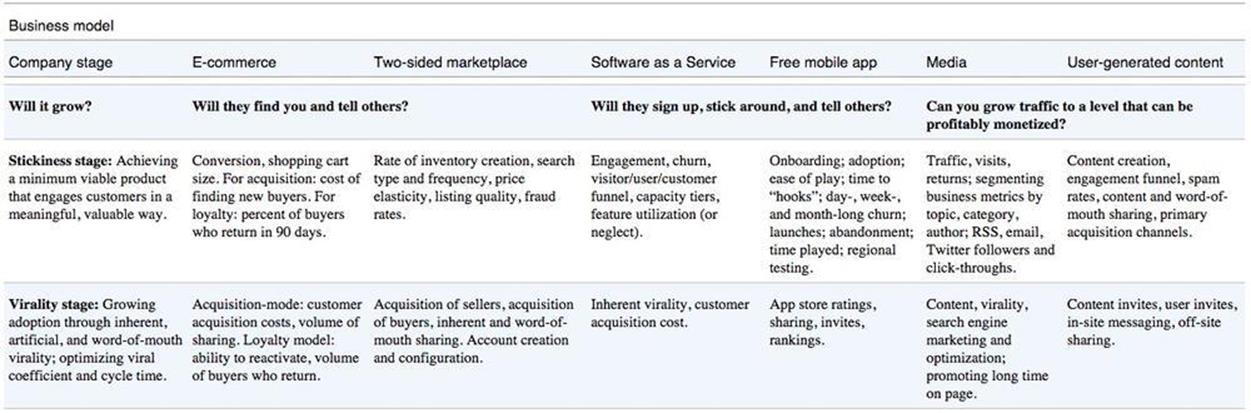
Figure 9-5. Business model stages from Lean Analytics
I recommend that you start the Funnel Matrix exercise with the generic stage definitions provided but take time to customize them as the content and the data for the other cells falls into place. You might not need the exact stage labels shown in Figure 9-6, because there will be known and unknown exceptions about how people will engage with your product. But these generic labels will get you started. What is crucial about the stages is that they flow as a linear and measurable progression down the funnel of the product.
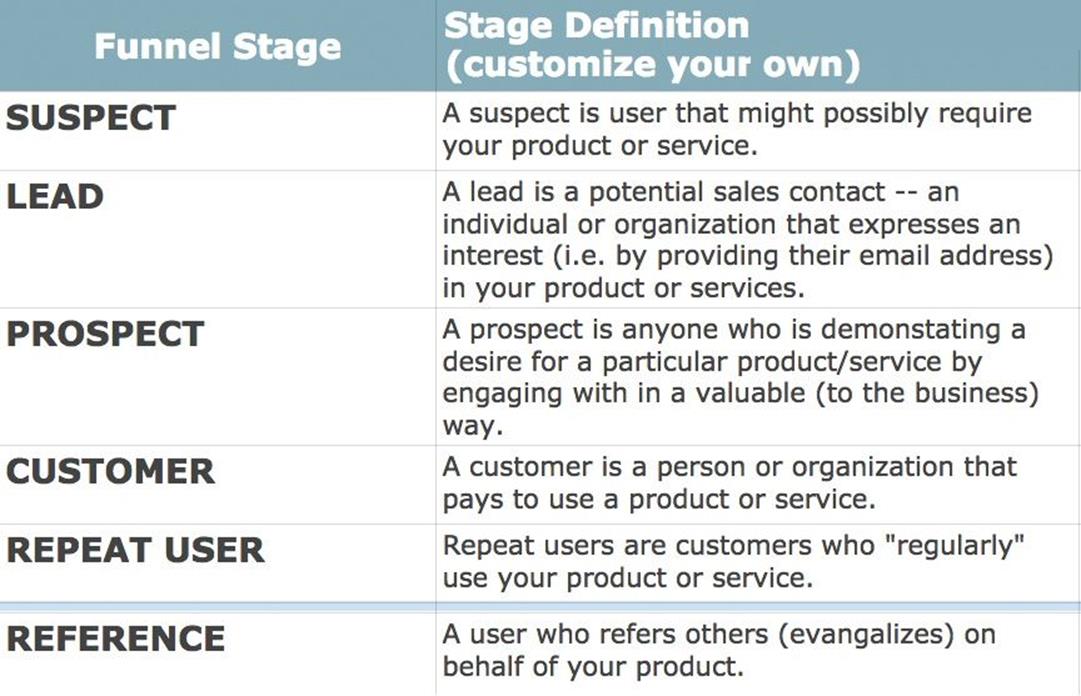
Figure 9-6. The vertical axis of the Funnel Matrix
Start by trying to make it across the first row before defining the other stages, especially if you are new to customer development techniques. As the desired actions come into focus, you will understand that the definitions are directly tied to your actual user engagement strategy as users first begin to discover your product. Then, you work your way down. The column headings are the different factors that you need to discuss and debate with your team. I’ll explain these in more detail later in the chapter.
For each stage, I will first give a generic description and then an example of what specifically we put into a cell for TradeYa. For this chapter, I will also modify the definition given at the beginning of the book in which the term “user” is interchangeable with the term “customer.” For the Funnel Matrix, a user will be defined as someone who moves from the beginning of the funnel to the end and then becomes an engaged (and paying) customer.
Suspect stage
A suspect is a user who might possibly require your product or service. For TradeYa’s Funnel Matrix, a Suspect was anybody who had or ever wanted goods or services. Yes, this sounds like everybody because, in fact, it means everybody. Therein lies a problem; a horizontal marketplace containing everybody is too wide. To zoom into your suspect, you need to narrow the categories to the types of goods or services that your specific segment would want. As depicted in Figure 9-7, the TradeYa Suspect is also somebody who thinks it would be cool to trade things for social reasons. We knew this type of user existed because of clothing swaps, collector clubs, and other trading sites. We felt like we were looking for a Suspect who was similar to a user who might use the bartering section on Craig’s List.
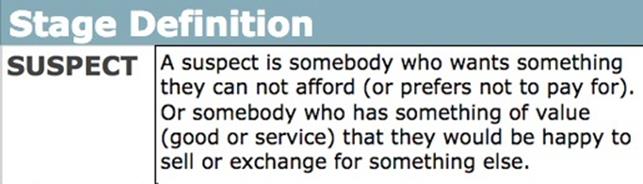
Figure 9-7. Zoomed into the Suspect stage of the TradeYa Funnel Matrix
Lead stage
A lead is a potential sales contact, an individual, or an organization that expresses an interest in your product or services by providing you with some personal contact information, generally via email. You want to have a means to contact them. This begins your official relationship with the user.
For TradeYa, a Lead is somebody who landed on a TradeYa page, regardless of how she gets there, and then signs up for the site. She could come from various touch points: social media, word-of-mouth, or an organic search.
Prospect stage
A prospect is anyone who has a need and strongly wants this need met through the purchase or consumption of your particular product. He is now in the negotiation phase toward becoming either a paid customer or engaged user (to be defined in the next stage).
For TradeYa, a Prospect is somebody who sees something he specifically wants or has something specific he wants to trade; he posts something to trade or he bids on a trade already posted on the site. This user takes the first action possible on the MVP interface toward engaging in an actual transaction of our key experience.
Customer stage
A customer is a person or organization that is valuable to your business model. Customers either pay to use the product or they contribute something that is valuable to other users. In a two-sided market and in the freemium economy of the Web, this could be content, a listing, or request.
For TradeYa, a Customer is a user who engages in and completes a successful trade. This means that after bidding, she wins the trade and successfully completes the transaction, or vice versa.
Repeat User stage
Repeat users are customers who “regularly” use your product or service.
For TradeYa, a Repeat User is somebody who is involved in multiple transactions. He trades something and then continues to offer or bid on items or services to trade.
Reference User stage
A reference user is somebody who refers others to the site based purely on her initial or continued experience. She brings other suspects to your product by spreading the word. This is called virality and feeds that engine of growth (refer to Figure 9-5).
The reference user can refer people to your product regardless of what stage she is in the funnel. References are crucial to improving your sales funnel because they bring new users to the site through their own personal recommendations. You must love these people and work diligently at making them insanely happy with your product.
For TradeYa, a Reference User is somebody who shares a TradeYa page, whether it is one that she was promoting or just a page she found interesting.
The Horizontal Axis
User’s Process
The User’s Process (see Figure 9-8) describes the types of activities that users will be engaging in at each stage as they experience your product. Where are they exactly? What task are they trying to complete? For the UX designer on your team, the User’s Process is probably going to be the easiest step in the Funnel Matrix to articulate.
For the TradeYa example, let’s begin with the first level of user engagement — the Suspect. What if I were to walk outside of my house and begin screaming at the top of my lungs, “Stop spending money. Use TradeYa!” For the neighbors who hear me, this action would trigger their first impression of TradeYa as a product. A new neighbor across the street — one who doesn’t know me — might either ignore me or call the police. However, my friendly next-door neighbor might overhear these words and want to learn more.
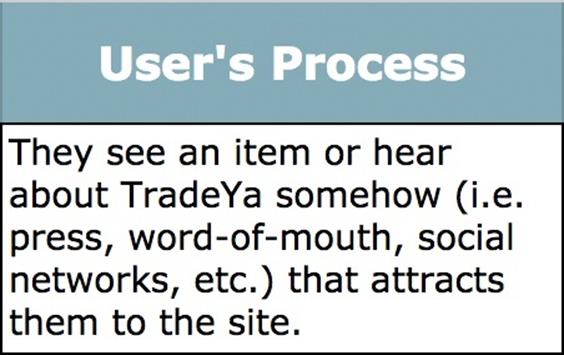
Figure 9-8. User’s Process cell in the TradeYa Funnel Matrix
Consequently, for the Suspect’s user process, you must think, “What are my initial touch points with potential customers?” The phrase “touch point” is business jargon for however you first “touch” or engage with your customer. A Suspect might discover TradeYa on social media. Or, instead of discovering a product through a neighbor’s yells, maybe he sees a friend’s tweet or Facebook post with a shared TradeYa link: “Check out this surfboard that I’m trading!” Suspects also might discover TradeYa or a TradeYa item listing through an organic search.
Ultimately, what should go in this column cell is what your team thinks are the most likely ways users will initially discover the product. These “ways” are your sales channels and tactics for acquiring customers. Discover, explore, and experiment with all of them.
Desired Action
The Desired Action for the Funnel Matrix (see Figure 9-9) is what you hope users do in response to the “process” they just experienced. It is the action that you want them to take. This could be anything from favoriting a tweet, downloading your app, or clicking a link to a web page.
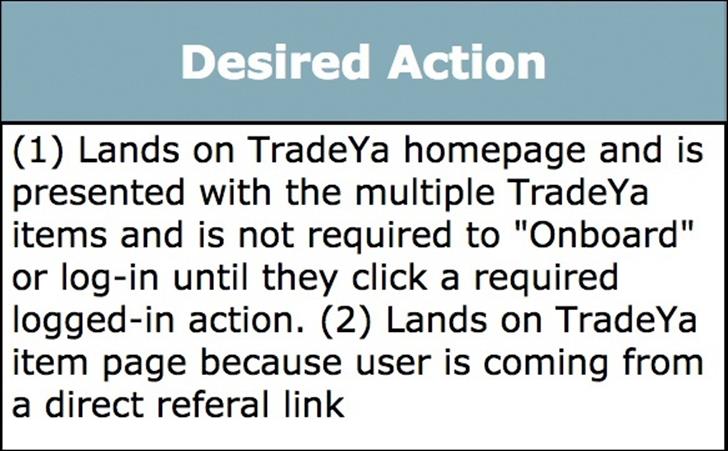
Figure 9-9. Desired Action cell in the TradeYa Funnel Matrix
Let’s go back to my TradeYa example on the residential street. If my new hypothetical neighbor hasn’t called the police, she potentially a) whipped out her smartphone and googled TradeYa, b) searched for TradeYa on her computer later at home or work, or c) shared the strange experience with her social network or at the office with her coworkers around the espresso machine.
But joking about yelling aside, the desired response for the Suspect stage is for your user to have a positive reaction to her first exposure to your project. Obviously, bad first impressions equal very bad UX. You must ensure that the suspect reacts in the way that you want. Think about what happens next for her in terms of the type of content/messaging/experience that she encounters. Are there one or more scenarios or technology contexts (for example, mobile versus desktop) that need to be addressed? Do all new users come through the front door (your product’s home page) or can they also come through various side doors (a Facebook link from a friend’s feed that goes to a product-level page)? In each case, you’d better ensure that the value proposition is conveyed clearly.
To fill out the Desired Action cell in your Funnel Matrix, think about what your primary goal is for that user to perform. It could be any type of activity, ranging from getting the user to enter his email address, to signing in with his Facebook account, to clicking the “Place your order” button. If your product’s revenue stream is from selling banner or video advertising, the goal is to make the content pages more compelling with plenty of “Read More” links to keep customers clicking and swiping. If you want to increase the Time on Site (ToS), you probably want plenty of related onsite articles to keep users bouncing around your pages like an endless game of pinball.
The desired response can be different depending on the user’s level of engagement. A suspect just needs to have a positive experience, but a Customer might need to respond by clicking a Submit or Buy button. Think on a granular level about the shortest path of required actions to get your users happily down the funnel.
Business Task
Now take off your UX strategy hat and put on your marketing cap. It’s time to look at the Funnel Matrix from the standpoint of your business goals, as illustrated in Figure 9-10. This is where you need to address what must happen behind the scenes to enable the user’s process. This includes both tried-and-true online advertising campaigns and new forms of growth hacking. The basic concept is to build marketing organically into the product, as opposed to piling it on top of the completed product and then tying it back with metrics. This is absolutely critical to the UX strategy. Business strategy and interaction design must go hand-in-hand.
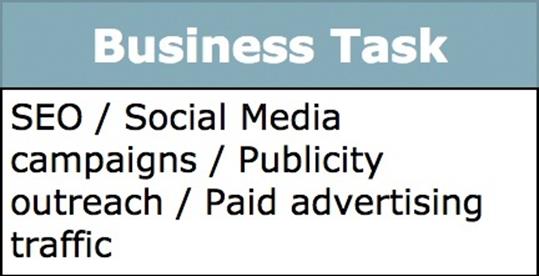
Figure 9-10. Business Task cell in the TradeYa Funnel Matrix
Thus, the business task at the Suspect stage for you and your team is to find new channels and try lots of experiments to reach your potential customers and grab their attention. This requires consideration of the different touch points and contexts in which users might discover your product — on Facebook, on their mobile devices, on their computers at work, or simply overheard at the espresso machine.
Fill your Business Task cell in the Funnel Matrix with creative and rational expectations for your business to meet, such as buying Facebook advertising to increase traffic or clever social media campaigns. You want to get users to promote your product because it makes them look cool. Just know that whatever you place in this cell needs to be truly supported by the business to obtain your desired actions.
Metrics
As sales and marketing people know too well, success is determined by the numbers. Your Funnel Matrix metrics are your units of measurement for how well (among other things) your users have performed your desired action. They can also tell you things such as how many users came from Facebook versus LinkedIn, or which of the top three major cities in the US sent the most traffic volume to the site. Metrics can be powerful indicators of success or failure if you choose to measure the right items and if that data is accurate. For each stage of user engagement, there will be one particular metric that really matters. Focus on that one like an obsessed “closer” who wants to keep his target customers engaged.
In the case of the TradeYa Suspects, this meant being able to analyze data about the behavior of new visitors, as shown in Figure 9-11. If the Suspect didn’t come to TradeYa through the home page, what therefore were the most trafficked pages? What was the bounce rate? How many minutes did she interact with the site? Analytics tools provide a lot of data, but it’s up to us as savvy and smart UX strategists to know which data represents the key metrics at each stage.
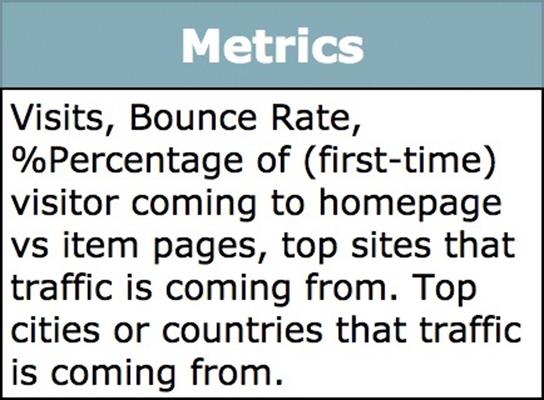
Figure 9-11. Metrics cell in the TradeYa Funnel Matrix
What goes in metrics columns are those quantifiable “things” you plan to measure at each stage that specifically tie a user’s action to a level of engagement. Metrics are shown as totals, percentages, and ratios. Marketing people, stakeholders, and your design/development team should all become familiar with what the metrics mean. For example, a common metric is the “Average Visit Duration” (see Figure 9-12), which represents the time a user spends on the site and is measured in minutes and seconds. But this metric is more relevant for certain business models such as media sites trying to sell advertising. For ecommerce sites we should be looking at transactions. For SaaS, we dread “churn,” which is the number of customers lost over a given time period. A primary goal in SaaS is customer retention. Retention = stickiness = habitual use = returning customers.
Figure 9-12 presents the Average Visit Duration metrics for a page on TradeYa.
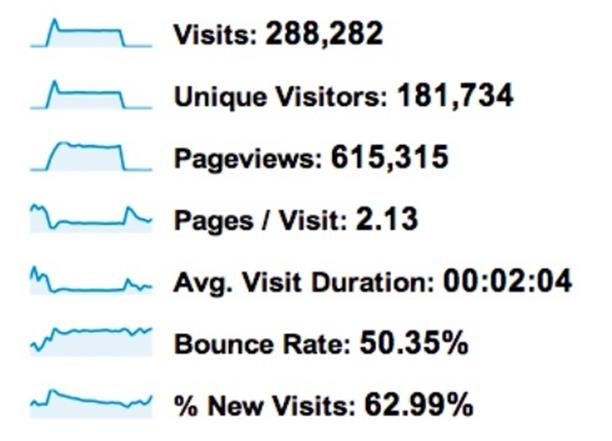
Figure 9-12. TradeYa monthly metrics from 2013
Lean Startup guru Eric Ries states that the real metrics are “actionable metrics that either confirm or refute a previously stated hypothesis (stated in customer discovery).” This means that you want to measure things that demonstrate your product is actually working and that the users are engaged. However, investors and stakeholders like totals and percentages, so a common trap is to look at page views or other vanity metrics that don’t represent anything more than your ability to buy or drive traffic to your landing pages. Vanity metrics only represent how many people have come to your front door. What really matters more is what percentage of those people opened it and began snooping around. It’s easy to get lost in all the data that can be captured or to measure the wrong things that mean nothing at all. Your focus needs to be on measuring true indicators or “key metrics” that signify that your value proposition is working. Investors and stakeholders want to know about percentages.
Required Functionality
The required functionality are the features and platforms (i.e., Twitter) that your team must enable and integrate for that level of the funnel to work from a UX perspective. Filling out this column is a shortcut to distilling the feature set for an MVP or beta version of a product. This feature set must work for an entire user journey and is absolutely critical to the product itself working.
Each feature needs to be something that will make the product better and easier to use rather than more complicated. Focus on the features that enable the product to work well and that are carefully considered from these multiple perspectives: user value, level of effort to build, and business value. Balance the level of effort it will take to build the feature set against the impact it could have on the product. How many people will actually use it or have requested it? Is it a unique feature to your product that will set it apart from competitors, or will it just be a neat gimmick that people will try once and never use again? The Funnel Matrix tool will help you to measure the impact by tying it to specific engagement metrics. After you have traction, you can experiment with more risky features.
For TradeYa, the features that were absolutely crucial were the ability to bid on an existing trade and the ability to post a specific item to trade (see Figure 9-13). Account creation was circumvented by requiring users to have and sign-in via a Facebook account. We also needed a polling feature to learn what our customers were interested in trading. As discussed in Chapter 7, we chose to hold off on user profiles and a transactional system because they were not critical to our first goal: get people to trade something on TradeYa with the lowest barrier to entry.
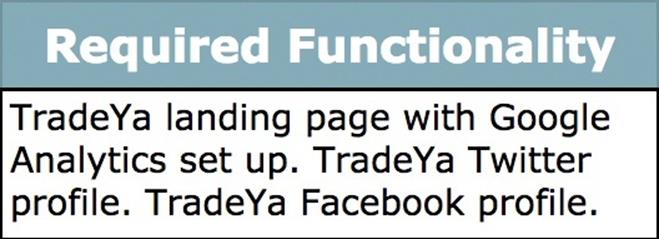
Figure 9-13. Required Functionality cell in the TradeYa Funnel Matrix
Validated Learnings
At this point, we take heed and inspiration from Thomas Dolby and his song “She Blinded Me With Science”: “She blinded me with science and hit me with technology.” Yes, it’s time for you to put on your lab coat and think like scientists, logically and without emotion. The entire purpose of this Funnel Matrix is to help you answer qualitative questions about your product using verified data for comparative benchmarking. These questions that you ask are to keep your team honest about your customer’s behavior and business tasks throughout each level of engagement. Like scientists, you must ask tough questions, analyze your data, and not be blinded by your own hopes for the outcome. Keep it real.
For TradeYa, the big question at the Suspect stage was “Where were our customers coming from who would become long-term customers?” We wanted to know which of our channels (Twitter, Facebook, Google Ads, or organic search) was the most effective. We needed to do more of whatever was working. After our suspect landed on a TradeYa page, the validated learning became more specific to the suspect’s actions. What types of goods or services had the most people bidding to trade? For goods, was it laptops or furniture? For services, was it web consulting or day laborers? Were people trading more goods than services? We wanted answers to help us fine-tune the site and match the enthusiasm demonstrated by early adopters when Jared was providing concierge service. We needed to understand at a granular level who they were, where they came from, and what things they were most interested in trading.
The things you expect and need to learn about your customers go here (Figure 9-14). You are trying to devise a predictable and scalable methodology for generating engaged and evangelistic users. To get there you need repeatable outcomes from your experiments and metrics. You will notice that the questions become more specific about your customer’s behavior as their engagement with your product progresses down the funnel.
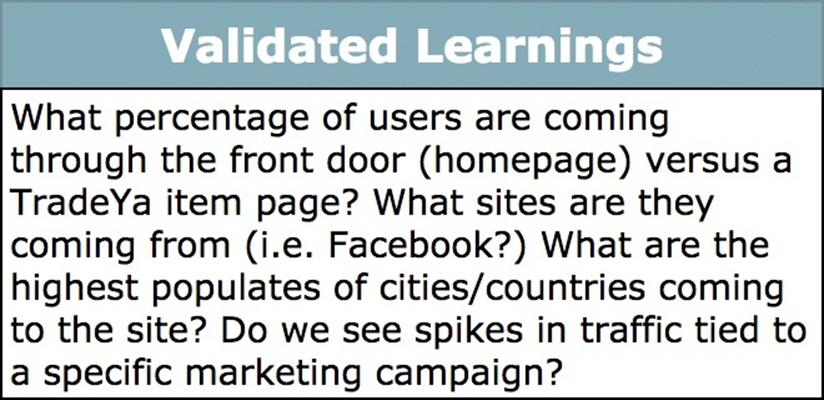
Figure 9-14. Validated Learnings cell in the TradeYa Funnel Matrix
You need to use every logic circuit in your brain to ensure that these questions are answerable and measurable. How much traffic has come to the top-level home page from organic search compared to an item page from social media? This is a measurable question. How intrigued were these users when they got to the landing page? This is not measurable.
In his book Programmed or be Programmed,[68] Douglas Rushkoff writes: “[Not] everything is a data point. Yes, thanks to the digital archive we can retrieve any piece of data on our terms, but we do so at the risk of losing its context.” What Rushkoff is talking about is the ability to look at data with a discerning eye. Or, if possible, find a way to cross-reference the validated hypothesis against other data points. So show another team member your logic for tracking metrics that validate or disprove any meaningful customer discoveries. Make sure you all agree your learnings are correct.
By now the funnel matrix exercise might feel like a science experiment. That’s because it is. You are conducting a methodical procedure with the goal of validating or falsifying your hypothesis — your product’s unique value proposition to your perceived customers. You are using metrics to give insight into whether the cause (user process + business task) will generate a positive user effect (desired action). The outcomes (success or failure) are basically your validated learnings. The Funnel Matrix you develop will become a Build, Measure, Learn device that you deploy, rinse, and repeat throughout the weeks or months of your testing phase or even the entire life cycle of the product. It can be the reference point (see Figure 9-15) as the business makes continuous improvements. The UX person on your team can even lead the Funnel Matrix development.
Remember, though, this tool requires a balanced and involved team to solve the many problems and puzzles of your user’s experience. The UX designer shouldn’t and can’t realistically work alone. The main reason is that so much of what will make the Funnel Matrix indispensible to your team is tied up in the analytics and metrics of your product. Instead, this is a chance for a savvy marketing team member to shine by growth hacking the Funnel Matrix to possible customer acquisition initiatives, as I explained in the beginning of the chapter with the TradeYa Apprentice Program.
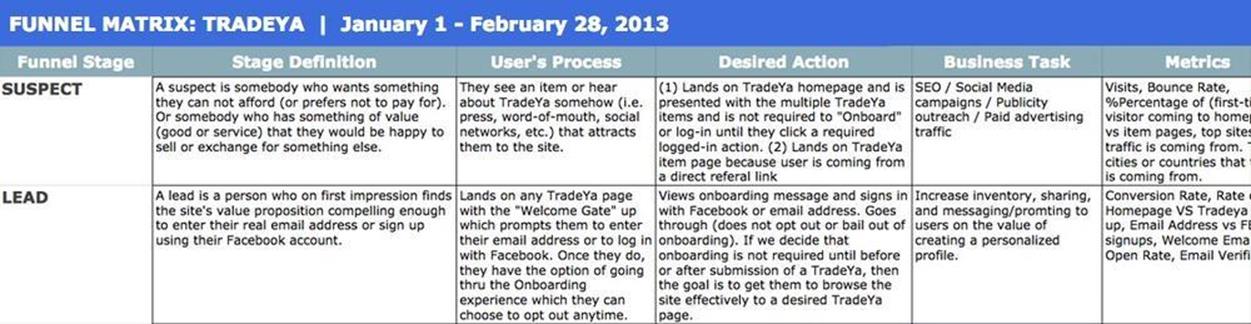
Figure 9-15. Top portion of the TradeYa Funnel Matrix filled out
ANALYTICS TOOLS FOR UX DUMMIES
Let’s take a short break to briefly examine some useful analytics tools available today for tracking the right metrics for improving the UX. You must measure your experiments to know if you are converting users as your team releases new iterations. Specifically with the UX strategy, you need to know if your layout tweaks are helping to increase user acquisition, engagement, and successful transactions. The danger of talking about specific tools is that the best tools du jour constantly change. So I broke them into the following three categories.
Enterprise-oriented analytics reporting tools
Popular tools: Google Analytics, Adobe Analytics
High-level description: Reporting tools are focused on generating detailed statistics about an app or website’s traffic and traffic sources. Google Analytics is the most widely used service and offers both a free basic service and a premium version. Adobe Analytics (formerly Omniture) is another tool that is focused on the enterprise market. These tools require a developer or analytics specialist for both implementation and monitoring.
Dashboards, funnel conversion, A/B testing
Popular Tools: KISSmetrics, Optimizely, Geckoboard, Mixpanel, Totango, Chartbeat
High-level description: Dashboard and conversion tools give you one visual place to watch all your metrics in real time from numerous services (for example, Google Analytics and Facebook). You can use them to measure customer engagement and retention by reporting on specific actions. They also focus on segmentation, so you can see who your users are and where they are coming from, and break them up into cohorts for conducting A/B and multivariate testing.
Email delivery/tracking services
Popular Tools: SendGrid, MailChimp, iContact, Constant Contact
High-level description: Email service providers are used for sending out highly targeted messages to website visitors or mobile app users based on what they do (and don’t do) while they are using the product. “Deliverability” is the measure, usually expressed as a percentage of how many emails actually make it into the inbox of your user. Successful campaigns are based on a solid marketing strategy for sending the right amount of timely and relevant content to keep users engaged with the product and not opting out.
Conducting Suspect Stage Experiments with Landing Pages
What if you don’t have a product or MVP at this stage in the game? Well, you still have a funnel to work with, but it will just all be hypothetical. You can’t really connect any metrics to any of the levels yet, except for one: the Suspect.
You can potentially growth-hack the Suspect stage of your funnel with Landing Page experiments. But, before I get into that, let’s begin with a few basics. A landing page is a web page that is not the home page of your product. Landing pages are designed to specifically elicit one key action from users. They are also sometimes called lead capture pages, squeeze pages, and destination pages. Users are driven to landing pages from multiple touch points — organic search results, advertising, and social network campaigns. The pages are basically specifically designed to suck potential customers into the top of your funnel.
There are many different ways in which you can use landing pages on unwary suspects to validate a value proposition. I will use case studies to illustrate how.
Case Study 1: When a Value Proposition Needs to Pivot
Chapter 8 recounts how the software engineer who conceived the idea for a Hotels.com-type website for rehabilitation centers found himself in a pretty tough spot. Figure 9-16 shows what the Book Your Care original home page looked like.
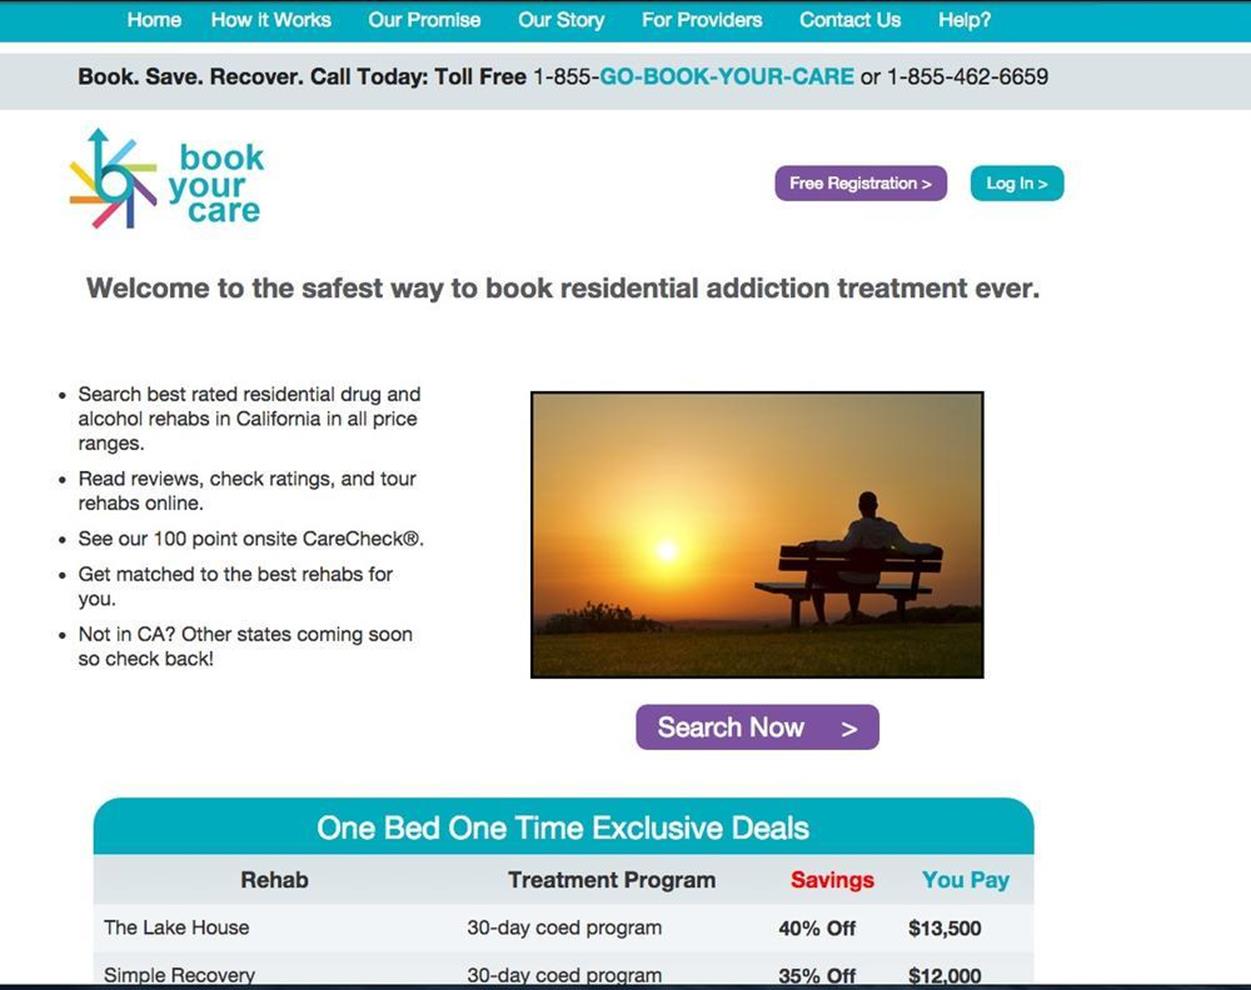
Figure 9-16. The Book Your Care original home page
The guerrilla user research that we conducted on his behalf had invalidated his business model. The current website was not working, and he knew that spending money on a redesign without proper validation was going to be wasteful. So what could he do?
He needed to know if the affluent customer segment would be as enthusiastic about his value innovation as the control group from the user research. My team and stakeholders hustled to find a channel to this user group. We ran ads on Craig’s List. We took out advertising in glossy magazines in Beverly Hills. The client and I even went to Alcoholics Anonymous meetings where we posed as loved ones of addicts to learn more about our elusive customer. That’s when we decided to run a Landing Page experiment as a last-ditch effort. We knew we needed to run this online advertising campaign to target the affluent customer segment. But treatment centers spend millions of dollars targeting this group on Google and Facebook. So not only would the campaign be expensive, but our ocean was going to be bloody red. We decided to use a product called Unbounce to quickly build out variations of the value proposition and test them by using targeted online advertising campaigns through Google and Facebook. This effectively put the current site on hold. We wouldn’t disrupt any of the complex backend. The developers wouldn’t have to waste any time, energy, or money on fixing it for the experiment. Instead, if any suspects did go through our Landing Page experiment, we would concierge them (as Jared did, as described in Chapter 7) through the process of booking a treatment center.
Figure 9-17 shows what the test landing page looked like.
To drive traffic to our landing page, we did targeted advertising on Facebook. We ran ads to users who lived in wealthy neighborhoods in Los Angeles. Here is where you want to be careful, because it’s easy to spend more money than you want or need to for a small trial. That’s why we came up with the following boundaries:
§ We decided on an initial budget of $500.
§ We determined the key words for the campaign.
§ We finalized the advertisement copy to ensure that the messaging would be strong enough to drive suspects to the landing page.
§ We established the customer demographics (such as education, city, and age).
§ We decided on when exactly the campaign should start.
§ We placed the campaign, which you can see in Figure 9-18, and then we waited!
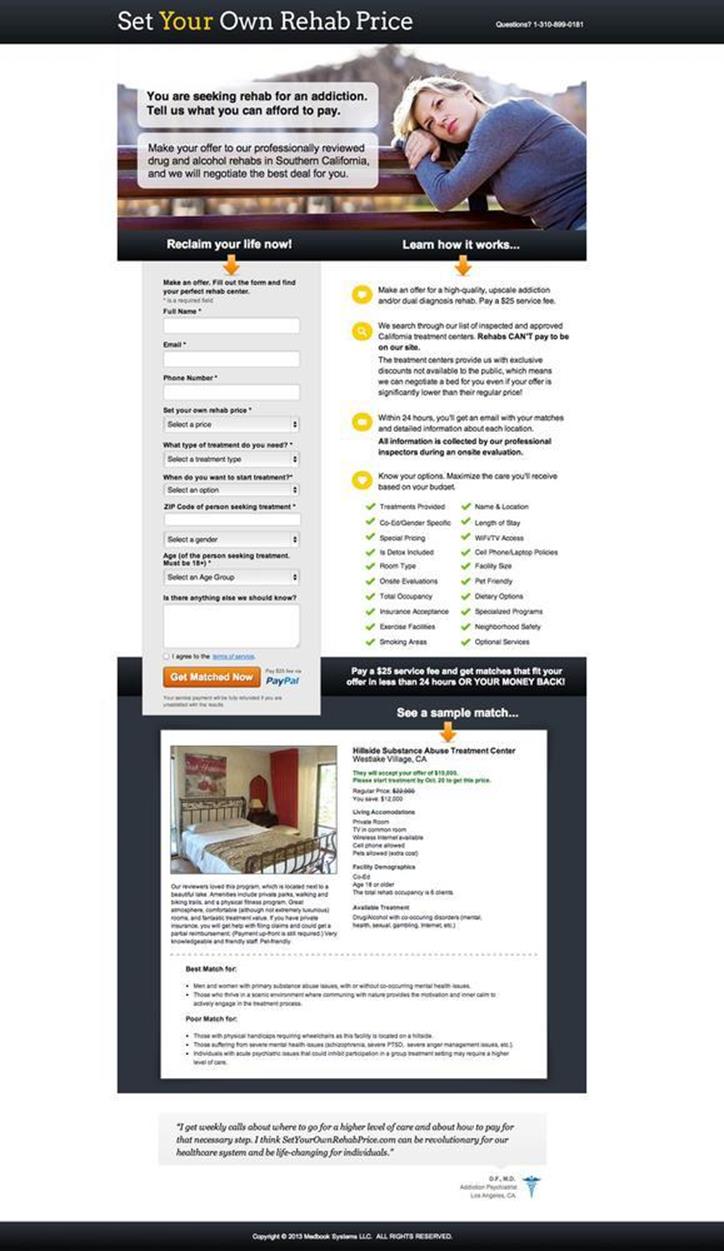
Figure 9-17. The Set Your Own Rehab Price landing page

Figure 9-18. The Facebook ad campaign
Because my team used a robust tool like Unbounce, we were able to run two variants of the landing page simultaneously from one Facebook campaign. Unbounce automatically directed half of our traffic to each page. The two landing pages tested two different pricing strategies, as depicted in Figure 9-19. This is called A/B testing.
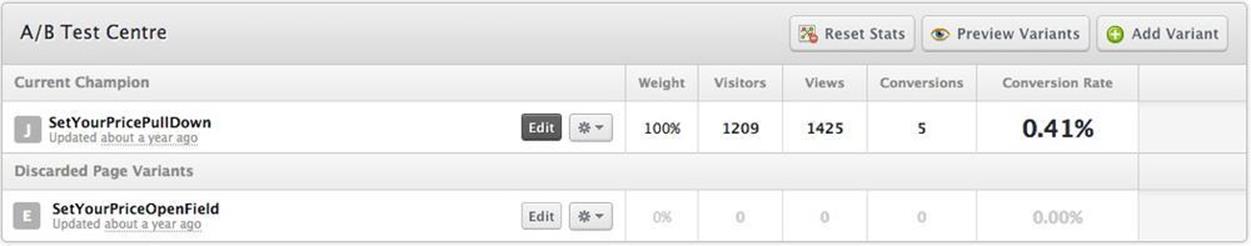
Figure 9-19. A/B Testing Centre dashboard
In this experiment, our key metrics were the number of visitors who clicked the Facebook advertisement (suspects) and then the conversions that we got — how many users would buy into the value proposition and give us their contact information (leads). In Figure 9-19, you can see that out of 1,000-plus visitors, only 5 users were converted successfully into Leads. Half of them were representatives from other treatment centers trying to do some research on the competition. The one person whom we did manage to concierge was for a food addiction.
Case Study 2: When a Value Proposition Needs to Acquire Leads
Another reason to experiment with landing pages is lead generation. The goal is to acquire as many email addresses as possible of real people who have had some level of exposure to your value proposition. In Chapter 7, I explain how Jared created an explainer video to articulate the benefits of trading. This occurred before our MVP testing phase, and it’s a good example of customer acquisition through landing pages.
First, Jared ran an ad campaign on Facebook. He specifically targeted Facebook users who lived in the US who had “liked” the Beats by Dre electronics page. He ran two different ads, one of which you can see in Figure 9-20.

Figure 9-20. TradeYa Facebook online ad campaign
Users who clicked on either campaign were directed to the landing page shown in Figure 9-21, which had the explainer video on it. Basically, Jared used the giveaway to drive traffic to the landing page. When users arrived on the landing page, they could not simply submit their email address for the contest and leave. Instead, they had to watch the video and answer at least one qualitative response to a question. This meant that suspects had to watch at least five seconds of the explainer video, which in turn meant that they were exposed to the value proposition. Jared didn’t want a suspect’s email address unless the suspect got the gist of TradeYa’s value proposition.
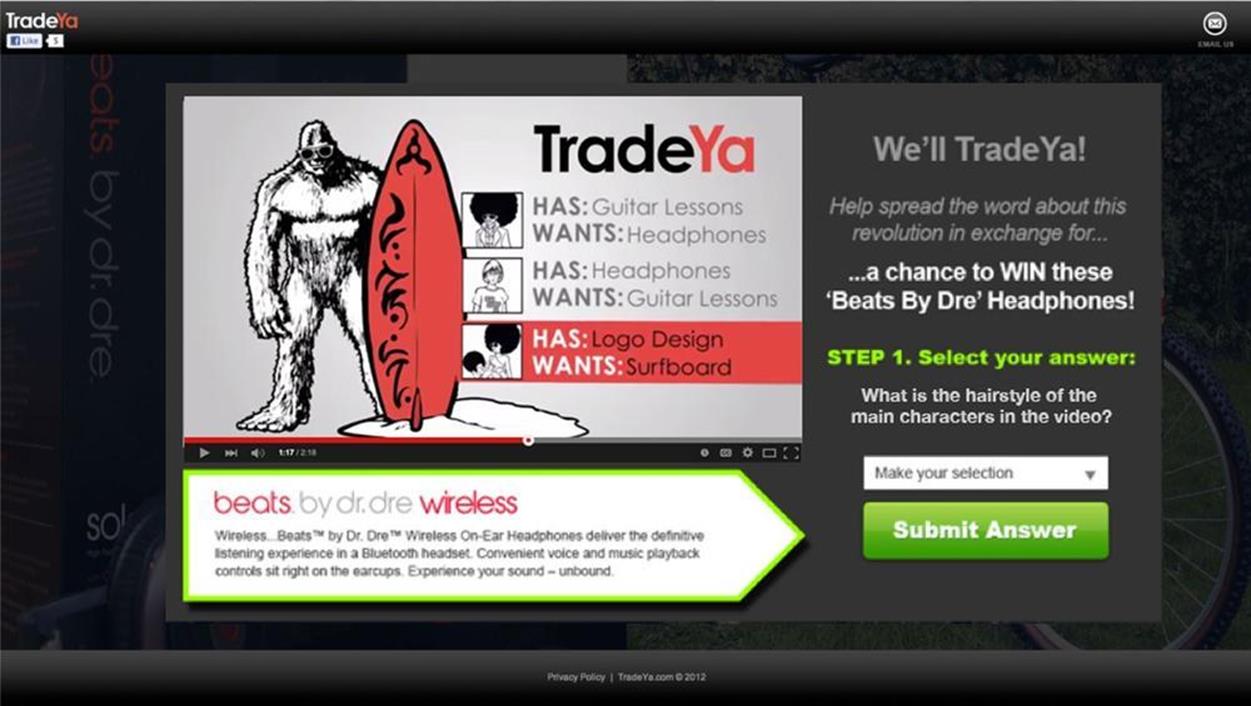
Figure 9-21. TradeYa landing page to enter giveaway contest
Jared spent $2,000 running the campaign, which went out to millions of users. Of those, 6,700 people clicked the Facebook advertisement, which directed them to the landing page. Of those, 5,000 people entered the contest, which meant 5,000 people were exposed to the value proposition, turning them from suspects to leads. This meant he had 74% conversion. In terms of cost for conversion, Jared paid 33 cents for the click, and 41 cents for the email address.
Some people might still say, “So what? The guy has a bunch of emails of people who just want free headphones.” Well, Jared has the metrics to answer that, thanks to his very carefully thought out Landing Page experiment. More than 5 percent of the people who entered the contest started sharing TradeYa on their social networks. That made them references — they were evangelizing the value proposition to other potential suspects. When our MVP launched, Jared had 5,000 people to directly send email to, induce them to activate their accounts and be ready to engage in trading on the site. Presented in those terms, I’d call the conversion achieved by his Landing Page experiment a success.
How to concoct a Landing Page experiment
If you decide to use a Landing Page experiment for your value proposition, you’re in luck; there are many WSYWIG tools for landing page testing available. They vary from simple and free to robust and expensive.
What is important when choosing a tool is that you pick one that allows you to easily:
§ Add plug-and-play widgets and form modules as needed
§ Assign your own domain name
§ Track the conversion of your pages
To create your Landing Page experiment, you can follow this simple framework, which is basically how we ran the case studies I just described:
1. Define the experiment and determine what part of the customer experience is being tested and how it corresponds to the value proposition.
You are testing your value proposition, a pivot, or trying to acquire users. As you read in the case studies earlier, it’s really important that you try to figure out how to correspond the quantifiable results you get from your landing page to the questions for which you need answers.
2. Design/build your landing page.
The primary function of a landing page is to convert the suspects who have landed there deeper into your experience/product by exposing them to your value proposition. This conversion must happen as fast as a 30-second commercial. You need to convey to potential customers what your product does, using whatever media does the trick. This is when you want to bring the content or brand strategists into the conversation if they are available, because you need to distill your product into something digestible by using text, photos, and video. In Chapter 3, I discuss the “pitch” aspect of the value proposition. That’s the thing the landing page needs to communicate.
You might also need to think through the experience after the user submits the form. Ideally, it will just be a Thank You page that explains the next steps. In the case of the software engineer’s product, we also included a phone number in case users were nervous and wanted to talk to us, as shown in Figure 9-22.
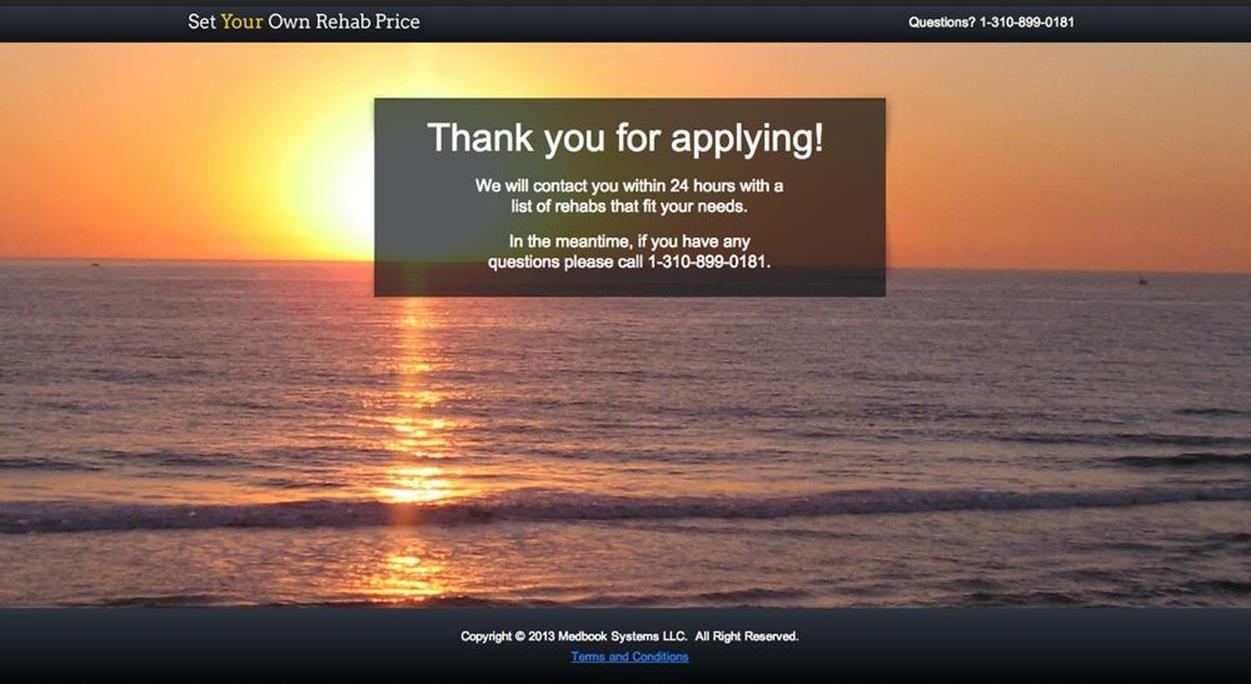
Figure 9-22. The Thank You page
3. Design/build the secondary pages.
You’ll want to run variants of your landing pages to test different value props, features, copy, and UI design patterns.
4. Run a “controlled” online campaign for a set amount of time.
Typically, ad campaigns run less than a week. But it all depends on your budget.
5. Measure the metrics for validate learnings.
Everything comes back to your funnel. If you aren’t collecting or looking at the numbers that matter, you can’t make the decisions that will make your product the disruptive invention you’ve always dreamed it could be.
Recap
In this chapter, I showed you how a successful UX strategy uses analytics to optimize the UX design, demonstrated the use of a tool called the Funnel Matrix and its different stages of customer acquisition, and discussed how metrics prove that the customer is progressing into deeper engagement. You also learned how to design for conversion with landing pages and bring together a cross-functional team including designers, developers, product managers, and, most important, marketers.
This concludes all the techniques I will be sharing for conducting UX strategy. Now it’s time to hear from other strategists to see what their perspectives are.
[63] http://en.wikipedia.org/wiki/Growth_hacking
[64] Cooper, Brant and Patrick Vlaskovits. The Entrepreneur’s Guide to Customer Development. Cooper-Vlaskovits, 2010.
[65] http://www.edwardtufte.com
[66] Ries, Eric. Lean Startup. HarperBusiness, 2011.
[67] Croll, Alistair and Benjamin Yoskovitz. Lean Analytics. O’Reilly Media, 2013.
[68] Rushkoff, Douglass. Program or be Programmed. Soft Skull Press, 2011.